Concept Discovery in Collaborative Recommender
Systems
Patrick Clerkin
1and
P´adraig Cunningham
2and
Conor Hayes
3Abstract. There are two main types of recommender systems for e-commerce applications: content-based systems and automated col-laborative filtering systems. We are interested in combining the best features of both approaches. In this paper, we investigate the possibil-ity of using thek-means clustering algorithm as a basis for automat-ically generating content descriptions from the user transaction data that drives the collaborative filtering process. Using the the partitions of the asset space discovered byk-means, we develop a novel rec-ommendation strategy for recommender systems. We present some encouraging results for two real world recommender systems. We conclude by outlining our approach to automatically generating de-scriptions of the clusters and report on an experiment designed to test concepts generated for the SmartRadio recommender system.
1 INTRODUCTION
A key role for intelligent systems in e-commerce is product recom-mendation [2]. Large e-commerce sites can have millions of products and customers. Since it is necessary to automatically match products to customers, recommender systems based on statistical, machine learning and knowledge discovery techniques have been developed to meet this need.
Broadly, there are two major approaches to the recommendation task, namely, content-based recommendation and automated collab-orative filtering. The objective in this paper is to explore the mech-anisms for taking the raw data on which collaborative recommenda-tion is based and automatically eliciting the more semantically rich cases that can be used for content-based recommendation.
One problem with the collaborative approach is the bootstrap problem; there is no basis for making recommendations to new users who have not previously rated any assets (movies, songs, etc).
In this paper, we propose that the data that underpins the collab-orative recommendation process can be mined to discover appropri-ate representations to underpin content-based recommendation. We show how cluster analysis can be used to generate high-level repre-sentations that can produce good quality recommendations. We also suggest that these representations are useful in overcoming the boot-strap problem.
2 RECOMMENDER SYSTEMS
As stated in the introduction, there are two approaches to recom-mendation on the Web. The recomrecom-mendation process can be content
1Machine Learning Group, Department of Computer Science, University of
Dublin, Trinity College, Dublin, Ireland, email: [email protected]
[image:1.612.353.501.133.335.2]2ditto, email: [email protected] 3ditto, email: [email protected]
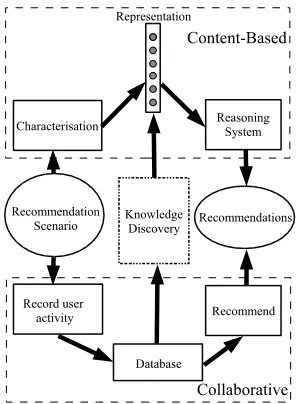
Figure 1. An overview of content-based and collaborative recommendation and the role for knowledge discovery in exploiting the
benefits of both approaches
based as represented by the upper path in Figure 1 where an appropri-ate representation of the assets and users requirements is determined at design time and recommendation is based on this representation. In the Case-Based Reasoning community this is referred to as case-based recommendation. The alternative lower path in the figure is automatic collaborative recommendation (ACF) which works with raw data on users ratings and behaviour and uses this data to produce recommendations. The focus of this paper is on how knowledge dis-covery techniques can be applied to this raw data to establish the ap-propriate representations for content-based recommendation. First, we will present brief descriptions of content-based and collaborative recommendation.
2.1 Content-based recommendation
Here we will describe a CBR-like content-based recommendation system that we can use for comparison purposes.
This process has advantages over ACF in working well for assets of minority interest or for new assets and users.
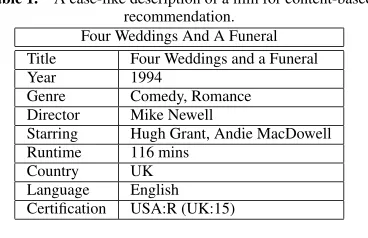
Table 1. A case-like description of a film for content-based recommendation.
Four Weddings And A Funeral Title Four Weddings and a Funeral Year 1994
Genre Comedy, Romance Director Mike Newell
Starring Hugh Grant, Andie MacDowell Runtime 116 mins
[image:2.612.53.277.220.323.2]Country UK Language English Certification USA:R (UK:15)
Table 2. A case-like description of user interests. JB-7
Name Joe Bloggs Preferred Era 1988
Genre Thriller, Comedy, War, Romance Director S. Spielburg, F. F. Coppola.
Actors S. Stone, S. Stallone, L. Neeson, A. MacDowell Runtime 150 mins
Country UK, US Language English Certification Any
2.2 Automated Collaborative Filtering
The basic idea of ACF can be shown using a simple example. If we have three users who have all shown an interest in assets as follows:
User 1: Asset 1, Asset 2, Asset 3
User 2: Asset 1, Asset 2, Asset 3, Asset 4, Asset 5, Asset 6 User 3: Asset 1, Asset 2, Asset 3, Asset 4, Asset 5
The high level of overlap indicates that these users have similar tastes. Further it seems a safe bet to recommend Asset 4 and As-set 5 to User 1 because they are endorsed by Users 2 and 3, who have similar interests to User 1.
[image:2.612.57.271.531.583.2]The type of data typically encountered in ACF is illustrated by Table 3. Asset 1...5 are assets in a recommender systems, while User 1...4 are users who have rated these assets on a scale of one to five.
Table 3. Data for use in ACF where users have explicitly rated assets. Asset 1 Asset 2 Asset 3 Asset 4 Asset 5
User 1 3 1 5
User 2 5
User 3 2 4
User 4 3 3
One of the great strengths of ACF is that, if enough data is avail-able, good quality recommendations can be produced without need-ing representations of the assets beneed-ing recommended.
The basic structure of the recommendation process has two dis-tinct phases. First the neighbourhood of users that will produce the recommendations must be determined. Then recommendations must be produced based on the behaviour or ratings of these users. See below (Section 4.1) for details on how this can be done.
In this paper we make reference to two recommender systems which employ ACF techniques.
MovieLens (http://www.movielens.umn.edu/) is an online film recommender system, which uses collaborative filter-ing to generate predictions. Users rate movies on a discrete scale and are recommended further movies on the basis of their ratings. The research team behind the system, GroupLens (http://www.cs.umn.edu/Research/GroupLens/), have made the data they have collected publicly available.
SmartRadio [4] is an experimental music recommender system de-ployed on the Intranet of the TCD Computer Science Department. The SmartRadio recommendation engine attempts to recommend playlists of songs to users based on their ratings of playlists to which they have listened in the past. Although the unit of recommendation is the playlist, users are asked to explicitly rate the individual tracks within the playlists on a scale of one to five.
3 CLUSTER ANALYSIS IN RECOMMENDER
SYSTEMS
From the machine learning point of view, a clustering task has as its goal the unsupervised classification of a set of objects. Clustering is unsupervised in the sense that there are noa prioritarget classes used during training. In this section we outline how cluster analysis can be applied to raw user ratings data to uncover interesting patterns, the descriptions of which will constitute appropriate representations for content-based recommendation. Previously puplished work on the application of cluster analysis to recommender systems has covered the clustering of users [1, 3] and assets [7]. Other researchers have ex-plored the benefits of clustering both users and assets simultaneously [6, 9, 10]. Our approach is to partition the assets in the database. In common with other researchers, we believe that the resulting par-titioning can be used to make recommendations. However, our ap-proach differs in the manner in which neighbourhoods of users are determined. Furthermore, we go on to use the clusters as the basis for concept formation in recommender systems.
3.1 Clustering assets
The first step is to partition the assets in the database. In the case of MovieLens the assets are the films, while in the case of SmartRadio they are the songs in the database. In both systems each asset will have been rated on a scale of one to five by a subset of the users. Thus, each asset can be represented as an object with as many attributes as there are users in the system. In recommender systems, the data sets are of very high dimension. Furthermore, the number of unknown attribute values for each asset is usually very high. This is because, in recommender systems, most users will have rated only a small fraction of the total number of assets available in the database. These problems need to be taken into account when applying clustering algorithms to recommender systems. Our implementation of thek -means clustering algorithm is discussed in Section 4.2.
3.2 Cluster-based recommendation
a, divided by the sum of the ratings for all assets in the partitioning Prated bya. The membership,M(a, Cm)of useraof a clusterCm is yielded by the following formula:
M(a, Cm) =
P
i∈Cm∩i∈Ara,i
P
j∈Ara,j
(1)
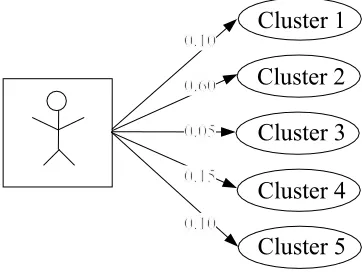
[image:3.612.64.245.183.319.2]whereiranges over all the assets in the clusterCm,jranges over all the assets in the partitionP, andAis the set of all assets rated by the usera. To generate each term of the series to construct the membership vector, we letmrange over the number of clusters in the partition. For example, consider a partitioningP consisting of five clusters and consider a userafor whom the membership of each partition has been computed. (See Figure 2).
Figure 2. Each users membership of each cluster in a given partitioning is computed. The sum of all memberships for each user is 1.0
The membership vector foramight be represented as follows:
M(a, P) =h0.1,0.6,0.05,0.15,0.1i
Intuitively, the membership vector for a user can be viewed as a compressed representation of that users ratings data. Thus, if we want to construct a neighbourhood of given size for a target user (the first step in the recommendation process), it is no longer neces-sary to compute correlations between users based on the raw ratings data; we need only compute correlations based on the (much lower-dimensional) membership vectors. Once neighbourhoods have been computed, recommendations can be made in the usual manner em-ployed in ACF. Details of the correlation and recommendation pro-cess can be found in Section 4.1. Evaluation of the cluster-based rec-ommendation technique is provided in the next section.
4 EVALUATION
In this section we describe our implementations of ACF and thek -means clustering algorithm. We then describe our experiments and provide results.
4.1 Our implementation of ACF
Our implementation of ACF is based on the published work of the GroupLens research group [5].
To form a neighbourhood of users for a target user the correlation between the target user and every other user in the system needs to be computed. In our ACF system, the Pearson correlation coefficient is used:
wa,u=
P
i(ra,i−ra)(ru,i−ru)
pP
i(ra,i−ra)
2(r
u,i−ru)2
(2)
where the summations overiare over the assets which both users aanduhave rated. This function yields values in the interval [-1, 1]. In forming a neighbourhood we can choose to consider only those users who are correlated above a certain threshold value. To predict a users rating for a given asset, his neighbours’ ratings for that asset are aggregated, each rating being weighted according to the Pearson coefficient for that neighbour. In our implementation the neighbours ratings are also normalized using their average rating.
ra,i=ra+
Pk
u=1(ru,i−ru)wa,u Pk
u=1wa,u
(3)
where the summations overuare over thekusers in the neigh-bourhood of usera. In practice, it is also necessary to weight the Pearson correlation coefficient with a value representing the signif-icance of the correlation. This is necessary because two users could be highly correlated on the basis of a very small number of co-rated assets. This can lead to poor predictions. We should put more con-fidence in less well-correlated users who have co-rated many assets. Thus, following Herlocker et al., for MovieLens, if two users have fewer than 50 assets in common, we multiply the correlation coef-ficient byn/50, wherenis the number of co-rated assets. If there are 50 or more assets in common, we apply a significance weighting of 1. Let us refer to 50 as the significance cut-off for MovieLens. For SmartRadio, whose database is of lower dimensionality, we de-termined through trial and error that 5 serves well as a significance cut-off.
4.2 Our implementation of
k
-means
Our implementation of k-means is based on the descrip-tions of the k-means-based products on the Clustan website (http://www.clustan.com). We also programmed our version of the algorithm to accommodate unknown values in the absence of the pos-sibility of pre-processing.
TheEuclidean Sum of Squares(ESS)Epfor a clusterpis given by:
Ep= Σxi²pΣj(xij−µpj)2 (4)
wherexijis the value of variablejin objectiin clusterpandµpj is the mean of variablejfor clusterp.
The total ESS for all clusterspis thusE= ΣpEpand the increase in the Euclidean Sum of SquaresIp∪qat the union of two clustersp andqis:
Ip∪q=Ep∪q−Ep−Eq (5)
While standardk-means programs relocate any object to the clus-ter with the nearest mean, we have implementedk-means to min-imize the total Euclidean Sum of SquaresE. This is preferable be-cause while the standard approach may appear to minimizeE, it does not necessarily converge quickly, or at all, because such relocations may not actually reduceE.
To minimizeEwe must only relocate an objectifrom clusterpto clusterqwhenEp+Eq> Ep−i+Eq+i.
to the means ofpandq; and, in certain circumstances, these changes may actually increaseE. Relocating an objectifrom clusterpto clusterqpulls the mean ofqtowards it and pushes the mean ofp away from it. This can cause the distances from the mean of other cases in clusterspandqto increase, such thatEis increased. With large data sets, an oscillation of boundary objects between two or more clusters can result in successive iterations. Indeed, this oscilla-tory behaviour was observed when the standardk-means algorithm was applied to SmartRadio.
SinceEis a sum of squares, the relocation of only those objects which yield a reduction inEmust result in convergence, becauseE cannot be indefinitely reduced. This guarantees thatk-means anal-ysis will converge if allowed enough iterations, since each iteration reduces the ESS. It also means that a relatively small number of iter-ations are required to reach a stable minimum ESS. This is important in the case of Smart Radio, since we need to runk-means numerous times for each value ofkin order to determine the best clustering solution.
4.3 Experimental Methodology
We ran experiments on both the MovieLens and SmartRadio data sets. For every experiment we used five-fold cross-validation, using 80% of the data as a training set and reserving 20% as a test set on which predictions were made.
The first experiment was to use our implementation of ACF to generate predictions for each user-asset rating in the test sets. We calculated the absolute error of each prediction, defined as the abso-lute difference between the actual and predicted ratings. For each set of predictions on a test set, themean absolute error(MAE) was then calculated as the sum of the absolute errors divided by the number of predictions made.
In the second experiment, we clustered each of the training sets, computed the membership vector for each user, and made predictions on the test set, as described above. We also randomly partitioned the data in each case, so as to be able to compare results generated using k-means against a random partitioning. For each fold, we generated five random partitionings and aggregated the MAE of the predictions made for that fold. In contrast, when usingk-means we used a one-shot approach; that is to say, we rank-means once for each training set for a given value ofk.4
Note that in each experiment, we made predictions for several neighbourhood sizes. The neighbourhood sizes for SmartRadio are smaller than those for MovieLens, reflecting the relative sizes of the two data sets.
4.4 Results and conclusions
Fig. 3 is a plot of the MAE of predictions for MovieLens against neighbourhood size.
ACF performs as expected. Note, in particular, how the MAE be-gins relatively high, falls rapidly to a minimum, and then bebe-gins to increase again as the neighbourhood size is increased. This is char-acteristic beahaviour for ACF algorithms. When the neighbourhoods are too small, there is not enough information to make good predic-tions; when they are excessively large, there is too much irrelevant and misleading information; but when there is just the right number, the predictive capabilities of the ACF algorithm reach an optimum. The MAE for the cluster-based prediction method is not as low as for
4 We were guided in our selection of a value for k by the silhouette
[image:4.612.344.511.28.158.2]technique[8]
Figure 3. Plot of Mean Absolute Error against neighbourhood size for MovieLens data
[image:4.612.346.510.292.420.2]’traditional’ collaborative filtering methods. However, we can con-clude that thek-means clustering algorithm has successfully iden-tified interesting clusters, since a merely random partitioning yields inferior results.
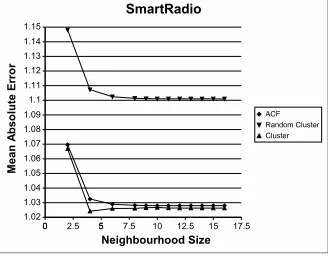
Fig. 4 is a plot of the MAE of predictions for SmartRadio against neighbourhood size.
Figure 4. Plot of Mean Absolute Error against neighbourhood size for SmartRadio data
conventional ACF in the bootstrap phase of recommender systems. At some time in the future we expect conventional ACF techniques to outperform cluster-based prediction in SmartRadio. This will be when SmartRadio acquires a critical mass of users and ratings and the MAE plots for SmartRadio start behaving similarly to those for MovieLens. Our work suggests that the cluster-based method could be used when such recommender systems are initially deployed and then, after bootstrapping is complete, conventional ACF could be in-troduced.
5 CONCEPT FORMATION
The experiments presented above indicate that the clusters discov-ered for SmartRadio are good for predictive purposes. In keeping with our objective of developing a high-level representation of raw user ratings data, the next phase is to generate descriptions of the clusters. To do this, we leverage existing knowledge.
[image:5.612.52.279.307.373.2]5.1 Concept formation: describing the clusters
The main idea is to describe each cluster probabilistically accord-ing to the types of songs contained in each cluster. As a simplified example, imagine that we have a database that associates a list of descriptors with each artist in SmartRadio (Table 4).Table 4. Artist Descriptors. Artist Descriptors
Bob Dylan Rock ’n’ Roll, Folk Rock, Singer/Songwriter The Beatles Rock ’n’ Roll, Pop/Rock, Psychedelic Bruce Springsteen Rock ’n’ Roll, Pop/Rock, Singer/Songwriter The Prodigy Electronica, Techno, Rave
Orbital Electronica, Techno, Ambient Techno
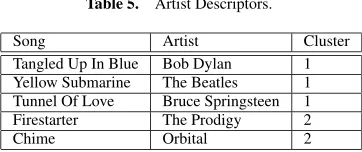
[image:5.612.74.255.432.508.2]Now suppose that we have just two clusters, the first with three songs, and the second with two, as in Table 5.
Table 5. Artist Descriptors.
Song Artist Cluster Tangled Up In Blue Bob Dylan 1 Yellow Submarine The Beatles 1 Tunnel Of Love Bruce Springsteen 1 Firestarter The Prodigy 2 Chime Orbital 2
In building a description of a cluster, we describe that cluster in terms of the descriptors associated with each of the songs in the clus-ter, maintaining a count of the number of songs in the cluster that fall under each of the decriptors. Thus, in our example, the first cluster could be described by:
Rock ’n’ Roll = 3/3 (since three of the three songs in the first cluster are Rock ’n’ Roll)
Folk Rock = 1/3 Singer/Songwriter = 2/3 Pop/Rock = 2/3 Psychedelic = 1/3
The description of the second cluster is as follows: Electronica = 2/2
Techno = 2/2 Rave = 1/2
Ambient Techno = 1/2
We can interpret these descriptions probabilistically. Thus our de-scriptions of each cluster can be viewed as logical conjunctions of statements of the formp = P(Dx|X ∈ C), wherepis the prob-ability that a songxis described by descriptorD, given thatxis a member of clusterC.
Using the above strategy, we generated descriptions of the Smar-tRadio clusters. The clusters of music tracks were generated byk -means, withk= 7, on the same ratings data used in the collaborative filtering experiments. However, this time, instead of generating five sets of clusters in order to preform cross-validation, we ran the pro-gram only once on the whole dataset.
Once the clustering was performed and descriptors had been auto-matically compiled for each song, we calculated how many assets in each cluster fell under each descriptor. Because of the nature of these descriptors, many tracks shared descriptors, but, in some cases, only a small number of tracks fell under certain descriptors. For example, part of the output for the first cluster is as follows:
{’Adult Alternative’: 12, ’Adult Alternative Pop/Rock’: 30, ’Adult Contemporary’: 8, ’Album Rock’: 13, ’Alternative Dance’: 7, ’Alter-native Metal’: 1, ’Alter’Alter-native Pop/Rock’: 31, ’Ambient’: 2, ’Ambient Pop’: 1, ’Ambient Techno’: 3, ’American Underground’: 1, ...}
You will notice that, in this example, there are indeed some de-scriptors which are counted as occurring only once or twice; these descriptors are surely relatively unimportant for describing the clus-ter, while those that have much higher counts are likely to be most important.
5.2 Experimental set-up
Since our objective was to have users of SmartRadio evaluate the concepts, it was essential to eliminate some descriptors in the final description of the clusters, as there were simply too many to expect users to examine them all. We used the following heuristic:
1. within each cluster, eliminate all descriptors which are counted less than ten times
2. across all clusters, eliminate all descriptors which occur in three or more clusters
The second step is to ensure that the descriptions of clusters do not contain descriptors which are incapable of discriminating the clusters for users. For example, an extreme case would be if a descriptor, say, Rockwas present in the description of every cluster; in such a case, Rockwill not help a user to differentiate between the clusters.
When this process was completed, one cluster was completely de-nuded of descriptors, so we did not include it in our online exper-iment. This left six clusters with descriptors which are recorded in Table 6.
Users were asked to examine and rate each of the six playlist de-scriptions in Table 8.1. They were instructed as follows: ’Imagine that you are listening to SmartRadio and are presented with playlists composed of songs falling under the genre descriptions presented here. On the basis of these descriptions, how do you think you would rate each playlist?’ The experiment was conducted online and the rat-ings each user provided were recorded in a database for later, offline analysis.
5.3 Results and conclusions
Table 6. Descriptions of six clusters presented to users in the SmartRadio experiment.
Cluster Descriptors
1 World, Celtic, Adult Alternative, Ethnic Fusions, Con-temporary Instrumental, Contemporary Celtic, Celtic New Age
2 House
3 Folk-Rock Britpop, Rock ’n’ Roll 4 Britpop, Experimental Rock, House
5 Intelligent Dance Music, Ambient Techno, ExperimentalTechno, Electro-Techno, Techno, Trance, Experimental Jungle, Drill ’n’ Bass, Experimental Rock, Acid Techno 6 Rock ’n Roll, Folk-Rock
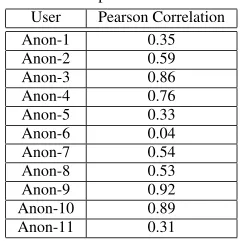
user, we were able to calculate on the basis of their ratings of the six clusters in the experiment, their membership of each of those clus-ters. This yielded what we call aperceivedmembership vector, a term which captures the fact that, on the basis of high-level style descrip-tors, users perceive themselves to be aligned in a particular manner with the clusters. Now, we already had at our disposal the means to compute a user’s membership of a cluster based on their ratings data. Let us call the result generated by these computations areal member-ship vector. Our question was: Do the perceived and real membermember-ship vectors match up? In other words: Are they highly correlated? If the answer to this question were affirmative, then we could conclude that the descriptions of the clusters are useful for quickly determing the preferences of users. The Pearson correlation coefficient computed between real and perceived membership vectors for the eleven users are presented in Table 8.2.
Table 7. The Pearson correlation coefficient between real and perceived membership vectors for SmartRadio users who participated in the
experiment. User Pearson Correlation Anon-1 0.35 Anon-2 0.59 Anon-3 0.86 Anon-4 0.76 Anon-5 0.33 Anon-6 0.04 Anon-7 0.54 Anon-8 0.53 Anon-9 0.92 Anon-10 0.89 Anon-11 0.31
The mean Pearson coefficient is calculated to be 0.56, and the standard deviation is 0.27. This indicates that the real and perceived membership vectors are highly correlated. Therefore, the descrip-tions used in the experiment are useful for determing the preferences of users. In particular, such cluster descriptions could be applied to the problem of making good quality recommendations to new users in the absence of any previous ratings. In SmartRadio, a new user might be asked to rate styles of music in order to determine their perceived membership of clusters, and then be recommended assets favoured by those other users whose real membership vectors closely correlate with the new user’s perceived membership vector.
6 SUMMARY
We described a novel cluster-based strategy for predicting user pref-erences in recommender system. Empirical evaluation of our method
suggested that it may work best in the context of bootstrapping a recommender system in its early stages, when there is insufficient data available for the optimal performance of conventional ACF tech-niques. We went on to show how a partitioning of system assets can be used as the basis for a system of concepts. Furthermore, we il-lustrated how the concept formation process can be automated in the case of SmartRadio by making use of pre-existing knowledge. Our experiments reveal that the resulting concepts capture users’ under-standing of the SmartRadio domain. This suggests that the concepts might be useful for bootstrapping new users of the SmartRadio sys-tem.
ACKNOWLEDGEMENTS
We would like to thank the GroupLens Research Group for making their MovieLens data publically available at http://www.cs.umn.edu/Research/GroupLens/data/
We would also like to thank the referees for their comments which helped improve this paper.
REFERENCES
[1] S.H.S. Chee, J. Han and K. Wang, ‘RecTree: An Efficient Collaborative Filtering Method’,Lecture Notes in Computer Science,2114, 141-151, (2001).
[2] P. Cunningham, R. Bergmann, S. Schmitt, R. Traphoner, S. Breen and B. Smyth, ’Websell: Intelligent Sales Assistants for the World Wide Web’,e-Business and e-Work 2001.
[3] D. Fisher, K. Hildrum, J. Hong, M. Newman, M. Thomas, and R. Vuduc, ’Swami: A Framework for Collaborative Filtering Algorithm Development and Evaluation’,Research and Development in Informa-tion Retrieval, (2000).
[4] C. Hayes, P. Cunningham, ’Smart Radio: Building Music Radio on the Fly’,Expert Systems, Cambridge, UK, (2000).
[5] J. Herlocker, J. Konstan, A. Borchers, and J. Riedl, ’An Algorithmic Framework for Performing Collaborative Filtering’,Proceedings of the 1999 Conference on Research and Development in Information Re-trieval.
[6] A. Kohrs and B. Merialdo, ’Clustering for Collaborative Filtering Ap-plications,Computational Intelligence for Modelling, Control and Au-tomation (CIMCA’99).
[7] M. O’Connor and J. Herlocker, ’Clustering Items for Collaborative Fil-tering’,ACM SIGIR ’99 Workshop on Recommender Systems: Algo-rithms and Evaluation, University of California, Berkeley, USA. [8] P. J. Rousseeuw, ’Silhouettes: A Graphical Aid to the Interpretation and
Validation of Cluster Analysis’,Journal of Computational and Applied Mathematics,20, 53–56, North-Holland, (1987).
[9] L. H. Ungar and D. P. Foster, ’A Formal Statistical Approach to Col-laborative Filtering’,Proc. CONALD’98.
[image:6.612.104.226.371.494.2]