Preprint
UCRL-JC-145031
A Statistical Hot Spot
Reactive Flow Model for
Shock Initiation and
Detonation of Solid High
Explosives
A.L.
Nichols, C.M.
Tarver
This
article w a s submitted to
1
2'h
International Detonation Symposium, S a n Diego, California,
August
1
1-1
6,2002
US. Department of Energy
&:;
Laboratory
July
1,2002
DISCLAIMER
This document was prepared as an account of work sponsored by an agency of the United States Government. Neither the United States Government nor the University of California nor
any
of their employees, makesany
warranty, express or implied, or assumesany
legal liability or responsibility for the accuracy, completeness, or usefulness ofany
information, apparatus, product, or process disclosed, or represents that its use would not infringe privately owned rights. Reference herein to any specific commercial product, process, or service by trade name, trademark, manufacturer, or otherwise, does not necessarily constitute or imply its endorsement, recommendation, or favoring by the United States Government or the University of California. The views and opinions of authors expressed herein do not necessarily state or reflect those of the United States Government or the University of California, and shall not be used for advertising or product endorsement purposes.This is a preprint of a paper intended for publication in a journal or proceedings. Since changes may be made before publication,
this
preprint is made available with the understanding that it will not be cited or reproduced without the permission of the author.This report has been reproduced directly from the best available copy.
Available electronically at hm:/ /www.doe.gov/bridge
Available for a processing fee to U.S. Department of Energy and its contractors
in
paper fromU.S. Department of Energy
Office of Scientific and Technical Information P.O. Box 62
Oak Ridge, TN 37831-0062 Telephone: (865) 576-8401 Facsimile: (865) 576-5728 E-mail: reDorts8ado nis.osti.l.0v
Available for the sale to the public from U.S. Department of Commerce National Technical Information Service
5285 Port Royal Road Springfield, VA 22161 Telephone: (800) 553-6847 Facsimile: (703) 605-6900 E-mail:
[email protected]
Online ordering:
he:/
/www.ntis.pov/ade rin _e.htm
OR
Lawrence Livermore National Laboratory Technical Information Department’s Digital Library
A STATISTICAL HOT SPOT REACTIVE FLOW MODEL FOR SHOCK INITIATION
AND
DETONATION
OF
SOLID HTGH EXPLOSIVES*
Albert L. Nichols I11 and Craig M. Tarver Lawrence Livermore National Laboratory
Livermore, CA 9455 1
A statistical hot spot reactive flow model for shock initiation and detonation of solid high explosives developed in the ALE3D hydrodynamic computer code is presented. This model is intended to evolve into a physically correct description of the physical and chemical mechanisms that control the onset of shock initiation via hotspot formation, the growth (01
failure to grow) of these hotspots into the surrounding explosive particles, the rapid transition to detonation, and self-sustaining detonation. Mesoscale modeling of the shock compression and temperature dependent chemical decomposition of individual explosive particles are currently yielding accurate predictions of hot spot formation and the subsequent growth (or failure) of these hotspot reactions in the surrounding grains. For two- and three-dimensional simulations of larger scale explosive charges, a statistical hotspot model that averages over thousands of individual hotspot dimensions and temperatures and then allows exothermic chemical reactions to grow (or fail to grow) due to thermal conduction is required. This paper outlines a first approach to constructing a probabilistic hot spot formulation based on the number density of potential ho'tspot sites. These hotspots can then either ignite or die out if they do not exceed certain ignition criteria, which are based on physical properties of the explosive particles. The growing hot spots spread at burn velocities given by experimentally determined deflagration velocity versus pressure relationships. The mathematics and assumptions involved in formulating the model and practical examples of its usefulness are given.
INTRODUCTION
Phenomenological reactive flow models for the shock initiation and detonation of solid high explosives, such as the Ignition and Growth model'.* and the Johnson-Tang-Forest (JTF) model3 have been very successful in reproducing most of the main features of these reactive flows. The reaction rate expressions in these models depend upon the average compressions and pressures attained in the reacting explosive mixture rather than the local hot spot temperatures, which are known to control the reaction rates in the preferentially heated regions of the explosive charge. Thus there are some situations, such as shock desensitization4, that are not easily treated by these phenomenological models. Mesoscale modeling of the shock compression5 and temperature dependent chemical decomposition6 of individual explosive particles are currently yielding accurate predictions of hot spot formation mechanisms and the subsequent growth (or failure) of these hot spot reactions in the surrounding grains. For two- and three-dimensional simulations of realistic size explosive charges, a statistical hot spot model that averages over thousands of individual hot spot dimensions and
temperatures and then allows the chemical reactions to grow (or fail to grow) due to thermal conduction is required. Some simple statistical hot spot models were developed several years ago in one- dimensional hydrodynamic codes738, but practical hot spot models in multidimensional codes are just beginning to appear.
HMX
and TATB used in this statistical model have been previously used to determine the critical hot spot temperatures and dimensions that will react and begin to growg. The growth rates of these hot spots due only to thermal conduction were also determined", and were shown to be too slow to account for measured shock initiation times and run distances to detonation. Therefore physical mechanisms, such as crack nucleation and growth, must be causing greatly increased reactive surface area as the pressure and temperature increase during shock initiation and the transition to detonation.In this paper, the formulation of a statistical hot spot creation model in the ALE3D hydrodynamic code is presented. During shock compression, a distribution of hotspot sizes and temperatures based on the initial pore size distribution, explosive
particle size distribution, and the density of the explosive charge is created. These hot spots then grow to consume neighboring explosive particles or fail to grow as thermal conduction lowers their temperature before exothermic chemical reaction can be completed. The growth rate of the surviving hot spots is then modeled by a statistical hotspot growth model normalized to experimental high- pressure deflagration rate data. The coalescence of these expanding hot spots as the temperature and pressure rapidly rise everywhere in the decomposing explosive charge is also discussed. The extremely rapid transition to detonation observed experimentally is shown to be similar to a constant volume explosion from a critical compression state of the unreacted explosive to a state on the reaction product Hugoniot close to the Chapman-Jouguet (C-
J)
state. Examples of calculated shock initiation and detonation wave propagation for an HMX-based explosive are presented. Examples of shock initiation effects, such as desensitization and changes in sensitivity due to initial temperature and particle size distribution variations, that are difficult or impossible to compute with pressure and compression dependent reactive flow models are also presented.STATISTICAL HOTSPOT MODEL
PROBABILISTIC HOTSPOT FORMULATION The first phase in constructing the statistical hot spot model is the consideration of the distribution of those hot spots. First, consider the probability P, that single hotspot of radius R will have reacted at a given location in a volume V in the explosive. This probability is given by:
4ZR3
P,
=-3v
If there are
NR
of these hotspots randomly distributed in space, then the probability that a given location has not reacted P, is simply the product of the independent probabilities. Assuming that the hot spots are independently located, P, is defined as:Taking the limit where the volume becomes large but the hotspot density remains fixed, Eq. (2) becomes:
(3)
Finally, the combined probability of a region not having been reacted P,&) is simply the product of the probabilities associated with each hotspot radius. Therefore the final expression for P, is:
(4)
The probability of not yet reacting is simply the mass fraction of the reactant in a reactive flow formulation. The probabilistic formulation makes it easier to consider a variety of different possibilities. For example, a similar line of reasoning can be used for two-dimensional hotspots (hotlines) and one- dimensional hotspots (hotplanes). The latter would be useful for the modeling of shear banding as an ignition source, for example. If all of such ignition mechanisms could be defined, all that would be required for a complete hot spot model is to multiply their probability functions together.
HOTSPOT DENSITY MODEL
t
-I d a l d w
p ,
--
twhere ps(a,a) is the number density of hotspots that ignited at time
a,
and died at timea.
The dirac-delta functions are used to define the size of the hotspot with the assumption that the initial hotspot size is E,and that it then burns at a burn rate v out from that initial spot. The first term pA(R,t) represents the population of hotspots of size R that are still growing (active) at time t. The second term pD(R,t) represents the population of hotspots of size R that have stopped growing (died) by time t. It is important to remember that even though a hotspot may stop burning, the material that has burned within that hotspot must still be counted as reacted.
Let us now define the following projections of the density function:
4 n
-
he)= - I d R R 3 p ( R y t )
3 0
00
0
t
---
tca
The h term is just the negative of the log of the probability defined in Eq. (4). The g and f terms are the two- and one-dimensional active projections of
the density function, respectively. The number of
hotspots that are active at time t is A
( t ) ,
and pB(t) is the number of hotspots created at time t. In the current model, it is assumed that all hotspots active at time t have the same rate of death p(t), that is:-
With these projections, it is possible to construct a set of differential equations to couple the high order unreacted mass fraction with the much simpler active hotspot density.
dh
-
=
4v(tE(t)+ 4 m 3 p , ($3
at
IGNITION MODEL
potential hotspots. If they are compressed to a sufficiently high temperature, they will start to react (a hotspot). If the process is too weak, then the potential hotspot will be destroyed without creating a hotspot. Without such a process, any sufficient compression of the explosive would lead to reaction, even that from an isostatic press. However, since explosives do have strength, there must be sufficient force to overcome that internal void strength before any changes to the potential hotspot density can occur. The following phenomenological ignition model captures these features.
@-e>
AP*(P-P,)
Here K is the rate of potential hotspot transformation, and
D
is the constant death rate for potential hotspots.PO
is the ignition rate threshold pressure that represents the internal resistance to void collapse. To prevent unrealistically large collapse rates during numerical pressure spikes, P* is defined as the saturation pressure. H is the heavy side step function, which is zero for all arguments less than zero and one for everything else. We originally envisioned a compression rate dependent ignition rate, but such a rate can be extremely mesh- size dependent. More complex ignition models can be formulated as this model evolves.PHYSICAL, INTERPRETATION HOTSPOT MODEL PARAMETERS
We have defined a total of 8 parameters, not counting those associated with the equation of state, for this model. They are: PO, P*, A, p, v, D, ppo, and
E. PO is clearly related to the yield strength of the explosive, and so we will use the yield strength in
our model. The burn velocity
v
can be experimentally determined by any of the standard burn rate measurement techniques, such as strand- burner and diamond anvil experiments. The value of D should be chosen to match explosive shock recovery experiments, so that the value of D is setequal to the value of R for the shock pressure that just begins to ignite the explosive.
A heuristic argument can be used to determine
ppo, and E. If one assumes that the initial hotspot volume will equal the initial void volume and that enough hotspots need to be created so that when they burn they will consume the entire explosive in the reaction zone time T and initial void density py:
Another heuristic argument can be applied to the ignition pre-factor A and P*. It is reasonable to assume that the rate of collapse of the void regions is proportional to the product of the void radius and the particle velocity u in the shock wave. For relatively low pressures, we can Taylor expand the volume change using the adiabatic compressibility, and get:
where
PO
is the initial density, and c is the reference sound speed Comparing to the ignition definition in the limit of small @-PO), we find1
EXAMPLE PROBLEMS
SHOCK INITIATION
The phenomenological reactive flow model Ignition and Growth' has been normalized to a great deal of shock initiation data. However, for different initial temperatures and particle size distributions, it has to be reparameterized. The Statistical Hot Spot model has the necessary features to calculate such initial condition differences. The first example problem is to drive a 2 cm wide by 3 cm long by 0.1 cm deep block of explosive into a stone wall to check the two-dimensional shock initiation characteristics of the Statistical Hot Spot model. As previously mentioned, an unreacted equation of state is needed to describe the states attained during shock compression. The Jones-Wilkins-Lee (JWL) equation of state is used
with
typical parameters for an HMX-based plastic bonded explosive.P = A(l-dRIV)e-R1v- B ( l f ~ / R 2 V ) e - ~ ~ + o E N (16) where P is pressure, V is relative volume, E is the internal energy,
o
is the Gruneisen coefficient, and A, B,R1,
and R2 are constants. For a typicalHMX-
based plastic bonded explosive, the initial density is 1.85 g/cm3, R1 = 14.1, R2 = 1.41,
o
= 0.8938, A =9522 Mbar, and B
= 0.05944 Mbar. This JWL
equation fits the measured unreacted Hugoniot data at low shock pressures and the von Neumann spike data at high pressures12. The reaction products are described by LEOS tables fit to product Hugoniot and isentrope states calculated by the CHEETAH chemical equilibrium code13. Mixtures of unreacted explosive and reaction products are assumed to be in pressure equilibrium.As discussed in the previous section, the ignition and growth of reaction model has eight parameters:
PO,
P*, A,p,
v, D, pp', and E. PO is theignition rate threshold pressure, which is related to the effective yield strength at high strain rates and is set equal to 0.1 GPa for these calculations. P* is the saturation pressure below which all hot spots are formed and is set equal to 10 GPa. The ignition prefactor A is defined by Eq. (15) and, for
HMX,
is approximately 2000 cm-pslg. The hot spot death rate p is initially set equal to 5 ps-'. The constant death rate parameter for potential hot spot D is set equal to 11.3. The initial number of potential hot spot sites ppis assumed to be 1.4 x lolo ~ m - ~ . Theinitial hot spot diameter E is assumed to be 1.5 x 1 O4
cm or 1.5 microns. Finally the reaction growth rate v is assumed to be a function or pressure as measured experimentally in strand
burner^'^.
This pressure versus burn rate function is shown in Table 1.TABLE 1. PRESSURE VERSUS BURN RATE PRESSURE (GPa) BURN RATE (cm/us)
1.0
x
10" 1.016 x 1.151 x 9.068 3.842 x 1.763 x 5.957 x8.077 x 6.988 x lo4 1.164 x 10" 1.016 x
3.599 x 1
o-6
1
.o
4.441 10-~Using these input values, the explosive was driven into the stonewall at various velocities to study the buildup of the shock wave produced in the explosive to a detonation. In agreement with numerous experiments and previous models, the buildup toward detonation occurred well behind the shock front, the transition to detonation was rapid, and the resulting detonation wave traveled at the correct velocity, 8.8
d p s .
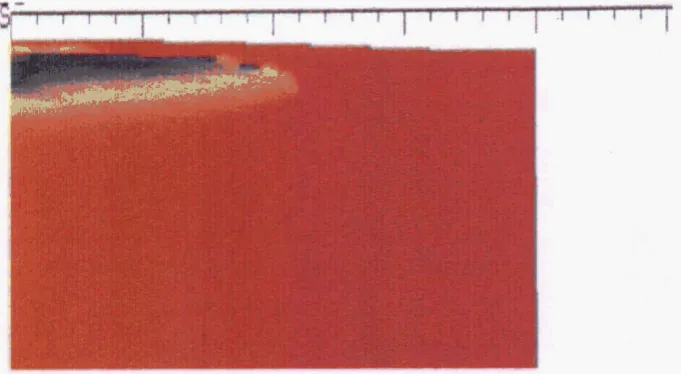
Table 2 lists the initial velocities and the calculated times to complete reaction. These reaction times are reasonable for HMX-based plastic bonded explosives. Figure 1 shows the fraction reacted contours for HMX decomposition at 2.33 ps for the 0.3d p s
initial velocity case.TABLE 2. INITIAL CONDITIONS AND TIMES TO COMPLETE REACTION
VELOCITY budus) REACTION TIMES (us)
0.18 2.51
0.30 2.27
0.60 1.70
1.2 1.51
FIGURE
1,
Froctlo.
Reacted
Contours for
H M X
(Rad
-
DO
reaetb;
BIme
-
Cempkte
remctiom)
at
233
ps
hr
88
i.itlal
velocity
of 0 3
d p 8
The
effects
of changing various hot spot
pragqntcrs
were
investigated
using
an
initial particle
velocity
of 0.18
&pa
or
an
initial
shock pressure
of approximbtely 1 GPa.
Reducing
the hot spot
dtathratepammcterphm
5
to
1 reducedthetime
to
conpletq
d o n
from 2.51
cup
to
1.76
ps,
and
iDcrcaeiag
p
to
10
mused
the
fraction reaction
to
rsm.dn
below
0.45.
Lowering the constant death
rate
parameter
D
to
1.13 from 11.3 led
to
complete
d o n
in
2 3
cup
h s t d
of 2.51
ps,
and raising D
to
22.6
forccd~~rtacciOn
to
occurin9.3
ps.
One
of the most important e&cts
on
shock
initiation
is
the
initial particle
size effect,
which
oantcols
both
the
initial
n u m b
of
potential
hot spot
sites
and
the
average
size
of these
sites.
Each solid
mplosive
exhibits a maximum shock
sensitivity
at
cartain
particle
size. If
the particles
are
too
large,
tbwe
we
fewm
sites
and thew sites
arg
easily
comp~&ssed
mwltilrg
in
relatively low hot spot
tempmatumsP
If
the
particles
are
small,
there are
mom
dtes
compressed
to
high temperatures, but
many
of
thesp
hot spots lose their heat by
sxmdW$m
bfim
thy
cfpl
mwt
and
~FOWP
T*le
3
shopvs
the
of changing the
initial
number
of
potential hot
pp
by
an
order
of magnitude in
w h
direction.
Large
particle size formulations
%wain
fGWW
si-
ail4
tb!#l
dfe
Im
elrock
enSitiY6,
TABLE
3.
E m C T
OF
BOT
SPOT
DENSITY
8!i&dm&
--
1.4
x
1$
0.0523
4.09
1.4 ~10''
0.954
1.92
1.4
x
10"
0.976
0.114
Table
4
shows the effbcts of i n i M hot
spot
dkumter
e
011the
restion
times. Figure
2
sbowa
the
firaction
ream4
for
the
0.6-micron
dimem
oaet
at
8
time
of 10.52
)IS
when the shock
wave
has
traveled
through
the
3
cm
long charge.
The
0.6
and 0.9
micron results ignite approximately the correct
amount of fiaction reacted for shock initiation
studies,
and
are
reasonable hot spot sizes for
mal
solid explosive formulations.
Since
the
d o n
rate
falls rapidly with decreasing hot spot size
and
number of hot spot aites, the Statistical Hot Spot
model is predicting the well-known particle
size
effects
on shock
initiation of solid explosiveS.
TABLE
4.
EFFECT
OF HOT SPOT
SIZE
onRe=tall2DdJt@
3.0
x
lo4
0.979
0.29
1.5
x
lo4
0.954
1
.!a
9.0
x
lo-'
0.1792
5.86
6.0
x
lo-'
0.0322
10.52
The prcgsurc
versus
reaction
rate frmction
for hot
spot growth shown in Table 1 is similar
to
deflagration rates observed
in
strand
burnt=
at
prtssums below 1 GPa. For
the
higher pressums
reached during shook initiation
and
detonation,
the
growth
rate
fuaction
was
fit
to
recent
dim&
anvil
cell
(DAC)
burn rate
data on
pure
HMXu
by
Rcaugh.6
These rates
are
shown
in
Table
5
a
d
are
[image:8.957.495.836.792.979.2]much
ktcr
than
those
in
Table 1.
FIGURE
2.
HMX Fraction
Reacted
Contours
at
l(M2
p
for
0.6
pm
M a m w
Hog
Spots
impacted
T A B U
5.
PPEssuRpr
VERSUS
DAC BURN
RATES
1.OxlQ'
3
.O
so
5.0
x
lo-s
7.0
x
lo4
9.0
x
loa
c o w I D I N c ~ D E T o " w A v E s
The other
main
area
where phenomenological
reactive flow models sometimes have problems
is
when multiple shock or
detonation
waves
collide,
yielding
regions
of very
high
pressure and
reaction
rates.
To
test
the ability of
the
Stathtiical
Hot Spot
model
to
handle such problems,
the
explosive block.
described
above was
initiated
on
the
top
and
bottom
by imparting
initial
prcssum
to
start
the
d o n
se<lucmx.
Figure
4
shows
the
collision
of
the
curved
very
high
lnesmes
(essentially
twice
the
detonatiorr
pressure in this example)
can
be limited in
the
Statistical
Hot Spot model,
the
calculation
times
do
with
pressure
dependent
d o n
rates.
The
ALBD
code
can
overanne
the
defonncd
problans
that
conditions.
This
capability
will
be extremely
important when the complex three-dimensional
Mach
stem
structure of
real
detonation waves
i s
simulated
in
3D.
dctpDation
WaYe8
with
U m e a e a d m
atthe
c d p s
s t i l l ~ c o n s l l m e d .
S i n c e t h e d o n r a t e e a t
not
increase
dramatically
as
they
can
using
models
purely
Lagrange
codes
often
calmot
under
these
FIGURE
3.
HMX
-#OB
Rerrcded
Comtomrs
at
297
pa
tor
W
pan
ahnrdcr
botapetsimp.cbed
at
8.1%
mwpu
One of the most important
and
complex
modeling problems in solid explosives is the
phenomena
of
shock desensitization
or
dead
pressing. The
most
famous
e m e n t a l example
is
that
of Campbell and Travis', in which a
PBX
9404
is
debmted
at
one
end
and awcdt
shock
wave
frotn
an
mcalerwm
detonation impacts the
s a w
PBX
9404
charges
at
the other end. If
this
shock
wave
is
too
weak
to
collapse
all
the potential
hot
spot
sites,
then
the
detonation
propagates
tbrough
the precompreastd
mataid.
If the
shock
wave is
strong
enough
to
s t a t
hot spot ignition
and
growth,
then
the detonation wave continues
through
the
partly
reacting
explosive. However, if the shock
wave
pressun
is
within
a
certain
raage
(0.7
to
2.4
GPa
&r
PBX
9404)
which collapses
all
the
potential
hot
spots
without
causing
too
much
&on
p w t h ,
then
detmation wave
will hi1
to
propagate when
it reacha
a
dtpul
at
there
are
only
dead
or
burned
out
hot
spots
and
\IllltBctfd
particles. Composition
B:
the
TATB-based explosive LX-17I6, and other
explosives
have
also
been
shown
to exhibit this
phmomena.
Phenomenological reactive flow
modtlsoglbe
'd
to
not allow
d o n
in
otrtain
can
- Z 1 6or
to
use
reaction
rate
l i m h t h s ' ,
but
they
can
not predict the times
taquitcd for the death
of
a detonation wave.
Figwe
5
shows
the
collision
of a
detaWon
wave
with
8
regia
of explosive
compactad
by
a
shwk
pres;waeofl
GPaaudthemsdtingfailureofthe
datanation
wave
to
cause
further
reaction
in
the
pre-
compressed
explosive whose hot spot
sites
have
already
died
or
d
Therefore
the
Statistical
Hot
Spot
model
is
definitely capable of
sp
quantitatively modeling shock benSitiZation
and
other pre-conditioniug
effects on
shock
initiation
and detonation wave propagation in three
dimensions.
CONCLUSIONS
In
this
paper,
a
statistical
hot spot
model
was
derived
that
can
be applied
to
a
number
of
situations
that arc
nonnally not possible
to
model with a more
standard reactive flow treatment. Examples
were
shown for
shock initiation and colliding waves
that
demonstrated the versatility of
the
model.
A
$tmt
deal
more
research is nwxssary
to
study
the
combined effects of
the
various pamnWrs and
to
make each
sf
tbe model
as
physically
realistic
as
possible.
ACKNOWLEDGMENTS
The
authors
would like
to
thank
Estella
M.
McGuire
h r
doing most of the ALE3D
calculatim
*This
worL
performed
Mder
the auspices of the
US,
Department of
Energy
by
the
University of
California, Lawrence Livermore National
pl?xenkdinthispaper.
Laboratory
mder Contract W-74(McEag..48.
REFERENCES
1.
Tarver,
C.
M., Hallquist, J.
O.,
and
Ericksm,
L.
M.,
Eighth
Symposium
(Intematioorl)
on
IIstmmthNawl
Surfwe
W e n s
CartUNSWC
8a194,
-
,
NM,
1985,
p.
951.
Appl.
Phys.
&&
3771(1997).
2
T w m ,
C.
M.,
Kury, J.
W.,
and
bithaup4
R
R.,
J.
3.JoImmm.
J.N.,Taag,P.K,dFOItsfC.A.,
J.App1.
Phys.
iz
4323 (1985).
4.
Campbell,
A.
W.
and
Travis, J.
R,
Eighth
Symposium
w
-
')
on
Dctmntia,
Naval
Surface
Wcapans
Center
NSWC
86194,
Albuqurxpus
NM,
1985,
P.
1057.
5.
k,
M.
R,
Kipp,
M.
E.,
aud
vaa Swol, P., Ekvmth
Intunaticud Debnation
Symposium,
Office
of
Naval
Rsrerrch OPIR
33300-5,
SnoWaJMs,
0,1998,
p.
788.
6.
Reaugh,
J.
E,
Lawroaco
Livenmre
National
7. Cochran, S. G. and Tarver, C. M., Shock Waves in
Condensed Matter-1983, J. R. Asay, R. A. Graham and G. K. Straub, eds., Elsevier Publishers B. V., 1984, p. 593.
8. Partom, Y., Seventh Symposium (International) on Detonation, Naval Surface Weapons Center NSWC M P
82-334, Annapolis, MD, 1981, p. 506.
J. Phys. Chem. 100.5794 (1996).
International Detonation Symposium, Office of Naval Research ONR 33300-5, Snowmass, CO, 1998, p. 599.
Eleventh International Detonation Symposium, Office of Naval Research ONR 33300-5, Snowmass, CO, 1998, p. 768.
Green, L. G., Propellants, Explosives, Pyrotechnics ,l&
117 (1993).
9. Tarver, C. M., Chidester, S. K., andNichols, A. L. III,
10. Tarver, C. M. andNichols, A. L. HI, Eleventh
11. Conley, P. A., Benson, D. J., and Howe, P. M.,
12. Tarver, C. M., Urtiew, P. A., Chidester, S. K., and
13. Fried, L., Howard, W. M., and Souers, P. C., EXP6:
A New Equation of State Library for High Pressure Thermochemistry, paper presented at this Symposium.
International Detonation Symposium, Office of Naval Research ONR 33300-5, Snowmass, CO, 1998, p. 872. 14. Maienschein, J. L. and Chandler, J. B., Eleventh
15. Farber, D. L., B u g , J. M., andRuddle, C., Shock Compression of Condensed Matter-2001, Furnish, M. D., Thadhani, N. N., and Horie, Y, eds. CP-620, A P
Press, New York, (2002).
16. Tarver, C. M., Cook, T. M., Urtiew, P. A., and Tao, W. C., Tenth International Detonation Symposium, Office ofNaval Research ONR 33395-12, Boston, MA, 1993, p. 696.