0002-5242-0950>, OMAN, Paul, RAJASEGARAR, Sutharshan and ZHU, Ye
Available from Sheffield Hallam University Research Archive (SHURA) at:
http://shura.shu.ac.uk/21595/
This document is the author deposited version. You are advised to consult the
publisher's version if you wish to cite from it.
Published version
ANGELOVA, Maia, ELLMAN, Jeremy, GIBSON, Helen, OMAN, Paul,
RAJASEGARAR, Sutharshan and ZHU, Ye (2018). User activity pattern analysis in
Telecare Data. IEEE Access, 6 (1), 33306-33317.
Copyright and re-use policy
See
http://shura.shu.ac.uk/information.html
Sheffield Hallam University Research Archive
Date of publication xxxx 00, 0000, date of current version xxxx 00, 0000. Digital Object Identifier 10.1109/ACCESS.2017.DOI
User activity pattern analysis in Telecare
Data
MAIA ANGELOVA1, JEREMY ELLMAN2, HELEN GIBSON3,PAUL OMAN4, SUTHARSHAN RAJASEGARAR1, AND YE ZHU1, (Member, IEEE)
1School of Information Technology, Deakin University, Victoria, 3125, Australia
2Department of Computer and Information Sciences, Northumbria University, Newcastle Upon Tyne, NE1 8ST, UK 3CENTRIC, Sheffield Hallam University, Sheffield, S1 2NU, UK
4
Department of Mathematics, Physics and Electrical Engineering, Northumbria University, Newcastle Upon Tyne, NE1 8ST, UK
Corresponding author: Maia Angelova (e-mail: [email protected]).
We thank the European FP7 Research Grant: FP7-PEOPLE-IRSES-247541 (Modelling and technological solutions for improvement and enhancement the quality of life) for the partial funding of this research. Maia Angelova thanks the Academy of Medical Sciences support via the Newton Advanced Grant and Ye Zhu thanks Deakin University for the research fellowship. Maia Angelova and Jeremy Ellman thank Glenda Cook for introducing them to the telecare research and her valuable advice for telecare usage in the North East of England. We thank Tunstall for providing the data and the telecare call centre in the North East of England for the useful suggestions and discussions.
ABSTRACT Telecare is the use of devices installed in homes to deliver health and social care to the elderly and infirm. The aim of this paper is to identify patterns of use for different devices and associations between them. The data were provided by a telecare call centre in the North East of England. Using statistical analysis and machine learning, we analysed the relationships between users’ characteristics and device activations. We applied association rules and decision trees for the event analysis and our targeted projection pursuit technique was used for the user-event modelling. This study reveals that there is a strong association between users’ ages and activations, i.e., different age group users exhibit different activation patterns. In addition, a focused analysis on the users with mental health issues reveals that the older users with memory problems who live alone are likely to make more mistakes in using the devices than others. The patterns in the data can enable the telecare call centre to gain insight into their operations, and improve their effectiveness in several ways. This study also contributes to automatic analysis and support for decision making in the telecare industry.
INDEX TERMS Ageing Care, Data Analytics, Machine Learning, Statistical Analysis, Telecare.
I. INTRODUCTION
Older people want to remain in their own homes as long as possible, yet there are anxieties about safety and risk issues that are associated with independent living, particularly for those who are frail, disabled or have cognitive problems. In the UK these anxieties often prompt older people to move away from their own homes and to move to supportive living environments [4]. One response to this societal challenge of enabling older people to age-in-place, has been the devel-opment of assistive technologies (AT), such as home-based telehealth, telecare, and telemedicine devices and systems [3], [12], [22].While telemedicine and telehealth monitor health remotely, telecare supports health by focusing on the social care aspects for independent living. It monitors users’ activities, increases their security and safety, and provides a quick alert to the carers [25].
In Europe and Australasia (comprising Australia, New
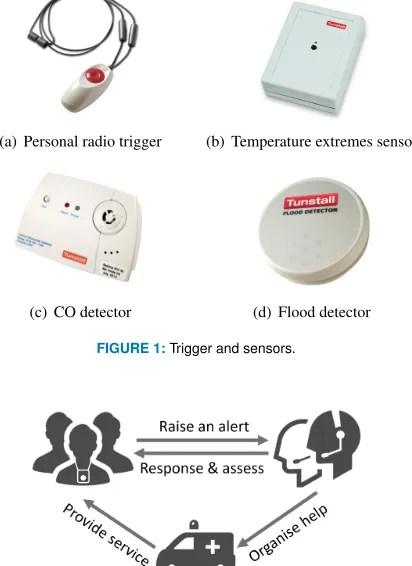
Zealand, neighbouring islands in the Pacific Ocean), telecare systems have been developed in connection with existing community social alarm systems [7], [18], [19]. A control centre or call centre monitors these personal alarm systems and manages the response. In order to receive help quickly, users can trigger the alert using telephone handsets or pen-dants which are linked to the call centre. However, a user may not be physically able to trigger the alert in some emer-gency situations, therefore efforts are in the development of devices and sensors which can raise the alarm without the service user participating. This model of home-based telecare systems (integrated social alarm with devices and sensors) has been implemented in many places, such as England and Scotland in the UK [2].
in Figure 1. Note that for a specific kind of sensor, there are different variations, but their functions and features are similar. These sensors have been connected to personal alarm systems which can be triggered either automatically or man-ually. Once an alarm is triggered, the call centre operator will speak to the user to ascertain the reason for the activation/call and provide relevant services such as sending an ambulance or warden to the site. Figure 2 demonstrates a workflow of a general telecare system.
(a) Personal radio trigger (b) Temperature extremes sensor
[image:3.576.59.265.189.472.2](c) CO detector (d) Flood detector
FIGURE 1:Trigger and sensors.
FIGURE 2:A workflow of a general telecare system.
Although the deployment of telecare services is being driven by policy and supported through government grants with a high deployment of social alarms, such as in the UK [10], [16], there is still little evidence supporting the efficacy of telecare [5]. There has been an increase in the number of studies that consider either the demand for personal care alarms for older people [13], [14], or demonstrate interest in using such devices [20] or alternatively evaluate the usability of specific devices [15]. However, there is little research that identifies the patterns of behaviours of service users utilising integrated home-based telecare systems. Despite the development of new devices and Internet of Things (IoT) implementations [24], the devices reported here represent basic elements of home-based telecare system.
This study aims to identify users’ patterns of behaviour through analysis of the contact data that was generated through interaction between a telecare service provider and its users in the North East of England. It comprehensively investigates a dataset [7] collected by harvesting the logs of
this telecare call centre during 5 years between 2007 and 2011. We use statistical and machine learning techniques to analyse the contact data of a telecare centre and reveal users’ patterns. To the best of our knowledge, there has not been a comprehensive study performed in such data previously.
Our analysis of user activity patterns reveals important insights that can help improve the telecare call centre oper-ations (as discussed in Section 5). Furthermore, this reveals the importance and advantages of adopting a real time ac-tivity monitoring for the elderly. This acac-tivity analysis and monitoring approach is not only applicable for monitoring the elderly, but also for general smart home monitoring [23], [26], e-health applications [1], [14] and the IoT applications [6], [11].
The paper is organised as follows: Section II explains the nature of the data and procedures for data cleaning and preparation. Section III gives details for the machine learning methods used for analysis. Section IV presents the results of the statistical analysis and the patterns identified by different machine learning algorithms. This is followed by the discussion in Section V.
II. THE DATASET AND ITS PREPARATION
[image:3.576.306.534.427.715.2]In this paper, we analyse the data from a telecare call centre in the North East of England. The information about 507 telecare service users and access to data related to these indi-viduals was provided after receiving their consent and ethical approval for this research. Figure 3 presents the geographical distribution of users on a map of the UK grouped by district.
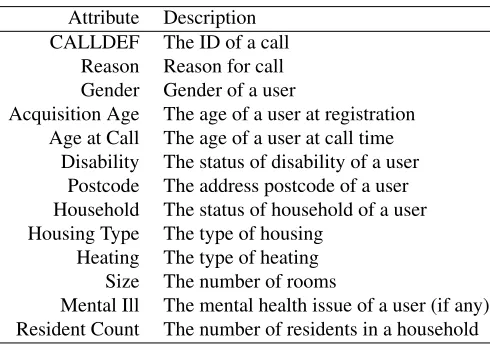
TABLE 1:Main attributes of the telecare dataset.
Attribute Description CALLDEF The ID of a call
Reason Reason for call Gender Gender of a user
Acquisition Age The age of a user at registration Age at Call The age of a user at call time
Disability The status of disability of a user Postcode The address postcode of a user Household The status of household of a user Housing Type The type of housing
Heating The type of heating Size The number of rooms
Mental Ill The mental health issue of a user (if any) Resident Count The number of residents in a household
The data includes users’ personal information (such as age, gender, housing conditions and location), activation of telecare devices and sensors, and contact information from the telecare call operators to service users (such as response times, reasons for calls and centre actions).
The data have been cleaned and standardised following the methods described in the previous telecare everyday usage research [7]. Table 1 shows the main attributes in the telecare dataset used for our analysis.Note that, we do not have the data about technical skills of the user and the quality of life of the person, thus, we assume that all users know how to use these devices properly.
III. METHODS
One of our tasks was to understand the distribution of ac-tivations and how they differ across age groups. This is important for the telecare provider as it can help to schedule and manage their systems and resources more effectively. Furthermore, understanding the patterns of usage may lead to other insights about the data not previously considered.
In this paper, we have applied basic statistical analysis and three popular machine learning algorithms to the telecare data in order to analyse the relationships between users’ characteristics and device activation. We applied the associ-ation rule and decision tree for event analysis and applied targeted projection pursuit for the user-event modelling. The following is the description of the three machine learning algorithms.
A. ASSOCIATION RULE LEARNING
Association rule learning can be used for discovering inter-esting relations between different variables [8]. There are three criteria for identifying important rules; they are sup-port,confidenceandlift. Given a set of elements X from a collection of records, the support of a rule Supp(X) is defined as the proportion of records in the dataset which contains the element set. Support indicates how frequently the itemset occurs in the data.
The confidence of a rule indicate how often the rule has been found to be true, defined as
Conf(X⇒Y) = Supp(X∪Y)
Supp(X) (1)
In addition, we can measure the dependence between elements using the lift of a rule, defined as
Lif t(X⇒Y) = Supp(X∪Y)
Supp(X)×Supp(Y) (2)
In order to select interesting rules from all possible rules, we can set minimum thresholds on support, confidence and lift.
We applied the Frequent Pattern(FP)-growth algorithm [9], an efficient and scalable method for association rule learning, on this call data, where we selected activation and the five attributes age at call, housing type, household, mental health issue and disability.
B. DECISION TREE ANALYSIS
Decision trees are one of the most popular decision support tools for classification and prediction using tree-like graphs such that each internal node represents one of the input attributes and each leaf node represents a class label [21]. A tree typically begins with a single node and then iteratively branches into possible outcomes based on different criteria. It also can be used to denote temporal or causal relations between different attributes.
We built a decision tree on the call records data by setting the activation events as responses and using the other 12 attributes as predictors. Furthermore, we built a regression tree (a decision tree to predict a real number rather than a class) on a user-call matrix to further verify the relationship, where each row in the matrix represents a user and each column in the matrix represents the number of calls made by one of the activation events. Note that we only selected activation events with a frequency of at least 10 from the call records to get a more robust model.
C. TARGETED PROJECTION PURSUIT
Targeted projection pursuit (TPP) is a visual dimension reduction technique based on projection pursuit. A typical problem of data analysis is that often the user does not know what they are looking for, i.e., what will be of interest. TPP allows the user to explore and interact with the data and follow their intuitions and hypotheses.
Formally, a set of n entities is described by the n ×p
matrixXthat defines each entity’s position inp-dimensional space. A p×2 projection matrixP maps the entities onto two-dimensional space to allow exploration of the projection. When the user defines ann×2target viewT, TPP searches for a projection that minimises the difference between this target view and the projection.
in order and standard back-propagation is used to train the network to the target matrixT according to a least-squares calculation. Once convergence is reached the original data is transformed into the 2D view where the connection weight between each input neuron and the two output neurons gives the weight of each dimension in the final projection and thus the projection matrix.
Whilst TPP is completely interactive, a typical first step is to analyse clusters in the data. Here the k-means clustering algorithm [17] is used to generate the clusters. The aim is to find a projection that best separates the clusters in two-dimensional space. This is the first time that TPP has been used to analyse telecare data.
In order to model activations based on different users, we applied TPP on a transformed user-activation matrix. We first re-coded the original data to eliminate errors (false alarms) and to get more clear and meaningful visualisation results. The list of reasons for contacting the call-centre were standardised so that each service user was the point described in high-dimensional space with each dimension representing one of the 32 main activation events. The value of each attribute for each service user is the standardised number of times (mapped to a[0,1]scale) that the service user has raised that event in a certain time period.
IV. RESULTS
A. STATISTICAL DATA ANALYSIS
1) Age distribution
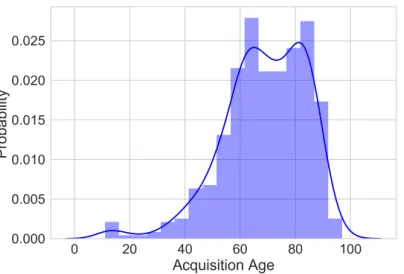
[image:5.576.305.532.185.332.2]Among the 507 consenting service users, 190 users were male and 268 female and 49 users were without gender information. The acquisition age distribution is bimodal, and left-skewed with peaks at ages between 62-67, with a second peak at ages between 82-87 years giving an overall mean acquisition age of 69 years (standard deviation is 15), as shown in Figure 4.
FIGURE 4:Histogram of user age distribution with probability.
Figure 5 is a violin plot of the user age distribution cat-egorised by household. It shows that the acquisition ages of users living in different households are different. The “living alone” users are the eldest with the median age of 77, followed by the “single parent” users with a median age
of 72 and then “couple” with a median age of 66. For those users belonging to families, females have a median age of 66, which is 10 years older than the corresponding male users. Users “living with family” have a very wide age range from 12 to 97. Note that there was one male user who was aged 17 and living with family. When grouping users based on house type, we found that older users tended to live in a house or bungalow, while younger users prefer living in lower ground flats. Please see Figure 14 in the Appendix for further details.
FIGURE 5:A violin plot of user age distribution categorised by household and gender. Note that the white dot is the median for each group and width of the coloured area is the density plot illustrating the corresponding frequency. Each thick black bar indicates the interquartile range and the thin black line extended from it shows the 95% confidence intervals.
2) Household distribution
Based on available information from the user data, there are 191 couples, 3 single parents, 33 live as part of a family and 9 live in with family, whilst 221 live alone. 254 live in one-bed bungalows, 76 live in lower floor flats, 14 live in upper floor flats, 2 live in the sheltered unit and the remaining 151 in larger houses.
Generally, most users are living alone or are part of a couple, and living in a house or bungalow. Only 0.7% of users are single parents and 2% of users are living in with family. There are 0.4% of users living in sheltered units and 2.8% of users living in upper floor flats. The distribution of users living in different households and house types is shown in Figure 13 in the Appendix.
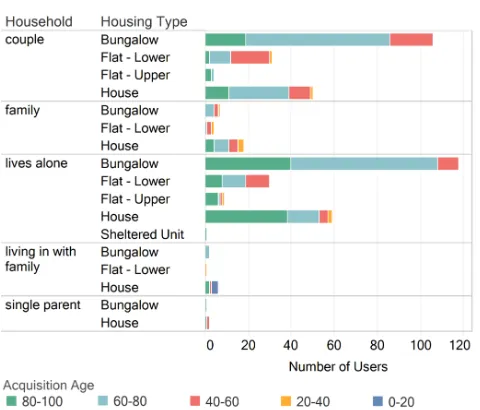
Figure 6 examines the age distribution of users across the types of household. Here we plot a bar chart on the number of users grouped by household and housing type. In addition, we divide all users into 5 different age groups and colour the bar chart accordingly. It is worth mentioning that most users aged 80-100 years old, possibly the frailest and most vulnerable, are living alone in bungalow or house.
3) Disability and mental health issues user distributions
[image:5.576.48.250.507.644.2]FIGURE 6:Detailed house hold distribution categorised by housing type and acquisition age.
issues into 12 classes based on their descriptions, e.g., “short term memory loss”, “memory loss” and “poor memory” users are all put into a “memory problems” class.
Regarding disability and users with mental health issues, we found that most users around 80 years old are registered disabled and live alone. The most common mental issues are memory problems, depression and anxiety. Additionally, most users with memory problems are around 60 to 80 years old but most users with depression and anxiety are around 40 to 60 years old. The visualisation results regarding these users are shown in Figure 15 and Figure 16 in the Appendix.
4) Calls distribution
We have analysed 19320 detailed call records from these 507 users. For each call, we have the basic user information, call time, reason of call and call duration.
In order to analyse the call distribution, we plot a bar chart of the number of calls from different households and housing types, as shown in Figure 7. In this figure, we also divided each bar and coloured the bars according to the caller’s age. Comparing with Figure 6, we can see that users living alone in a house made the most calls and most of them were aged 80-100 years old. People living in a family household in lower flats also made more calls than others, and most of them were aged 60-80.
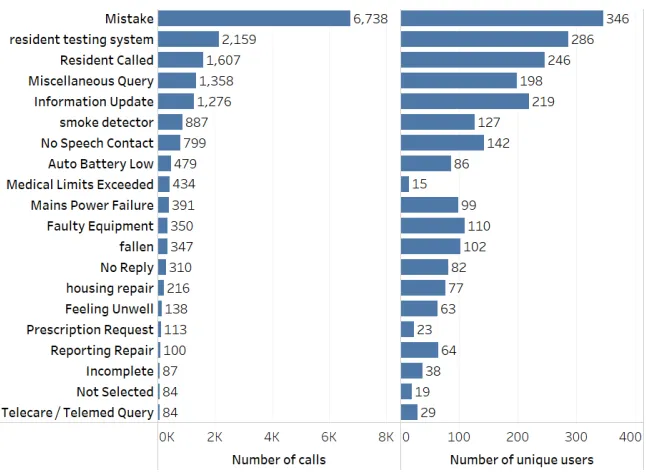
Figure 8 presents the main reasons for these calls with the number of users made these calls. “Resident called” means that the resident had called the centre. “No speech contact” and “no reply” means the resident called the centre, but when the centre took the call the resident hung up. Many residents may have very limited social contact so they may not talk to anyone all day except the call centre operator, so the call may just be to hear another voice.
The analysis shows that 36.41% calls are mistakes (false alarm) and 12.11% calls are the resident testing the system.
FIGURE 7:Calls distribution categorised by household.
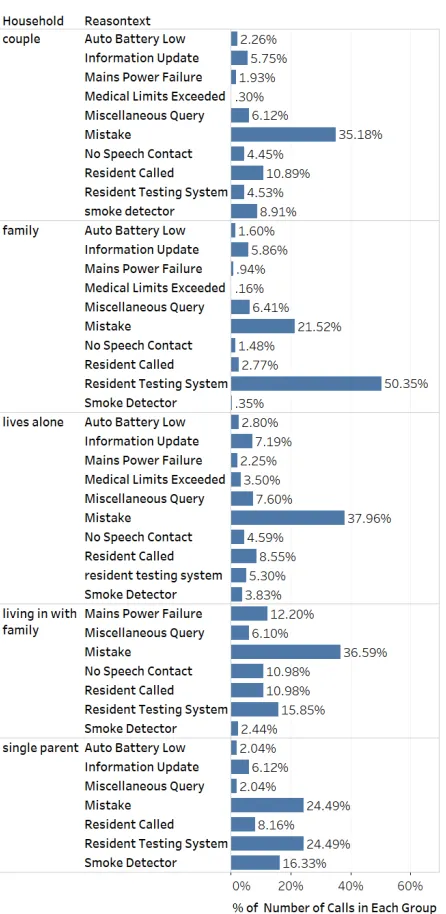
Note that a mistake may be due to a false alarm from a sensor or a mistake from a user, but we do not have the available data of detail reasons. Other main reasons which have more than 5% of the calls include resident called, miscellaneous query, information update and smoke detector. When cross-classifying these calls into the household, we can see that users who live alone were the most likely to make mistake calls, and 50.63% of calls from family users were about residents testing the system. Please see Figure 17 in the Appendix for more details.
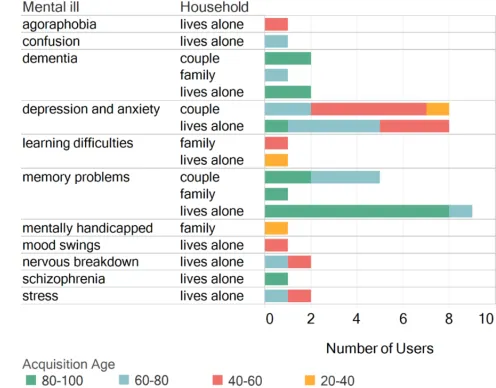
It is important to pay close attention to the data for users with mental health issues. We found that the older users who live alone with memory problems made 3282 calls through this 4 year period, as shown in Figure 9. Note that there were about 36% of calls due to mistakes. Comparing with Figure 16, users with memory problems are much more likely to make calls than those with other mental health issues. 44% of their calls were made by mistake without detailed reasons.
B. ASSOCIATION RULE LEARNING
In order to get more meaningful patterns from call records, we used the FP-growth algorithm with the setting of 0.1%, 1% and 3 as thresholds for support, confidence and lift, respectively. Recalling that, the three index measure the significance of the rules, i.e., the higher the value of the three index are, the strong association between the itemset is.
Table 2 presents 12 meaningful rules from the 247 rules generated by this algorithm. The results show that there is a high probability of occurrence of “medical limits exceeded” caused by users who live alone and have memory problems. Users aged 80-100 with depression and anxiety are likely to request “information update”and users aged 60-80 are more likely to cause smoke detector alarm.
[image:6.576.299.538.59.282.2]FIGURE 8:Illustration of top 20 reasons of calls with the number of users who made the calls.
TABLE 2:Typical rules identified by FP-growth algorithm.
Characteristics Reason Support Confidence Lift
Aged 40-60 & lives alone & House Auto Battery Low 0.0015 0.21 8.23
Aged 60-80 & lives alone & not reg disabled & Flat - Lower Faulty Equipment 0.0022 0.08 4.15
Aged 60-80 & memory problems No Speech Contact 0.0053 0.18 4.38
Aged 60-80 & not reg disabled Smoke Detector 0.0208 0.17 3.60
Aged 80-100 & depression and anxiety Information Update 0.0028 0.40 6.03
Aged 80-100 & House & not reg disabled Fallen 0.0022 0.12 6.83
Aged 80-100 & lives alone & Bungalow & not reg disabled Housing Repair 0.0021 0.05 4.11 Aged 80-100 & lives alone & Reg Disabled & Bungalow Prescription Request 0.0020 0.04 6.44
Aged 60-80 & couple & not reg disabled Fire 0.0011 0.02 4.98
lives alone & memory problems Medical Limits Exceeded 0.0096 0.08 3.34
Flat - Lower & family Resident Testing System 0.0657 0.74 6.53
schizophrenia Mains Power Failure 0.0022 0.53 25.54
TABLE 3:“High risk” characteristics identified by FP-growth algorithm.
Characteristics Support Confidence Lift
Aged 40-60 & House 0.0057 0.31 1.40
Aged 60-80 & not reg disabled 0.0448 0.36 1.59
Aged 40-60 & lives alone & Bungalow 0.0016 0.37 1.67 Aged 60-80 & Reg Disabled & history of mental problems 0.0014 0.42 1.86 Reg Disabled & Bungalow & memory problems 0.0022 0.43 1.94 Aged 60-80 & couple & not reg disabled 0.0240 0.46 2.07
Aged 40-60 & Reg Disabled & family 0.0044 0.51 2.26
lives alone & Flat - Lower & depression and anxiety 0.0019 0.51 2.27
Aged 80-100 & nervous breakdown 0.0012 0.61 2.70
Aged 60-80 & House & family 0.0161 0.66 2.95
We divided all activations into two groups depending on their relative emergency and ran the FP-growth algorithm again to identify the groups of users at most risk. Here we labelled 10 activations such as “Smoke detector”, “Fire” and “Fallen” as “high risk” activations, while treating remaining activations
[image:7.576.96.477.510.644.2]FIGURE 9:Main reason of calls categorised by mental issues.
and living with family in house are likely to cause high risk activations. The users with aged 60-80 without disable also are likely to cause high risk activations.
C. DECISION TREE
We found that even after building a large tree we still cannot get good prediction results based on these attributes since many users’ characteristics significantly overlap for different device activations. If we run the decision tree on the binary labels in terms of “high risk”, it still misclassifies about 21.45% of the validation observations.
Predictor Importance Estimates
0 0.2 0.4 0.6 0.8 1 1.2 1.4 1.6 1.8
Estimates 10-4
Heating Type Resident Count Disability Gender House Size Mental Health Issue Household Address Postcode Housing Type Age at Call
[image:8.576.345.496.361.568.2]Predictors
FIGURE 10:Predictor importance estimated by a decision tree.
However, a decision tree can determine the importance of each attribute based on the corresponding reduction of predictive accuracy by that attribute. Figure 10 shows the pre-dictor importance estimated by a decision tree on this data. It can be seen that “Age at Call” is the most important vari-able affecting the prediction on activation events, followed by “housing type”, “address postcode” and “household”. In other words, users from similar age groups may have similar needs and demands and trigger similar alarms.
Since different users may have different living habits and demands, it is important to build a model for activations on each user. To keep consistency in terms of users’ ages, we select all call records and convert these data to a user-call matrix such that each row represents a user and each column represent the number of calls made by one of the activation events.
We applied a regression tree on the user-call matrix and got the predicted ages and found that the mean of absolute errors of the regression is 5.75. This means that the predicted age is very close to the true age. This result also confirms that there is a strong association between users’ ages and activations.
D. TARGETED PROJECTION PURSUIT
1) All activations for service users
Figure 11 shows the service users clustered, using TPP andk -means clustering, into four groups. The decision to separate the graph into four clusters (groups of users) was made after testing both lower and higher numbers of clusters and finding four was optimal in terms of cluster separation and determin-ing the contribution of the dimensions. The most significant attributes in separating these four clusters are: Warden, Re-pair, Fire/Fire Service, Smoke detector, Handyperson service and Accident and Emergency.
Warden
Fire/Fire Service Repair
Smoke Detector Handyperson
Service A & E
FIGURE 11: TPP projection of service users and their associated device activations onto a two-dimensional space, clustered and separated into four clusters. Values of attributes are the number of activations raised by that service user over the time period standardised to a[0,1]-scale. “A & E” means accident/emergency. Note that the labels on the figure are different axis names and we only display the most important axis labels.
[image:8.576.39.264.412.594.2]remember that a longer axis does not necessarily mean that the events occur more often since all axes represent a[0,1]
scale irrespective of their length. Therefore, the placement of the points shows the distribution of the service users along this scale.
Three main identifiable groups appear in the projection. The first is the co-occurrence of the smoke detector with fire service. This seems a logical pairing as smoke detector events may escalate into a situation where the fire service is required. This shows that smoke detector events need to be prioritised so that the fire service does not need to be called.
Repair, as a significant event, is also a positive sign for the telecare service. Having someone that the service user can call to come and carry out these small jobs is usually consid-ered reassuring for the service user. This may be because the service user has no nearby relatives to help them with small jobs and they do not know who else to call to ask for help. Without this repair service, they may even attempt to carry out the repair themselves which could result in them injuring themselves or the job may not get done at all which could become dangerous in itself. In a similar vein, the warden service also appears to be important.
The next step would be for the telecare service to keep track of the purpose of these visits. Once they have this data they will be able to analyse if there are ways to improve the efficiency of this service or it may identify additional telecare services needed to further support the service user. The high use of the warden service may also indicate that the telecare service is working and is supporting the service users where they need it most. Highlighting this use has already allowed the telecare company to consider how they allocate and plan their warden visits more effectively.
2) Activations by age group
The age range of the service users is greater than fifty years, so comparisons between age groups is possible. This is interesting because the needs of the service user may vary as users grow older. Looking at activations within age groups should give us insight into how the device usage and the activations change. Further, recommendations may then be made based on these observations.
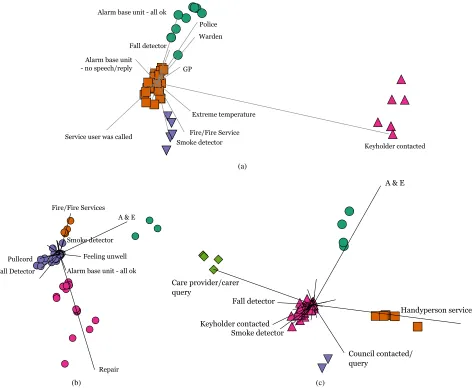
Each service user was placed in an age group spanning ten years. Here we show the results of those residents in groups aged between 60 and 89. “Age” is the service user’s age when the call was made; those residents who have neither a date of birth nor an age listed are excluded. Figure 12 shows three TPP projections for service users in the different age groups. Figure 12(a) shows the TPP projection for the 60–69 age group. There is a cluster who activate devices that respond to extreme temperatures (the fire service and smoke de-tectors) similar to the usage pattern shown in Figure 11. This demonstrates that perhaps users in this age group are particularly susceptible to problems such as forgetting to turn the oven off. The other significant cluster regularly requires the property keyholder to be contacted. A keyholder may be a neighbour, relative or friend who is a point of contact for the
call-centre when there appears to be some kind of problem with the service user and someone is required to check on them.
In the 70–79 age group, the nine most significant acti-vations are labelled, as shown in Figure 12(b). This group have “A & E” as a significant dimension perhaps meaning that, for this age group, those calls should be prioritised or that those specific users should be monitored to see why they are requiring the emergency services so frequently and if additional support can be offered to help prevent these visits. The combined significant dimensions of the smoke detector and fire service appear again and, although they form a small group, the constant re-appearance of these activations together requires further investigation. The second largest cluster contains those service users that have used the repair service. Again, the use of this service is high and this is clearly one of the most used parts of the telecare service. Therefore it is vital to understand why this is always one of the more significant events, which repairs are being carried out by this service and if there are any ways that it can be made more effective and efficient.
Ages 80–89 is the largest group and they are perhaps the most likely to need to enter residential care without telecare. This group has 149 service users which are split into five clusters, as shown in Figure 12(c). This means that 88% of the service users lie in one cluster (pink up-triangle in the middle of Figure 12(c)). The remaining 12% are divided between the other four clusters. This makes an analysis of this projection particularly difficult because we are only really seeing the outliers and not how the majority use the service. This is the first age group where repair is not a key attribute although the handyman service and A & E are. The fact that the carer or care provider is also contacting the service also might be an indication of how the service is used differently for those who are older. The use of the handyperson service is also good because similar to the repair service it allows users to contact someone when there is a problem rather than fretting about who they can get to fix their problem or attempting to fix it themselves.
V. DISCUSSION AND CONCLUSION
Telecare is specifically designed to address the social aspects of enabling independent living for disabled and older people. Whilst deployment of these services is being driven by pol-icy and supported through grants, little is known about the utilisation of telecare devices following installation of home-based telecare packages. This study provides an analysis of 5 years of contact data that was generated through interaction between the service and service user within a telecare call centre in the North East of England.
Keyholder contacted Police
Alarm base unit - all ok
Service user was called
Warden
Fire/Fire Service Smoke detector
Extreme temperature Fall detector
Alarm base unit
- no speech/reply GP
(a)
Repair A & E
Feeling unwell Fire/Fire Services
Fall Detector Pullcord
Alarm base unit - all ok Smoke detector
(b)
Handyperson service A & E
Care provider/carer query
Council contacted/ query
Keyholder contacted Smoke detector
Fall detector
[image:10.576.45.517.59.448.2](c)
FIGURE 12:The TPP projection for service users in the different age groups with the most significant axes in the cluster projection labelled. (a) is the TPP projection for the 60–69 age group, (b) is the TPP projection for the 70–79 age group and (c) is the TPP projection for the 80–89 age group. “All OK” means the residents call the centre even when they have no problems. Many residents may have very limited social contact so they may not talk to anyone all day except the call centre, so the call is just to hear another voice.
as follows:
All the presented results make a more effective use and installation of equipment possible. For example, it was ob-served that usage and type of equipment have been shown to vary between different age groups. Identifying this character-istic means that more effective decisions regarding the type of equipment needed by different age group of users can be made.
Moreover, it is also possible to increase the efficiency of warden and repair visits. Both warden and repair visits are expensive and yet they are one of the most common outcomes of contact with the call-centre as shown in Figures 11 and 12(b). Highlighting this through the machine learning algorithms empowers the telecare call centre to improve users’ care and also efficiency in planning the visits. The call centre is also able to prioritise calls to the ambulance service and relatives. Figures 11 and 12 both show high densities for visits to A & E or contact with the service user’s family.
Several limitations associated with analysing this telecare dataset have also been noted. For the machine learning algo-rithms’ application, we assume that each user is independent of others, however, many users actually live with a partner or family. It would be interesting to investigate further the activities based on different households rather than individu-als. Particularly in TPP, no interesting pre-defined clustering existed (although classes could exist through location, hous-ing types, household, house size and heathous-ing) and clusterhous-ing withk-means and other clustering methods either produced uneven clusters or failed to find much natural clustering in the data.
issues would be helpful for the telecare industry to design more appropriate equipment and service for these users. In addition, further understanding the economic savings based on this research is important for the further work.
CONTRIBUTIONS
Maia Angelova planned the research, developed the models and analysed the data. Helen Gibson applied machine learn-ing algorithms for data analysis and interpretation of results. Jeremy Ellman cleaned and prepared the data for mod-elling. Paul Oman did statistical data analysis. Sutharshan Rajasegarar did statistical and machine learning analysis. Ye Zhu did statistical and machine learning analysis. Maia Angelova, Helen Gibson, Jeremy Ellman and Ye Zhu wrote the paper.
.
[image:11.576.314.518.65.198.2]APPENDIX A VISUALISATION RESULTS
Figure 13 to Figure 17 are additional visualisation results.
(a)
[image:11.576.302.540.229.368.2](b)
[image:11.576.62.550.322.710.2]FIGURE 13:(a) is the household type distribution and (b) is the housing type distribution.
FIGURE 14:A violin plot of user age distribution categorised by house type.
FIGURE 15:User distribution categorised by household. Note that “reg” means registered.
REFERENCES
[1] T. Anand, R. Pal, and S. K. Dubey. Data mining in healthcare informat-ics: Techniques and applications. In 2016 3rd International Conference on Computing for Sustainable Global Development (INDIACom), pages 4023–4029, March 2016.
[2] David Barrett, Jonathan Thorpe, Nick Goodwin, D Barrett, J Thorpe, and N Goodwin. Examining perspectives on telecare: factors influencing adoption, implementation, and usage. Med Device Evid Res, 8:11–9, 2015. [3] AJ Bharucha, V Anand, J Forlizzi, MA Dew, CF Reynolds, S Stevens, and
[image:11.576.70.294.348.693.2] [image:11.576.289.537.519.713.2]FIGURE 17:Main reason of calls categorised by household.
H Wactlar. Intelligent assistive technology applications to dementia care: Current capabilities, limitations, and future challenges. The American journal of geriatric psychiatry : official journal of the American Associ-ation for Geriatric Psychiatry, 17(2):88–104, 2009.
[4] Jerome Billeter. The housing our ageing population panel for innovation (happi) report (2009). Homes and Communities Agency, 2012. [5] Christina M. Blaschke, Paul P. Freddolino, and Erin E. Mullen. Ageing and
technology: A review of the research literature. British Journal of Social Work, 39(4):641–656, 2009.
[6] Feng Chen, Pan Deng, Jiafu Wan, Daqiang Zhang, Athanasios V Vasi-lakos, and Xiaohui Rong. Data mining for the internet of things: literature review and challenges. International Journal of Distributed Sensor Net-works, 11(8):431047, 2015.
[7] G. Cook, J. Ellman, M. Cook, and B. Klein. Everyday usage of home telecare services in England. In 2013 6th International Conference on Human System Interactions (HSI), pages 586–593, June 2013.
[8] Michael Hahsler, Bettina GrÃijn, and Kurt Hornik. arules - a compu-tational environment for mining association rules and frequent item sets. Journal of Statistical Software, Articles, 14(15), 2005.
[9] Jiawei Han, Jian Pei, and Yiwen Yin. Mining frequent patterns without candidate generation. In Proceedings of the 2000 ACM SIGMOD Inter-national Conference on Management of Data, SIGMOD ’00, pages 1–12, New York, NY, USA, 2000. ACM.
[10] ICT & Ageing — User Markets and Technologies, 2010.
[11] S. M. R. Islam, D. Kwak, M. H. Kabir, M. Hossain, and K. S. Kwak. The internet of things for health care: A comprehensive survey. IEEE Access, 3:678–708, 2015.
[12] Maged N. Kamel Boulos, Ricardo Castellot Lou, Athanasios Anastasiou, Chris D. Nugent, Jan Alexandersson, Gottfried Zimmermann, Ulises Cortes, and Roberto Casas. Connectivity for healthcare and well-being management: Examples from six european projects. International Journal of Environmental Research and Public Health, 6(7):1947–1971, 2009. [13] N. Lasierra, A. Alesanco, S. Guillén, and J. García. A three stage
ontology-driven solution to provide personalized care to chronic patients at home. Journal of Biomedical Informatics, 46(3):516 – 529, 2013.
[14] P. Lenca, J. Soulas, and S. Berrouiguet. From sensors and data to data mining for e-health. In 2016 8th International Conference on Knowledge and Smart Technology (KST), pages XIX–XIX, Feb 2016.
[15] Pernille Heyckendorff Lilholt, Morten Hasselstrøm Jensen, and Ole K. Hejlesen. Heuristic evaluation of a telehealth system from the danish tele-care north trial. International Journal of Medical Informatics, 84(5):319 – 326, 2015.
[16] Jennifer K. Lynch, Jon Glasby, and Suzanne Robinson. If telecare is the answer, what was the question? storylines, tensions and the unintended consequences of technology-supported care. Critical Social Policy, pages 1–22, 2018.
[17] J. MacQueen. Some methods for classification and analysis of multivariate observations. In Proceedings of the Fifth Berkeley Symposium on Math-ematical Statistics and Probability, Volume 1: Statistics, pages 281–297, Berkeley, California, 1967. University of California Press.
[18] Anthony Maeder, Nathan Poultney, Gary Morgan, and Robert Lippiatt. Patient compliance in home-based self-care telehealth projects. Journal of telemedicine and telecare, 21(8):439–442, 2015.
[19] José C Millán-Calenti, Santiago Martínez-Isasi, Laura Lorenzo-López, and Ana Maseda. Morbidity and medication consumption among users of home telecare services. Health & social care in the community, 25(3):888– 900, 2017.
[20] SR Nyman and CR Victor. Use of personal call alarms among community-dwelling older people. Ageing & Society, FirstView:1–23, 8 2012. [21] Lior Rokach and Oded Maimon. Data mining with decision trees: theory
and applications. World scientific, 2014.
[22] Bruno M.C. Silva, Joel J.P.C. Rodrigues, Isabel de la Torre Díez, Miguel López-Coronado, and Kashif Saleem. Mobile-health: A review of current state in 2015. Journal of Biomedical Informatics, 56(Supplement C):265 – 272, 2015.
[23] Nagender Kumar Suryadevara, Subhas C Mukhopadhyay, Ruili Wang, and RK Rayudu. Forecasting the behavior of an elderly using wireless sensors data in a smart home. Engineering Applications of Artificial Intelligence, 26(10):2641–2652, 2013.
[24] Changhong Wang, Wei Lu, Michael R. Narayanan, Stephen J. Redmond, and Nigel H. Lovell. Low-power technologies for wearable telecare and telehealth systems: A review. Biomedical Engineering Letters, 5(1):1–9, Mar 2015.
[25] Joseph P. Wherton and Andrew F. Monk. Problems people with dementia have with kitchen tasks: The challenge for pervasive computing. Interact-ing with Computers, 22(4):253 – 266, 2010.
MAIA ANGELOVAreceived her Ph.D. from the University of Sofia. Dr Angelova is currently a Professor of Data Analytics and Machine Learning in the School of Information Technology, Deakin University, Victoria, Australia. Prior to that, she was a Lecturer in Physics in Somerville College, University of Oxford and Professor of Mathemat-ical Physics at Northumbria University, United Kingdom until 2016.
Her research interests include mathematical modelling, data analytics, time series, machine learning, dynamical systems with applications to health.
JEREMY ELLMANreceived the B.Sc. degree in Experimental Psychology from the University of Sussex, UK, in 1978, the M.Sc. degree in Com-puter Studies from the University of Essex, UK in 1979, and the Ph.D. degree in Computer Science from the University of Sunderland, UK, in 2000. Dr Ellman has been a senior lecturer in Computer Science at the University of Northumbria, UK, since 2003.
Dr. Jeremy’s research works focus on the fields of Computational Linguistics, Artificial Intelligence, Big Data, and Cloud Computing.
HELEN GIBSONreceived her Ph.D. in network visualisation from Northumbria University, United Kingdom in 2014 having previously obtained a BSc. in Mathematics from the University of Ed-inburgh and an MSc. in Computing also from Northumbria.
Since then Dr Gibson has worked at the Cen-tre of Excellence in Terrorism, Resilience, Intelli-gence and Organised Crime Research (CENTRIC) at Sheffield Hallam University. She is currently a Senior Research Fellow at CENTRIC with her main research interests focusing on data mining, analysis, and visualisation within the security and law enforcement domains.
PAUL OMANreceived his PhD from Newcastle University, UK in 1989 and is currently Associate Head of the Department of Mathematics, Physics and Electrical Engineering at Northumbria Uni-versity, UK.
His current research interests include survival data analysis, frailty and data science.
SUTHARSHAN RAJASEGARARreceived his
Ph.D. degree from the University of Melbourne, Melbourne, VIC, Australia, in 2009. He has worked as Research Fellow with the Department of Electrical and Electronic Engineering, Univer-sity of Melbourne, and as a researcher in Machine Learning at National ICT Australia (NICTA).
Currently, Dr. Rajasegarar is a lecturer in the School of Information Technology, Deakin Uni-versity, Victoria, Australia. His current research interests include anomaly/outlier detection, distributed machine learning, pattern recognition, signal processing, health analytics and Internet of Things.
YE ZHU(M’17) received the B.E. degree in Com-puter Science from Central China Normal Univer-sity, Wuhan, China, in 2010 and the M.S. degree in Computational Management Science from Im-perial College London, UK, in 2012 and the Ph.D. degree in Artificial Intelligence from Monash Uni-versity, Victoria, Australia, in 2017.