NBER WORKING PAPER SERIES
COMPETING WITH THE NYSE
William O. Brown, Jr.
J. Harold Mulherin
Marc D. Weidenmier
Working Paper 12343
http://www.nber.org/papers/w12343
NATIONAL BUREAU OF ECONOMIC RESEARCH
1050 Massachusetts Avenue
Cambridge, MA 02138
June 2006
The authors would like to thank Farley Grubb, Julia Ott, George Smith, Bill Silber, Richard Sylla, Eugene White, Larry White, and seminar participants at Claremont McKenna College, Clemson, Delaware, Illinois, Kansas, NYU, UNC-Greensboro, and Texas Tech for comments. Corresponding Author’s Address: Marc D. Weidenmier, 500 East Ninth Street, Claremont, CA 91711. Email: [email protected]. Fax: (909)621-8249. The views expressed herein are those of the author(s) and do not necessarily reflect the views of the National Bureau of Economic Research.
©2006 by William O. Brown, Jr., J. Harold Mulherin and Marc D. Weidenmier. All rights reserved. Short sections of text, not to exceed two paragraphs, may be quoted without explicit permission provided that full credit, including © notice, is given to the source.
Competing With the NYSE
William O. Brown, Jr., J. Harold Mulherin and Marc D. Weidenmier
NBER Working Paper No. 12343
June 2006
JEL No. G1, G2, N2
ABSTRACT
We study the stock exchange rivalry between the New York Stock Exchange (NYSE) and the
Consolidated Stock Exchange (Consolidated) from 1885 to 1926 using a new database of bid-ask
spreads and stock data collected from The New York Times and other primary sources. The
magnitude of this important, but largely forgotten rivalry was substantial. From 1885 to 1895, the
ratio of Consolidated to NYSE volume averaged 40 percent and reached as high as 60 percent. The
market share of the Consolidated averaged 23 percent for approximately 40 years. The Consolidated
focused on the relatively liquid securities on the NYSE as measured by bid-ask spreads and trading
volume. Our results suggest that NYSE bid-ask spreads fell by more than 10 percent when the
Consolidated began to trade NYSE stocks while bid-ask spreads for our quasicontrol group of stocks
trading on the Boston Stock Exchange remain unchanged. The effect persisted over the entire history
of the stock market rivalry until a series of scandals and investigations of the Consolidated by state
regulators led to the demise of the exchange in the 1920s. The analysis suggests three conclusions:
(1) the NYSE has faced significant long-run competition (2) the NYSE may be susceptible to a
similar level of competition in the future and (3) that the Consolidated may have improved the
efficiency of stock prices by contributing to the price discovery process.
William O. Brown, Jr.
Department of Economics
Claremont McKenna College
Claremont, CA 91711
J. Harold Mulherin
Department of Banking and Finance
University of Georgia
Athens, GA 30602
Marc D. Weidenmier
Department of Economics
Claremont McKenna College
Claremont, CA 91711
and NBER
Competing with the NYSE
For a significant part of its 213-year history, the New York Stock Exchange (NYSE) has reigned as the leading stock exchange both within the United States and across the world. Recently, ongoing changes in technology and the globalization of stock trading have given rise to a number of competitors that threaten the NYSE’s position as the preeminent stock exchange. Technological change has played an important role in fostering the development of alternative trading systems (Macey and O’Hara, 1999). The globalization of trading may have large and significant effects on financial markets (Ramos, 2003). Indeed, in the July 21, 2005, S-4 filing related to its proposed merger with Archipelago, a rival exchange, the NYSE identifies the growth of global capital markets and the emergence of electronic communications networks as a significant threat to its dominant market share (p. 141).
The recently completed merger between the two exchanges raises many questions about the effects of head-to-head stock market competition with the NYSE. Unfortunately, prior empirical evidence offers little insight into this important public policy question. Research focusing on past (e.g., Branch and Freed (1977), Hamilton (1976, 1979, 1987), Tinic (1972)) and more recent episodes (e.g., Battalio (1997), Battalio, Greene and Jennings (1997)) of direct trading competition with the NYSE has studied relatively minor magnitudes of off-exchange trading by regional exchanges and/or the third market. Much of this minimal competition was often related to regulatory mandates by the Securities and Exchange Commission. (See Jarrell (1984) and Arnold, Hersch, Mulherin and Netter (1999).)
The lack of evidence on established NYSE competitors raises an even more fundamental question: Is the NYSE susceptible to significant competition? Previous work by Stigler (1961, 1964) suggests that the NYSE has natural monopoly characteristics and Chowdry and Nanda (1991) model the “winner takes most” feature of securities market trading concentration. The empirical evidence of Demsetz (1968) and Doede (1967) finds that the NYSE has economies of
scale and scope in securities trading and Hasan and Malkamaki (2001) report related findings for securities markets in the 1990s. Moreover, recent work by Barclay, Hendershott and McCormick (2003) reports that although electronic communication networks (ECNs) have made significant inroads against NASDAQ, the ECNs have made a much smaller dent in the trading of NYSE listings.
In this paper, we provide new evidence on both the viability and the nature of direct trading competition with the NYSE. We study the Consolidated Stock Exchange, a rival stock exchange that competed directly with the “Big Board” from 1885 to 1926. For almost 42 years, the Consolidated was an important competitor and garnered an average annual market share reaching as high as 60 percent of NYSE trading volume. This sustained incidence of competition with the NYSE came at a time of significant technological change in securities trading and thereby has direct relevance to the current competitive forces confronting the NYSE today.
Although the Consolidated has been noted in historical research by Nelson (1907), Garvy (1944), and Sobel (1972) and in more recent analysis of the property rights to price quotations by Mulherin, Netter and Overdahl (1991), there is little or no systematic analysis of this exchange’s impact on the NYSE. Indeed, in an otherwise insightful and comprehensive analysis, Doede (1967) discounts the importance of the rival exchange due to the absence of reported data on Consolidated trading volume (p. 27). We fill the historical and empirical void of this important episode of stock exchange competition with newly collected data from The New York Times and other sources.
Our analysis focuses on the effects of competition on the bid-ask spreads for NYSE stocks. We employ a series of complementary tests to identify the effects of stock market competition. We first study the impact of competition on bid-ask spreads when the Consolidated began to trade NYSE stocks in 1885. Then we analyze the effects of competition on bid-ask spreads for approximately 40 years of the stock exchange rivalry. Our results suggest that NYSE bid-ask spreads fell by more than 10 percent when the Consolidated began to trade NYSE stocks
while bid-ask spreads for our quasi-control group of stocks trading on the Boston Stock Exchange remain unchanged. The effect persisted across the 42-year rivalry between the two exchanges until a series of scandals and investigations by the New York State Attorney General’s Office in the 1920s led to the demise of the Consolidated. The findings are robust to a wide variety of changes in the empirical model and estimation technique. In addition, the empirical analysis suggests that the Consolidated may have improved the efficiency of stock prices by contributing to the price discovery process. Overall, our results suggest that the NYSE has faced significant long-run competition and may be susceptible to a similar level of competition in the future.
The remainder of the paper proceeds as follows. Section 1 describes the trading environment on the NYSE in the years prior to the onset of competition by the Consolidated in 1885. Section 2 reports data on the magnitude and nature of the stock market competition provided by the rival exchange over the period 1885 to 1926. Section 3 analyzes the short and long-run effects of competition on NYSE bid-ask quotes and tests whether the Consolidated contributed to the price discovery process. Section 4 summarizes the results and concludes the paper with a discussion of the implications of our findings for future studies of stock market competition.
1. The Trading Environment at the Onset of Competition
The Consolidated Stock Exchange was formed in early 1885 by the merger of the New York Mining Stock and Petroleum Exchange, the New York Petroleum Exchange and Stock Board and the Miscellaneous Securities Board. These exchanges initially specialized in mining and petroleum securities that were not traded on the NYSE. Soon after the merger, however, the Consolidated began trading railroad stocks and other securities listed on the NYSE. The New York Times reported that the Consolidated decided to trade NYSE listed securities in news articles dated January 21, 1885 and February 14, 1885. The newspapers began reporting Consolidated
trading volume of NYSE listed securities February 17, 1885 (See the Appendix of News articles).1
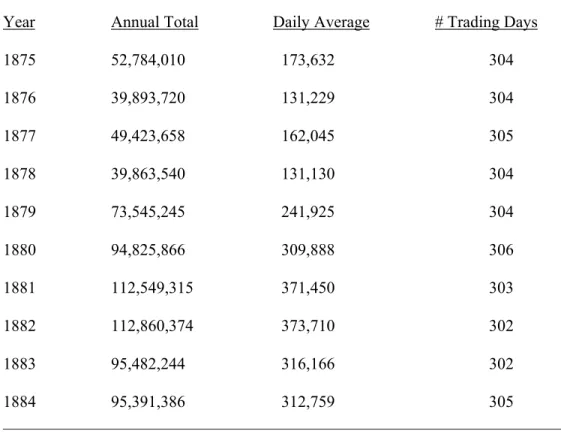
The onset of competition from the Consolidated occurred during a period of rapid growth in the depth and the breadth of trading on the NYSE. As reported in Table 1, in the ten years prior to the formation of the Consolidated, trading volume steadily rose and was, on average, twice as high in the 1880-1884 period compared to the 1875-1879 period. The number of trading days exceeded more than 300 each year because the NYSE opened for an abbreviated session of business on Saturday until after World War II.
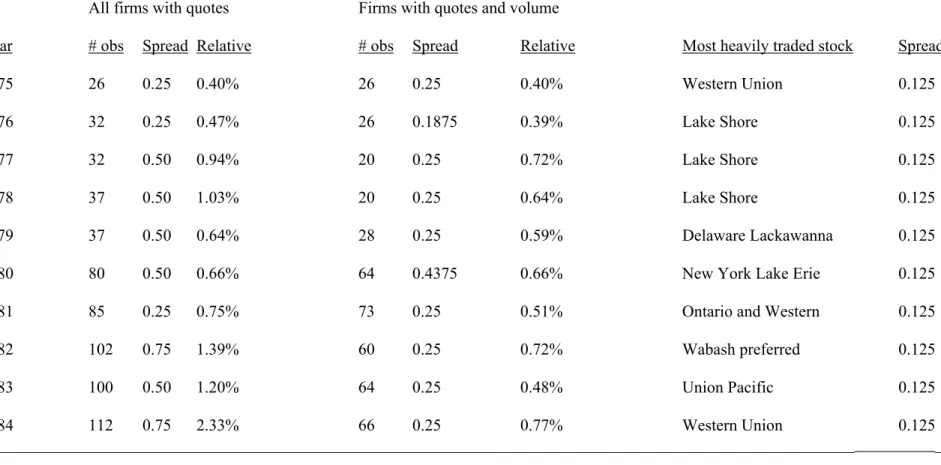
As reported in Table 2, the growth in volume was accompanied by an increase in listings on the NYSE, as proxied by the number of NYSE-listed firms reported daily in The New York Times. Historical records from the NYSE confirm that listings doubled on the exchange between 1875 and 1884. (See, e.g., the 1940 New York Stock Exchange Yearbook, p.49.) In addition, the median bid-ask spread increased across all NYSE stocks as the number of securities reported in The New York Times rose over time. However, the median spread for firms with reported trading volume remained at 0.25 for most of the period. Railroads or Western Union were the most active security for the sampled day in a given year. These securities always traded at the minimum tick of one-eighth.
Studies by Garvy (1944), Michie (1986), and Mulherin, Netter and Overdahl (1991) link the growth in the depth and breadth of NYSE trading activity to various technological innovations. The transatlantic cable was completed in 1866 and the stock ticker was invented in 1867. Telephones soon followed in 1878. Garbade and Silber (1978) report that financial markets readily adopted these new technologies. Accompanying organizational innovations such as the movement from call to continuous markets enhanced the available market for NYSE listings as well as the capacity for the exchange to trade.
1
For background on the formation of the Consolidated Stock Exchange, see Nelson (1907), Garvy (1944), Sobel (1972), and Mulherin, Netter and Overdahl (1991).
The innovations that enhanced the potential of the NYSE also increased the probability of competition from existing and rival exchanges (e.g., Garvy (1944), Michie (1986), and Mulherin, Netter and Overdahl (1991)). The Consolidated’s more than 2,000 members conducted trading on a floor in a building a few blocks from Wall Street at the corner of Broad and Beaver Streets. Because the NYSE, the New York Mining Stock and Petroleum Exchange and other predecessors had gentlemen’s agreements not to engage in direct trading competition, the Consolidated at its inception possessed stock tickers linked to the NYSE and thereby had ready access to the information required to engage in the trading of NYSE listings.
The Consolidated attracted trading in NYSE listings by charging lower commissions, offering odd lot trading, and allowing a longer settlement period. The rival exchange even functioned as the primary New York market when it opened one-half hour before the NYSE for a period beginning in July 1912. Commission rates on the Consolidated averaged 1/16th of the par value of a stock or half the brokerage commission charged by the NYSE. However, the NYSE had several loopholes that allowed members to bypass its high brokerage fees. Members that bought and sold stock between each other were charged rates as low as 1/32nd of par value and deals between brokers on the floor of the exchange could go as low as 1/50 percent of a stock’s par value. The discount on commissions was extended to all partners of an NYSE firm even if they did not own a seat on the exchange. The discount policy led to the creation of ever larger stockbroking firms (Michie, 1986). The Consolidated also dealt in odd lots, executing trades of only 10 shares as opposed to the NYSE that required an order size of at least 100 shares.2 In addition, the Consolidated had a two-week settlement period as opposed to the daily settlement period for the NYSE. The payment system used by the Big Board often exacerbated financial crises as bankers and brokers had little time to take countermeasures to avoid a crisis. Following a
2
Ott (2004) shows that odd lot trading accounted for as much as 40 percent of the business of NYSE members by 1921. She also provides historical evidence that NYSE member firms often sold odd lots to retail customers at stale prices and that such trading was a highly profitable business for NYSE members.
significant decline in stock prices, brokers might not be able to raise significant capital to repay their margin loans to banks.
The New York Stock Exchange immediately responded to the Consolidated’s decision to trade Big Board stocks. The NYSE implemented a series of measures in 1885 and 1886 to limit the Consolidated’s ability to gain market share. The NYSE passed a resolution mandating that 400 of its members drop their affiliation with the Consolidated (Mulherin, Netter, and Overdahl, 1991). In 1888, the New York Stock Exchange even suspended one of its members for conducting business with the rival exchange, although this measure did not eliminate trading between the two rivals as some brokers continued to conduct business and arbitrage price differences on the two exchanges. The New York Times often printed articles that discussed various aspects of competition between the two exchanges. In a February 27, 1891 article “A Wall Street Quarantine,” the newspaper reported that the NYSE passed a resolution to limit competition from the Consolidated.
“After a lull, the old battle between the Stock Exchange and its youthful neighbor on the other side of New Street has broken out again... At the meeting of its Governors Tuesday a resolution was passed which was not made public until yesterday. It is a stringent order, and it reads in this way: Resolved, That all communications between this Exchange and the Consolidated Stock and Petroleum Exchange, or any part of the building thereof, by means of messengers or clerks, or in any other manner, directly or indirectly, is detrimental to the interests and welfare of this Exchange, and is hereby prohibited.”
The NYSE also established an unlisted department that traded only “speculative” stocks listed on the Consolidated. Although this measure primarily covered mining and other less important securities, it signaled the NYSE’s intention to limit competition from the rival exchange.
The Big Board also challenged the Consolidated’s use of its ticker. The rival exchange purchased ticker service from the Commercial Telegram Company, one of two firms --the second firm was the Gold and Stock Telegraph Company-- the NYSE contracted to collect and disseminate stock quotes. This set off a 15-year court war between the two exchanges. The NYSE maintained that it owned the property rights to the price quotes, while the Consolidated believed
that price quotes were public property. Although the courts ruled in 1887 that stock quotes were private property, they also ruled that the NYSE did not own the price quotes as long as they hired firms to collect and disseminate the quotes. Since the Commercial Telegram Company did not answer the NYSE’s complaint, the courts also granted the firm an injunction that prevented the NYSE from removing the ticker from the floor of the Consolidated. Court rulings prompted the NYSE to change its operating procedures and to alter the nature of its long-term contracts with firms that provided ticker service. In 1892, the NYSE began to collect stock quotes and transmit stock quotes to the Gold and Stock Telegraph Company. The telegraph firm then supplied price quotes to NYSE customers. The NYSE also removed tickers from members that gave nonmembers access to the price quotes. The courts established that the NYSE owned the price quotes in 1899 when they ruled that the Big Board could remove its ticker from the office of a Consolidated broker (Mulherin, Netter, and Overdahl, 1991).3 Although the courts ruled that the NYSE could remove tickers from the offices of Consolidated brokers or other individuals they chose not to do business with, the rival exchange continued to have access to the NYSE ticker through the court injunction granted in 1887.
2. The Magnitude and Nature of the Stock Market Rivalry
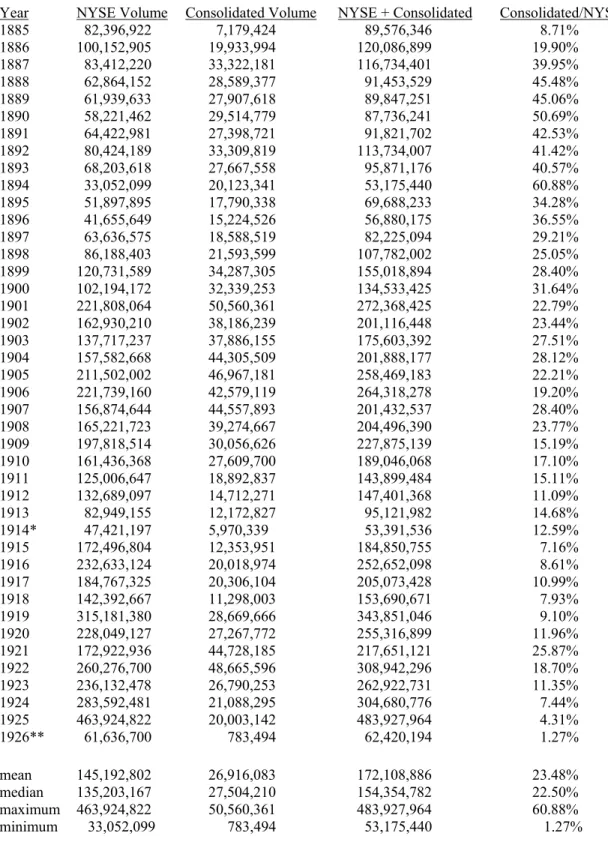
The rivalry between the Consolidated and the NYSE lasted from 1885 to 1926. Table 3 provides estimates of the magnitude of the 42-year rivalry between the NYSE and the Consolidated Stock Exchange from 1885-1926. We report the annual volume of common stock on the NYSE, the annual volume of NYSE-listed stocks on the Consolidated, and the ratio of Consolidated volume to NYSE volume. (See the Data Appendix for data sources.) The data show that the Consolidated quickly gained a significant share of the trading volume of NYSE-listed securities. In the first ten years of its existence, the ratio of Consolidated to NYSE volume
3
The Appendix of News articles provides a sketch of the ongoing competition. Nelson (1907), Garvy (1944) and Sobel (1972) provide historical treatments of the rivalry. Mulherin, Netter and Overdahl (1991) emphasize the legal disputes over property rights to NYSE price quotations.
averaged 40 percent. By 1894, the Consolidated traded as much as 60 percent of NYSE volume.4 Over the course of the stock exchange rivalry, the Consolidated averaged 23.48 percent of NYSE volume. As late as 1921, the ratio of Consolidated to NYSE volume was 25.87 percent.
The rivalry ended in February 1926 with the demise of the Consolidated. Garvy (1944) and Sobel (1972) point to accusations of fraud and the prosecution of the Consolidated by the Attorney General of the State of New York under the auspices of the Martin Act of 1921.5 William Silkworth, President of the Consolidated Stock Exchange in the early 1920s, allegedly misused a rescue fund in early 1922 for his own personal gain after asking member firms of the exchange to contribute to the fund. A few months later, one of the Consolidated’s leading and most respected brokerage houses, Edward M. Fuller & Company declared bankruptcy. Silkworth was accused of embezzling funds from the brokerage house even though he denied any wrong-doing. Although Silkworth was subsequently exonerated of the charges, a Fuller executive pleaded guilty to fraud. The Consolidated continued to trade securities after the scandals and even introduced reforms to eliminate corruption on the exchange.6 However, the historical evidence suggests that the reputation of the exchange had been irreparably damaged. News reports at the time (see the Appendix of News Articles) indicate that attempts to revive the rival exchange ended with the revelation that the Consolidated did not possess the right to the tickers
4
The data collected from The New York Times contain total volume for listed and unlisted securities but the NYSE only reports data for listed securities. As a result, our total volume data for the NYSE undercounts total volume for the period between 1888 and 1910 for the NYSE, when the NYSE closed its unlisted securities department. The total volume of unlisted securities is relatively small with the exception of American Sugar, which was a component of the Dow Industrial Average. We have NYSE volume data for American Sugar for the last day of the month from April 1894 until 1926. These data suggest that Table 3 may overstate the Consolidated’s total volume relative to the NYSE by three percent to eight percent from 1893 to 1902 when American Sugar was among the most actively traded securities on both exchanges. This discrepancy does not affect our formal analyses which are conducted on individual securities where we have the actual data from both exchanges.
5
The Martin Act has recently been used by Eliot Spitzer to indict Wall Street brokers and executives in the recent wave of corporate scandals.
6
Ott (2004) shows that politics played an important role in the collapse of the Consolidated. She argues that the NYSE engaged in a public relations campaign from 1913 until 1929 and captured the New York State Attorney General’s Office which investigated the Consolidated for stock fraud and wash sales. Ott concludes that a public relations campaign by the NYSE was quite successful and that the Big Board managed to avoid significant federal and state regulation until the New Deal.
transmitting NYSE price quotes in early 1927. Doede (1967) also notes that the emergence of the New York Curb Exchange in the early twentieth century (later the American Stock Exchange), which adopted a more amicable and non-competitive relation with the NYSE, also led to a weakening of the Consolidated’s position after 1909.
Table 4 presents some information on the nature of the 42-year stock market rivalry between the NYSE and the Consolidated. We collected trading data from a single day for each year between 1885 and 1926. Table 4 reports data on the number of NYSE firms listed, the number of NYSE firms with positive trading volume, and the number of NYSE-listed firms with trading volume on the Consolidated. (See the Data Appendix for specific dates and sources.) As reported in Table 4, the Consolidated tended to trade only a subset of NYSE listings on a given day. From 1885 to 1926, the Consolidated traded a median of 18 percent of NYSE listings. The median fraction of NYSE listings with volume that also traded on the Consolidated was 33 percent.
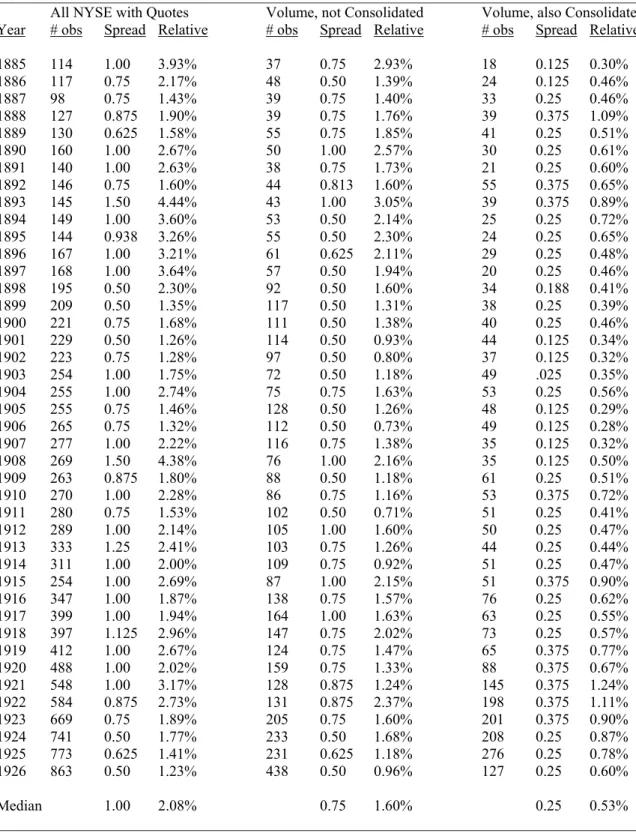
Table 5 provides evidence that the Consolidated tended to trade the relatively liquid NYSE listings. For a single day in each year between 1885 and 1926, the table reports the median bid-ask spread on the NYSE. While the median absolute (relative) bid-ask spread for all NYSE stocks with quotes averages $1.00 (2.08 percent) over the entire time period, the median absolute (relative) spread of the NYSE listings that also traded on the Consolidated averages $0.25 (0.53 percent). This is also lower than the average absolute (relative) spread of $0.75 (1.60 percent) for stocks with volume on the NYSE but not on the Consolidated. The tendency for a rival exchange to trade relatively more liquid NYSE listings resembles the results found from studies of modern-day markets (e.g., Easley, Kiefer and O’Hara (1996), Battalio (1997)).
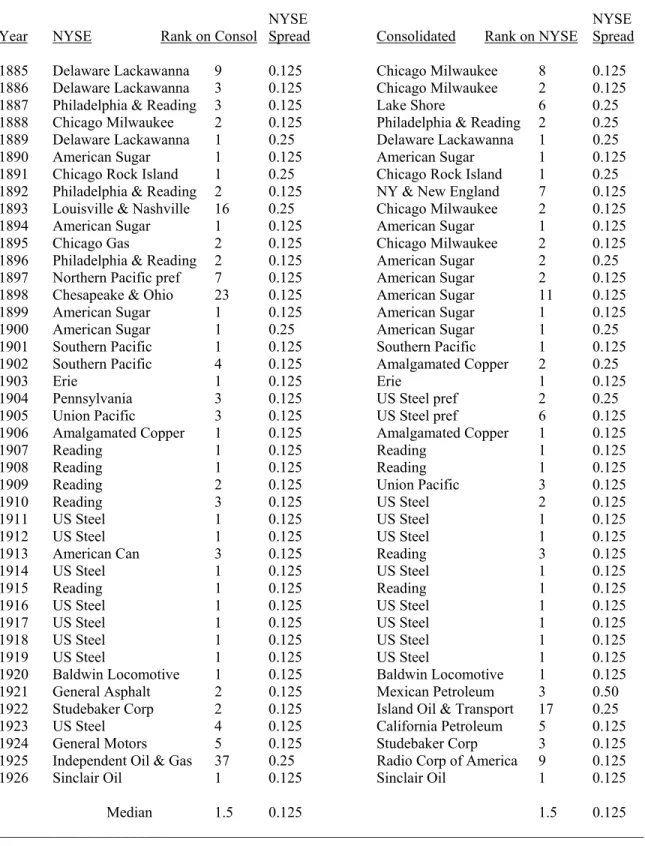
Table 6 provides additional evidence that the Consolidated tended to trade relatively liquid NYSE listings. For a single day in each of the sample years, the table reports the most heavily traded security on both the NYSE and the Consolidated. For 21 of the 42 years (50 percent of the time), the most heavily traded security on the NYSE was also the most heavily
traded on the Consolidated. In only five of the 42 years was the most heavily traded security on the NYSE not in the top five in trading on the Consolidated. The most heavily traded security on both exchanges tended to trade at the minimum bid-ask spread of one-eighth, providing further evidence that the Consolidated emphasized relatively liquid NYSE listings.
The fact that the Consolidated, like many current-day NYSE competitors, tended to trade relatively more liquid securities poses some complications in identifying the effect of competition on the NYSE. As noted in the initial research on bid-ask spreads by Demsetz (1968, p. 45), measures of competition are likely to be associated with the rate of transactions across securities. Similarly, Tinic (1972, p. 88) notes that any measure of inter-exchange competition might also proxy for long-run trading activity. Such concerns were certainly present in the early analysis of NYSE bid-ask spreads and exchange competition that tended to be cross-sectional studies over a short time interval.
To estimate the effect of stock market competition initiated by the Consolidated, we perform a series of complementary tests. We begin with a natural experiment in which we study the effect of the onset of competition on NYSE bid-ask spreads. This experiment implicitly treats the onset of the Consolidated as an exogenous event. Boehmer and Boehmer (2003) have a similar research design in their recent study of the NYSE entry into the market of Exchange Traded Funds (ETFs). We then perform a panel study of the effect of the Consolidated on NYSE bid-ask spreads over the entire 42-year rivalry of the two exchanges. Such analysis resembles Wahal’s (1997) recent work on the effects of dealer competition on NASDAQ and avoids the critique of the early studies of the NYSE that focused on short periods of time.
3. Empirical Evidence
A. The Onset of Stock Market Competition
Our empirical analysis of stock market competition begins with the Consolidated’s decision to trade NYSE stocks. This event provides a natural experiment to study the behavior of
bid-ask spreads in the period before and after the rival exchange directly competed with the NYSE. To investigate this question, we estimate a series of regressions using NYSE bid ask-spreads as the dependent variable for a one-year period before and after the initiation of trading in NYSE listings by the Consolidated in February 1885. The regression analysis controls for firm-specific factors such as trading volume, price level, and return volatility that prior studies have found to affect bid-ask spreads (Demsetz 1968, Tinic 1972, Branch and Freed, 1977). The basic model can be written as:
SPREADit= α0 + β1VOLit +β2CLOSEit+ β3STDEVi + β4COMPt + εit, (1)
where SPREADit is either the natural log of the absolute bid-ask spread or relative spread
[(bid+ask)/(bid+ask/2)] for security i on day t. The volume and closing price variables, VOLit and
CLOSEit, are measured as the natural log of the NYSE daily volume and closing price for security
i on day t. Volatility, STDEVi, is defined as the standard deviation of the natural log of security
i’s return over the entire sample period. To determine the effect of stock market competition, COMPt is a dummy variable that takes the value of one in the period beginning with the initiation
of trading of NYSE listed stocks by the Consolidated on February 17, 1885. The white noise error term is given by εit. Bid-ask spreads for the empirical analysis are collected from The New York
Times. The newspaper also reported trading volume, but not information on bid-ask spreads for the Consolidated. Silber (2005) reports a similar non-reporting of data on NYSE competitors by major financial newspapers in his analysis of the closure of stock markets from the end of July to December 1914 following the outbreak of World War I.
The time period for the analysis is 60 weeks before and 60 weeks after the onset of Consolidated competition. This time interval is determined in part by data availability. As noted in the Data Appendix, our firm-level data on volume and bid-ask spreads come from The New York Times. The newspaper temporarily discontinued reporting NYSE bid-ask spreads in
mid-April 1886. To have a continuous database, we use the interval from February 17, 1885, to mid-April 9, 1886, for the Consolidated period. We use a comparable interval prior to the onset of off-exchange trading of NYSE listings as our pre-Consolidated time period.
We sampled data from Friday trading in each of the 60 weeks before and the 60 weeks after the onset of competition by the Consolidated. If Friday was not a trading day, we sampled from an adjacent day. For each day, we collected data on the closing price, volume, and bid-ask spreads of all NYSE common stocks reported in The New York Times. Our analysis focuses on NYSE-listed firms with non-zero trading volume, although our results are robust to including NYSE firms with zero trading volume on a given business day.7 For the same time interval, we also collected control variables reflecting aggregate market conditions such as aggregate NYSE volume, the concentration of NYSE trading, and broker call rates.
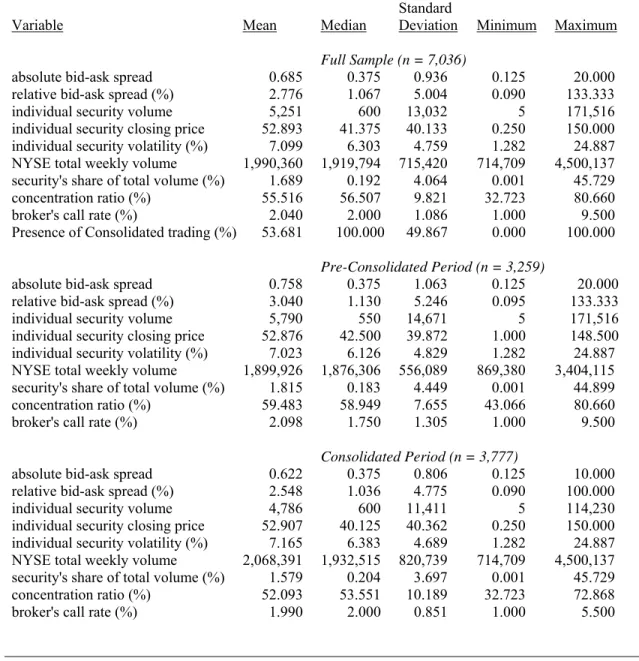
The first panel in Table 7 provides summary statistics for the pre- and Consolidated periods. The sample contains 7,036 observations. This includes all companies with at least 12 observations of reported trading volume and bid-ask spreads on the NYSE. The mean absolute bid-ask spread and relative bid-ask spread are 0.685 and 2.78 percent respectively. The individual daily security volume ranges from five shares to 171,516 shares and averages 5,251 shares. The mean closing price is $52.89. The standard deviation of returns for the average security is 7.10 percent per week over the sample period. The number of observations that occur in the Consolidated period accounts for 53.4 percent of the total observations.
Table 7 also reports summary data on the control variables that we use in our robustness analysis. The mean aggregate weekly trading volume for all securities on the NYSE during the week is 1,990,360 shares. The mean share of total volume was 1.69 percent for securities with NYSE volume and the average concentration ratio for the four highest volume NYSE securities is 55.5 percent, indicating that NYSE volume was highly concentrated among the most active
7
securities over the sample period. The concentration of trading in securities markets has been noted in modern day markets by Easley, Kiefer, O’Hara and Paperman (1996).
The second and third panels in Table 7 separately report the data for the pre- and Consolidated periods. The data suggest an average decline in both absolute and relative bid-ask spreads. For the remaining firm specific and market-wide variables, there does not appear to be a discernible trend or pattern in the data. For example, the average of individual NYSE security volume declines while the average NYSE stock price is relatively flat. The average of NYSE total weekly volume rises while the average broker call rate falls. In addition, we have examined the distribution of the spreads across the two periods. There appears to be a shift in the entire distribution toward lower spreads and not a change in clustering around the odd eighths (e.g. Christie and Schultz (1994)). For example, the proportion of spreads that is at $0.5 or less increases from 65.8 percent of the sample in the pre-period to 70.3 percent in the post-period.
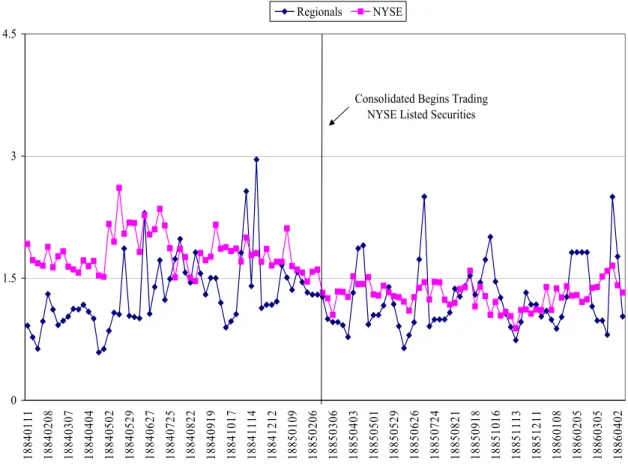
Figure 1 graphs the average weekly bid-ask spread over the sample period for the NYSE and a group of the leading regional exchanges (Baltimore, Boston and Philadelphia).8 The graph is suggestive in two important ways. First, the decline in bid-ask spread is not part of a larger trend of lower bid-ask spreads on the NYSE but is specific to the post-Consolidated period. Secondly, the lower bid-ask spread seems to be confined to the NYSE and not the regional exchanges. It is important to note that while the regional exchanges did trade some NYSE listed securities at this time, the majority of stocks trading on these exchanges were not listed on the Big Board and did not face direct competition from the Consolidated.
8
The Commercial and Financial Chronicle reported bid-ask spreads for some stocks on the regional exchanges that did not have trading volume for that particular day. For consistency, the average bid-ask spread for the NYSE is the average for all securities and includes some stocks that did not have any trading volume so the data in this figure are not directly comparable to those in later tables. For a couple of weeks when The Commercial and Financial Chronicle did not report bid-ask spreads for the regional markets, we interpolated the average bid-ask spread using the week before and after the missing observations. The Boston Exchange accounts for over 90 percent of the observations in Figure 1. For our formal analysis, we are forced to focus on the Boston Exchange due to the lack of sufficient observations with trading volume on the other regional exchanges.
In addition, we present summary statistics in Table 8 for securities with volume on the NYSE. The descriptive statistics are broken down into two groups: stocks traded by the Consolidated and securities not traded by the rival exchange. For the entire sample period, companies that the Consolidated traded accounted for 4,823 out of the 7,036 observations or 68.5 percent of the sample. However, the average volume of securities traded by the Consolidated was over 17 times higher than the NYSE listings that they did not trade. The companies that the Consolidated traded accounted for over 97 percent of the total trading volume over the full sample period. In addition to having lower volumes and lower bid-ask spreads in both the full period and the pre-Consolidated securities, the securities traded by the Consolidated tended to have lower average closing prices and higher volatility.
If we examine the change from the pre-Consolidated period to the Consolidated period for each group, then it is clear that the bid-ask spreads and relative bid-ask spreads fall for each group. The decline in spreads for the group with Consolidated trading is consistent with competition and the decline in the group without Consolidated trading is consistent with potential competition. On the other hand, the mean bid-ask spread for the regional exchanges did not experience a similar decline with the onset of stock market competition between the two New York exchanges. In addition, the group with Consolidated trading experienced a decline in the average NYSE volume of almost 15 percent (8,102 shares vs. 6,883 shares) while the volume for those without Consolidated trading increased by 25 percent in the period of competition (382 shares vs. 478 shares). Table 9 reports the results for the estimation of our basic model over the pre- and Consolidated period. We report four specifications that examine the determinants of the absolute and relative bid-ask spreads that omit and include company fixed effects. Column A of Table 9 reports the model with the absolute bid-ask spread as the dependent variable. The results indicate that the absolute spread is positively related to the closing price, negatively related to individual security volume, and positively related to the standard deviation of returns. All coefficients are significant at the one percent level of significance.
The dummy variable for the presence of Consolidated trading indicates that absolute spreads are negatively related to the onset of competition from the Consolidated exchange. The coefficient on the Consolidated dummy is also significant at the one percent level. The results suggest that the bid-ask spreads were approximately 11.6 (e-.123-1) percent lower in the Consolidated period.
In Column B of Table 9, we include company specific fixed effects to capture unobserved heterogeneity across firms. This necessitates excluding the standard deviation variable because it does not vary by observation across an individual security. The coefficients on security volume and the Consolidated dummy remain negative and significant at the one percent level and the coefficient estimate rises to 14.3 percent. The closing price is now negatively and significantly related to absolute spreads after controlling for fixed effects.
Column C of Table 9 reports the results using the relative spread as the dependent variable. Higher security volume, higher closing prices, and higher volatility are all negatively and significantly related to the relative spread. The presence of the Consolidated results in a reduction in relative spreads of approximately 11.3 (e-.120-1) percent. We obtain similar results when we control for company specific fixed effects in Column D.
The ideal test of the effects of the Consolidated would be to have a control group of actively traded securities on the NYSE that had some prohibition on Consolidated trading. Without such a control group, we estimate models similar to those presented in Table 9 for the Boston Stock Exchange in order to determine whether or not the results are driven by overall changes in equity markets during this time period. The Boston Stock Exchange serves the purpose as a quasi-control group because it predominantly traded different stocks in the same industry --railroad and telephone stocks-- that did not trade on the Big Board. Moreover, the New York financial press regularly printed a list of stock prices on the Boston Stock Exchange. The regional exchange therefore provides a test of whether a railroad or telephone specific shock can account for the statistically significant decline in NYSE bid-ask spreads with the Consolidated’s
decision to trade NYSE listed stocks. The empirical results for Boston, presented in Table 9A, indicate a similar relationship between spreads and control variables. However, the dummy variable for the presence of Consolidated trading is never significantly different than zero. Although the coefficient for competition is negative for Boston, it is less than half the size of the competition coefficient for the NYSE. This suggests that the observed relationship between Consolidated trading and NYSE spreads was the result of competition.
While the analysis in Table 9 controls for individual security effects across the pre- and Consolidated time periods, it is possible that changes in overall market conditions rather than the existence of the Consolidated led to lower bid-ask spreads. We control for overall market conditions with several variables including aggregate NYSE volume, the concentration of trading volume, and the broker call rate. Our measure of aggregate volume, WVOLt, is NYSE weekly
volume for a given observation (the sum of total NYSE volume for the day included in the sample and the five previous days of trading). Davis, Neal and White (2005) find that higher total volume on the NYSE increases bid-ask spreads if the “Big Board” has reached its capacity constraint for trading stocks. We also include the concentration ratio of volume for the four highest volume firms, CONCt, to account for the fact that high volume securities have lower
bid-ask spreads – if trading becomes more concentrated in high volume securities, then bid-bid-ask spreads should fall. We also include the ratio of a security’s NYSE volume to total NYSE volume on that day, SHAREit, to control for the extent to which the Consolidated was trading only the
most active NYSE securities. Finally, we include the broker’s call rate as a measure of the cost of carrying an inventory of securities. The white noise error term is given by εit. The extended model
can be written as:
SPREADit = α0+ β1VOLit +β2CLOSEit+ β3STDEVi + β4COMPt + β5WVOLit + β6CALLt
+ β7SHAREit + β8CONCt + εit (2)
In Table 10 we report the results of estimating the model with the additional control variables. While each of these additional variables is generally significant in the regression, they
have little effect on the other variables or the overall fit of the model. The exception is the individual security volume measure. The individual security volume variable is no longer significantly different from zero because the variable is highly correlated with total NYSE volume.
In all the specifications reported in Table 10, the presence of competition from the Consolidated is associated with a reduction in absolute and relative spreads of approximately 13 percent. The Consolidated dummy is significant at the one percent level in the four different specifications. Moreover, the impact of the Consolidated on spreads is remarkably consistent across the specifications presented in Tables 9 and 10 and indicates that the introduction of the Consolidated is associated with a non-trivial reduction in bid-ask spreads on the NYSE. Table 10A reports an analysis of bid-ask spreads for the Boston Exchange using additional control variables. Again, we find that bid-ask spreads on the regional exchange did not significantly decline when the Consolidated Stock Exchange began to trade NYSE-listed stocks.
The baseline results are also consistent across a series of robustness checks not reported. We obtained similar findings when we included every security from The New York Times rather than focusing only on securities with positive NYSE volume on a given day. We also estimated the model after excluding securities that appeared only in the pre- or Consolidated period and have also restricted the sample to only those firms that consistently traded in both periods, something akin to a matched panel. The results are unaffected by these changes. The results are also robust to excluding securities with closing prices of $1 or less and $5 or less. Finally, we obtain similar results if we exclude securities trading at the binding spread of one-eighth.
B. The Effects of Long-Run Competition
As a complement to the short-run analysis, we also study the long-run effect of competition on NYSE bid-ask spreads. We estimate a panel regression of NYSE bid-ask spreads on variables proxying for competition from the Consolidated, firm-specific variables that affect
spreads, and other variables that control for market conditions over time. The New York Times’ brief lapse in reporting trading volume of NYSE stocks on the Consolidated from April through August 1886 limits our long-run analysis to the period September 1886 to February 1926. We sampled data from the last trading day of each month for the analysis. We collected firm-specific information on bid-ask spreads, trading volume on the NYSE, and trading volume of NYSE stocks bought and sold on the Consolidated Stock Exchange (if any). We also collected data on NYSE total monthly volume and the closing monthly broker call rate as additional control variables for the empirical analysis.
We focus our analysis on the common stocks in the Dow Jones Indices. We use the original Dow Jones Index with 12 stocks from September 1886 until October 1896, when the index is divided into the 20 stock Dow Jones Railroad Index and the 12 stock Industrial Index. We collected data from The New York Times for each security in the index at a given point in time and rely on Farrell (1972) for changes in the composition of the indices.
We employ the same empirical analysis used in Section 2 where the natural log of the absolute or relative spread is a function of a security’s volume, its closing price, individual security volatility and competition. The only difference in the specification is that we now employ two different measures for the competition variable. The first is an estimate of the Consolidated’s fraction of the volume of trading in a given NYSE listing, defined as [Consolidated Volume/(NYSE Volume + Consolidated Volume)]. Since this variable is measured in logs, we replace all zeros with a small positive value before taking the natural log for the observations where the Consolidated’s share is zero. The basic tenor of the results remains unchanged by including shares with a zero value. The second measure of competition is a dummy variable that takes a value of one if a security traded on the Consolidated on a given day. The two measures of competition have a pair wise correlation of 0.95, so we do not use them in the same regression.
Table 11 reports the summary statistics for the data used in the analysis of the effects of the Consolidated over time. The absolute bid-ask spread averages 0.414 and the relative bid-ask spread averages 0.627 percent. These bid-ask spread values are lower than those reported for all NYSE stocks in Table 5, which reflects the fact that the firms in the Dow Jones Indices are relatively liquid. Individual daily security volume on the NYSE averages 10,626 shares, the closing price averages $88.239, and individual security return volatility over the entire sample period averages 11.348.
The Consolidated’s share of total volume per security averages 11.21 percent, but ranges from zero to 99.5 percent. For the dataset of firms from the Dow Jones Index, the Consolidated traded in an average of 74.8 percent of the sample on a given day. Table 11 also reports summary statistics on the control variables used in the analysis. NYSE total monthly volume averages 14.7 million shares. A security’s share of trading volume averages 3.742 percent and the concentration of trading in the four most heavily traded securities averages 63 percent. The broker’s call rate averages four percent.
Table 12 reports the estimates of the basic model of the effects of the Consolidated over time. The first two columns report the model with the absolute bid-ask spread as the dependent variable. The first column has the natural log of Consolidated share as the measure of competition, while the second column has the simple Consolidated dummy as the measure of competition. Both the Consolidated share variable and the dummy variable for the presence of any Consolidated trading are negatively and significantly related to bid-ask spreads at the one percent level. A one percent increase in the share of the Consolidated volume results in a 3.6 percent decline in the absolute and relative bid-ask spreads and the presence of Consolidated trading reduces the bid-ask spread by about 20 (e-.225-1) percent. The coefficients of volume, price level, and security volatility all have the expected signs and are significantly different from zero. The next two columns report the basic model with the relative bid-ask spread as the dependent variable. Again, the two measures of competition are negatively and significantly
related to bid-ask spreads on the NYSE. The coefficients of the other variables have the expected signs and are significantly different from zero.
Table 12 also presents the results when we control for security specific fixed effects and year effects. Here the variable for individual security volatility is omitted because it is estimated over the entire sample period for a given firm. The results are generally robust to changing the specification of the model with the Consolidated share variable producing a 2.8 percent to 3.0 percent reduction in spreads and the presence of Consolidated trading producing a decline in spreads of approximately 15 (e-.163 -1) percent.
We also estimate the extended model --given in equation (2)-- that incorporates additional control variables to capture general market conditions. Table 13 presents the empirical results using the additional control variables with and without fixed effects. The competition variables always have a negative and statistically significant effect on spreads. Hence, both the presence and magnitude of competition by the Consolidated is associated with narrower bid-ask spreads on the NYSE over time.
As a complement to our long-run analysis, we also conducted an “event study” analysis of the effects of the initiation of trading by the Consolidated in a particular stock. To conduct this test, we searched for securities from our sample of Dow Index stocks that had distinct trading on the NYSE before also trading on the Consolidated. We then estimated the change in bid-ask spreads of the securities after the initiation of trading by the Consolidated. Unfortunately, most stocks that were in the Dow Indices tended to have heavy trading on both the NYSE and the Consolidated during the course of our sample period.
We identified four securities that fit our criterion: AT&T, Colorado Fuel & Iron, and the Texas Company. We use these four stocks and estimate our baseline model where the dummy variable for the Consolidated is equal to one after the Consolidated initiates trading. We find that the initiation of Consolidated trading is significantly related to a decline in spreads, which is consistent with our other analysis. However, the results only reflect a small sample of stocks.
C. The End of the Consolidated
Another test of the effects of stock market competition is to examine how bid-ask spreads changed when the Consolidated ceased to be an important competitor. However, the gradual decline of the rival exchange --as opposed to an abrupt halt of trading on the Consolidated--makes it difficult to identify the effects of the removal of competition on bid-ask spreads. Nevertheless, we attempt to provide some insight into this question by using the resignation of William Silkworth, President of the Consolidated Stock Exchange, on June 25, 1923 as a key event that signaled the demise of the rival exchange. At this time, the New York State Attorney General also closed several brokerage houses affiliated with the Consolidated. The NYSE began considering measures to enforce its ownership of the price quotes by removing its tickers from the Consolidated. If we re-estimate the long-run models presented in Tables 12 and 13 and restrict the sample to the period after Silkworth resigns, the two competition variables are not statistically significant in the baseline or extended models. The results suggest that the Consolidated ceased to be a significant competitor after June 1923.9
The mean bid-ask spreads also increase from $0.41 to $0.45 in the post-Silkworth period with the fraction of absolute spreads at $0.5 or less decreasing from 83.7 percent of the sample to 77.9 percent of the sample. The data suggest that the rise in bid-ask spreads is of similar magnitude to the decline in spreads observed at the initiation of Consolidated trading. We also re-estimated the baseline and extended models over the 40-year panel, replacing our measures of competition with a dummy variable that takes the value of one after June 1923 and the value of zero for the earlier months. The results presented in Tables 14 indicate that bid-ask spreads increased after June 1923. The results for the baseline model indicate a positive and significant coefficient on the post-Silkworth dummy for both absolute and relative spreads. The coefficient on the end-of-competition variable in the models without company fixed effects is remarkably
9
similar in size --albeit with a different sign-- than we reported for the initiation of Consolidated trading. The results with fixed effects produce smaller relative coefficients, but still indicate that the demise of the Consolidated was accompanied by a statistically significant increase in bid-ask spreads.
The results are not as robust for the extended model. The coefficient estimates are statistically significant but the coefficient estimates are smaller when we do not control for company specific fixed effects. The results are positive but not statistically significant when we control for company specific factors. However, it is important to note that these results are achieved without a well defined end date for the Consolidated. As noted earlier, the Consolidated’s share of total volume was decreasing in the second half of the sample period and as such one would expect its end would produce smaller effects than its beginning. The fact that the onset of competition was associated with a large rise in the Consolidated’s market share while the demise of the exchange coincided with a gradual decline in market share makes finding any result at the end of the exchange less likely.
Overall, we interpret the empirical analysis as strong evidence that head-to-head competition between the Consolidated and the NYSE lowered bid-ask spreads on the Big Board. NYSE bid-ask spreads fell with the onset of competition and increased when the Consolidated ceased to be an important competitor. Moreover, the coefficients on the two competition variables in the 40-year panel models are quite consistent across the different specifications, suggesting that the analysis does not suffer from an omitted variable. For an omitted variable to explain the results, it would have to cause NYSE bid-ask spreads to suddenly fall in 1885, rise from 1923 until February 1926, and be uncorrelated with the two measures of competition in the 40-year panel model. This seems unlikely given the historical and empirical evidence.
D. Price Discovery
Beginning July 7, 1912, the Consolidated opened 30 minutes (9:30AM) before the NYSE. The Consolidated used a call market to establish opening prices in this period. The
practice of early opening continued until July 30, 1914, when both exchanges closed with the
outbreak of World War I. When the two rival exchanges reopened on December 12, 1914, the Consolidated apparently resumed trading at 10:00AM given that the financial press no longer reported trading activity on the rival exchange in the half hour before the start of NYSE trading. This two-year window provides an opportunity to test whether the Consolidated contributed to the price discovery process given that we lack detailed transaction level data to perform a more rigorous analysis. We employ a technique used by Silber (2006) to determine the extent to which opening prices on the Consolidated contained new information that would be incorporated into NYSE opening prices. Our variant of Silber’s model can be written as follows:
NYSEOPENit = α0 + β1NYSECLOSEit-1 + β2CONSOLIDATEDOPENit + εit (3).
Equation (3) tests whether opening prices on the Consolidated predict opening prices on the NYSE after controlling for closing prices on the Big Board from the previous day. We collected weekly data for Friday’s opening price and Thursday’s closing price for all stocks that traded on the Consolidated and the NYSE. Then we matched stocks with a Friday opening price on the NYSE, NYSEOPENit, with securities that had a Friday opening price on the Consolidated,
CONSOLIDATEDOPENit, and a Thursday closing price for the NYSE, NYSECLOSEit. The
estimated coefficients along with robust standard errors are presented below. The model was estimated with 3,604 observations.
NYSEOPENit = -0.006 + 0.304NYSECLOSEit-1 + 0.695CONSOLIDATEDOPENit
(0.006) (0.032) (0.032) R2 = 0.99
The slope coefficients are significant at the one percent level. The coefficient for the opening price of the Consolidated is more than two times larger than the coefficient on NYSE closing
prices for the previous day. This suggests that the Consolidated contributed to the price discovery process and was more than a free-riding exchange that traded off NYSE bid-ask quotes.
As a robustness check, we also estimate the model in returns where it is written as:
NYSERETURNit = α0 + β1CONSOLIDATEDRETURNit + εit (4)
where NYSERETURNit = log(NYSEOPENit) - log(NYSECLOSEit-1) and
CONSOLIDATEDRETURNit = log(CONSOLIDATEDOPENit) - log(NYSECLOSEit-1). The
estimated coefficients and standard errors are:
NYSERETURNit = -0.0003 + 0.277 CONSOLIDATEDRETURNit + εit
(0.001) (0.043) R2 = 0.123
The coefficient on the Consolidated return is significant at the 1 percent level. The point estimate on the Consolidated variable implies that the change between the NYSE closing price and the Consolidated opening price accounts for just over 50 percent of the total overnight return for a security on the NYSE. Again, this suggests that the Consolidated was capable of some form of price discovery. One concern with the results is that many stocks that traded on the NYSE also traded in London during the overnight period. If this were true, then opening stock prices on the Consolidated may just reflect information generated in the London market. To address this concern, we identified the securities that traded in London from The Economist and The Times. Excluding stocks that traded on the London market did not change the empirical results.10 Moreover, the analysis also indicates that approximately 5 percent of the securities that traded on the Consolidated did not trade on the London market or the NYSE on a given day. Although these
10
If we exclude the stocks that also traded in London, then the coefficient on the Consolidated in equation (3) drops to 0.611 and rises to .294 in equation (4). The coefficient estimates are still significant at the one percent level.
securities generally had trading volumes of less than 100 shares, it provides additional evidence that the Consolidated functioned as a primary market for some securities.
4. Summary and Conclusion
In this paper we study the magnitude, nature, and effects of the rivalry between the NYSE and the Consolidated Stock Exchange. The Consolidated competed directly with the NYSE for 42 years and garnered an annual market share as high as 60 percent of the Big Board’s listings. The Consolidated focused on the relatively more liquid NYSE listings as measured by bid-ask spreads and trading volume. Both the onset of competition by the Consolidated and the trading on the Consolidated over time are associated with narrower bid-ask spreads on the NYSE. This episode of a sustained, established rivalry with the NYSE suggests that historical perceptions about the NYSE should be revisited. The large market share obtained by the Consolidated over a lengthy period of time indicates that the NYSE has not been impervious to competition. This stands in marked contrast to conventional wisdom (e.g., Doede (1967)) that the NYSE was historically a natural monopoly. Similarly, a recent history of the NYSE states, “But for most of the New York Stock Exchange’s existence it has so dominated securities markets that it can be said to have faced no real competition.” (Blume, Siegel and Rottenberg (1993, p.25). Such perceived structural features of the NYSE should be reconsidered given the length and depth of the rivalry from the Consolidated.
The nature of the competition by the Consolidated also has important lessons for today’s securities markets. Consistent with modern day competitors, the Consolidated focused its rivalry on the relatively more liquid listings of the NYSE (, e.g., Easley, Kiefer and O’Hara (1996), Battalio (1997).) We also find that the NYSE responded to competition by narrowing its bid-ask spreads. Our estimates indicate that the onset of head-to-head competition was associated with more than a 10 percent reduction in NYSE bid-ask spreads while bid-ask spreads for our quasi-control group of stocks on the Boston Stock Exchange did not significantly change. The effect
persisted for the duration of the 42-year rivalry between the two exchanges until a series of scandals and investigations by the New York State Attorney General’s Office led to the demise of the Consolidated. The results also suggest that the Consolidated may have improved the efficiency of stock prices by contributing to the price discovery process.
A more general lesson from the Consolidated rivalry is the resiliency of the NYSE. The Big Board survived the onslaught of a significant competitor. The reaction to the Consolidated is but one of the many responses by the NYSE to changing conditions in securities markets over time. Banner (1998) discusses the early success of the NYSE. Garvy (1944) details how the NYSE facilitated a merger in the mid-19th century to maintain its competitive position. Jarrell (1984) describes the rise of institutional investors and the other forces at play in the removal of fixed brokerage commissions on the NYSE in the mid-1970s. The merger between Archipelago and the NYSE may prove to be one more example of the Big Board’s resiliency.
References
Arnold, Tom, Phillip Hersch, J. Harold Mulherin and Jeffry Netter, 1999, Merging Markets, Journal of Finance 54:3, 1083-1107.
Banner, Stuart, 1998, The origin of the New York Stock Exchange, Journal of Legal Studies 27:1, 113-140.
Barclay, Michael J., Terrence Hendershott and D. Timothy McCormick, 2003, Competition among Trading Venues: Information and Trading on Electronic Communication Networks, Journal of Finance 58:6, 2637-2665.
Battalio, Robert H., 1997, Third market broker-dealers: cost competitors or cream skimmers?, Journal of Finance 52:1, 341-352.
Battalio, Robert H., Jason Greene and Robert Jennings, 1997, Do competing specialists and preferencing dealers affect market quality?, Review of Financial Studies10:4, 969-993. Blume, Marshall E., Jeremy J. Siegel and Dan Rottenberg, 1993, Revolution on Wall Street: The
rise and decline of the New York Stock Exchange, (New York: W W Norton & Co Inc). Boehmer, Beatrice and Ekkehart Boehmer, 2003, Trading your neighbor’s ETFs: Competition or fragmentation?, Journal of Banking and Finance 27:9, 1667-1703.
Branch, Ben and Walter Freed, 1977, Bid-asked spreads on the AMEX and the big board Journal of Finance 32:1, 159-163.
Chowdry, Bhagwan and Vikram Nanda, 1991, Multimarket trading and market liquidity, Review of Financial Studies 4:3, 483-511.
Christie, William G. and Paul H. Schultz, 1994, Why do NASDAQ Market Makers Avoid Eighth Quotes?, Journal of Finance 49:5, 1813-1840.
Consolidated Stock Exchange Annual Report, various years.
Davis, Lance, Larry Neal and Eugene White, 2005, “The Highest Price Ever: The Great NYSE Seat Sale of 1928-1929 and Capacity Constraint, Working Paper Rutgers University. Demsetz, Harold 1968, The cost of transacting, Quarterly Journal of Economics 82:1, 33-53. Doede, Robert William, 1967, The monopoly power of the New York Stock Exchange,
Unpublished Ph.D. dissertation, University of Chicago.
Easley, David, Nicholas M. Kiefer and Maureen O’Hara, 1996, Cream-Skimming or Profit-Sharing? The Curious Case of Purchased Order Flow, Journal of Finance 51:3, 811-833. Easley, David, Nicholas M. Kiefer, Maureen O’Hara and Joseph B. Paperman, 1996, Liquidity,
Information, and Infrequently Traded Stocks, Journal of Finance 51:4, 1405-1436. Farrell, Maurice L., 1972, The Dow Jones Averages, 1885-1970 (New York: Dow Jones Books).
Garbade, Kenneth D. and William L. Silber, 1978, Technology, communication and the performance of financial markets: 1840-1975, Journal of Finance 33:3, 819-832. Garvy, George, 1944, Rivals and Interlopers in the History of the New York Security Market,
Journal of Political Economy 52:2, 128-143.
Hamilton, James L., 1976, Competition, scale economies, and transaction cost in the stock market, Journal of Financial and Quantitative Analysis 11:5, 779-802.
Hamilton, James L., 1978, Marketplace organization and marketability: NASDAQ, the stock exchange, and the national market system, Journal of Finance 33:2, 487-503. Hamilton, James L., 1979, Marketplace fragmentation, competition, and the efficiency of the
stock exchange, 34:1 Journal of Finance 34:1, 171-187.
Hamilton, James L., 1987, Off-Board trading of NYSE-listed stocks: the effects of deregulation and the national market system, Journal of Finance 42:5, 1331- 1345.
Hasan, Iftekhar and Markku Malkamaki, 2001, Are expansions cost effective for stock exchanges? A global perspective, Journal of Banking and Finance 25:12, 2339-2366. Jarrell, Gregg A., 1984, Change at the exchange: The causes and effects of deregulation, Journal
of Law & Economics 27:3, 273-312.
Macey, Jonathan R. and Maureen O’Hara, 1999, Regulating Exchanges and Alternative Trading Systems: A Law and Economics Perspective, Journal of Legal Studies 28:1, 17-54. Michie, Ranald C., 1986, The London and New York stock exchanges, 1850-1914, Journal of Economic History 46:1, 171-187
Mulherin, J. Harold, Jeffry M. Netter and James A. Overdahl, 1991, Prices are property: the organization of financial exchanges from a transaction cost perspective, Journal of Law and Economics 34:2, 591-644.
Nelson, Samuel A., 1907, The Consolidated Stock Exchange of New York: Its history, organization, machinery, and methods. Reprinted in Wall Street and the Security Markets, Vincent Carooso and Robert Sobel (eds.), (New York: Arno Press, 1975). Ott, Julia, 2004, The “Free and Open” “People’s Market”: Public Relations at the New York
Stock Exchange, 1913-1929. Business and Economic History 2, 1-43.
Pirrong, Craig, 2001, Third markets and the second best, Working Paper, University of Houston. Ramos, Sofia B., 2003, Competition between Stock Exchanges: A Survey, working paper,
HEC-University of Lausanne.
Rust, John and George Hall, 2003, Middlemen versus market makers: a theory of competitive exchange, Journal of Political Economy 111:2, 352-403.
Silber, William, 2005, What happened to liquidity when World War I shut the NYSE? Journal of Financial Economics 78:3, 685-701.
Sobel, Robert, 1972, AMEX: A history of the American Stock Exchange 1921-1971 (New York: Weybright and Talley).
Stigler, George J., 1961, The Economics of Information, Journal of Political Economy 69:3, 225.
Stigler, George J., 1964, Public Regulation of the Securities Markets, Journal of Business 37:2, 117-142.
Tinic, Seha M., 1972, The economics of liquidity services, Quarterly Journal of Economics 86:1, 79-93.
Tinic, Seha M. and Richard R. West, 1972, Competition and the pricing of dealer service in the over-the-counter stock market, Journal of Financial and Quantitative Analysis 7:3, 1727.
Wahal, Sunil, 1997, Entry, exit, market makers, and the bid-ask spread, Review of Financial Studies 10:3, 871-901.
Data Appendix
In this Appendix, we describe the sources for and the availability of the main variables in our analysis: Aggregate New York Stock Exchange trading volume, aggregate Consolidated Stock Exchange trading volume, average New York Stock Exchange bid-ask spreads, as well as firm-specific data on NYSE bid-ask spreads, NYSE volume, and the volume on the Consolidated Stock Exchange of NYSE listings.
Aggregate New York Stock Exchange Trading Volume
Aggregate trading volume for the New York Stock Exchange comes from two sources, the New York Times and the website of the NYSE. For the years 1875 through 1887, the data are hand collected on a daily basis from the New York Times. For 1888 to 1926, the data are taken from the website of the NYSE. The data for 1926 are for January and February only. The only interruption in the data is the period from July 31, 1914, through December 11, 1914, when the NYSE closed during World War 1.
Aggregate Consolidated Stock Exchange Trading Volume
Data on aggregate trading volume for the Consolidated Stock Exchange are hand collected from the New York Times. The data begin on February 17, 1885, when the New York Times separately reports NYSE-listed stocks within the volume for the New York Mining Exchange. As of Monday March 9, 1885, the New York Times reports the sales of NYSE-listed stocks under the name of the Consolidated Petroleum Exchange Board. For a brief time in 1886, the New York Times does not report the trading of NYSE-listed stocks on the Consolidated Exchange. The lapse in reporting occurs between April 15, 1886 and September 4, 1886. The last day the New York Times reports trading volume for the Consolidated Stock Exchange is February 16, 1926.
Bid-ask spread data for the New York Stock Exchange are taken primarily from the New York Times. The Commercial and Financial Chronicle serves as a secondary source for certain years when the New York Times did not report bid-ask spreads.
Our analysis of NYSE bid-ask spreads reports average estimates for a single day for the years 1875 to 1926. The date chosen for analysis tended to be at the end of January or the beginning of February of a given year, although there were some exceptions based on data availability. Appendix Table A sketches the dates and sources for this data. For 1875 to 1881, the New York Times reports bid-ask spreads for Saturday trading on the following Monday. These data on spreads are matched with the data for Saturday trading volume that is reported in the Sunday New York Times.
Beginning on May 24, 1882, the New York Times reports NYSE bid-ask spreads on a daily basis. The data on daily bid-ask spreads continue through April 14, 1886. Between April 15, 1886, and May 12, 1893, the New York Times does not report bid-ask spreads for the NYSE. In this time interval, we gather bid-ask spread data from the Commercial and Financial Chronicle. The bid-ask spread data are reported for Thursday trading and are matched with the appropriate trading volume data from the New York Times.
On May 13, 1893, the New York Times resumes reporting of NYSE bid-ask spreads on a daily basis. These data are used through February 1926.
Firm-Specific Data
We also employ firm specific data on NYSE bid-ask spreads, NYSE volume, and the volume of NYSE-listings on the Consolidated Stock Exchange. The data are taken from the New York Times.
Appendix Table A. Overview of Average Bid-Ask Spread Data
Year Calendar Date Day of Week Data Source 1875 January 23 Saturday New York Times 1876 January 22 Saturday New York Times 1877 January 27 Saturday New York Times 1878 January 26 Saturday New York Times 1879 February l Saturday New York Times 1880 February 2 Saturday New York Times 1881 January 29 Saturday New York Times
1882 May 26 Friday New York Times
1883 January 26 Friday New York Times 1884 January 18 Friday New York Times 1885 March 31 Tuesday New York Times 1886 January 29 Friday New York Times
1887 February 3 Thursday Commercial and Financial Chronicle 1888 February 2 Thursday Commercial and Financial Chronicle 1889 February 14 Thursday Commercial and Financial Chronicle 1890 February 13 Thursday Commercial and Financial Chronicle 1891 February 19 Thursday Commercial and Financial Chronicle 1892 February 18 Thursday Commercial and Financial Chronicle 1893 June 30 Thursday New York Times
1894 January 31 Wednesday New York Times 1895 January 31 Thursday New York Times 1896 January 31 Friday New York Times 1897 January 29 Friday New York Times 1898 January 31 Monday New York Times 1899 January 31 Tuesday New York Times 1900 January 31 Wednesday New York Times 1901 January 31 Thursday New York Times 1902 January 31 Friday New York Times 1903 January 30 Friday New York Times 1904 January 29 Friday New York Times 1905 January 31 Tuesday New York Times 1906 January 31 Wednesday New York Times 1907 January 31 Thursday New York Times 1908 January 31 Friday New York Times 1909 January 29 Friday New York Times 1910 January 31 Monday New York Times 1911 January 31 Tuesday New York Times 1912 January 31 Wednesday New York Times 1913 January 31 Friday New York Times 1914 January 30 Friday New York Times 1915 January 29 Friday New York Times 1916 January 31 Monday New York Times 1917 January 31 Wednesday New York Times 1918 January 31 Thursday New York Times 1919 January 31 Friday New York Times 1920 January 30 Friday New York Times 1921 January 31 Monday New York Times 1922 January 31 Tuesday New York Times 1923 January 31 Wednesday New York Times
1924 January 31 Thursday New York Times 1925 January 30 Friday New York Times 1926 January 29 Friday New York Times
Appendix of News Articles
This Appendix provides background from news articles on the New York Stock Exchange, the Consolidated Stock Exchange, and the rivalry between the two exchanges. The news articles are presented in chronological order.
"The Stock Brokers Latest Trouble," New York Times, December 11, 1877.
The recently established "bucket-shops," or blackboard exchanges, where stock gambling on margins from ½ percent upward and in sums as low as $5 is allowed, have increased so rapidly and have been doing so large a business as to cause great annoyance to the smaller class of brokers from the New York Stock Exchange, who