sex, BMI and FTO genotype
ABDELLA, Hanan M., EL FARSSI, Hameida O.El, BROOM, David
<http://orcid.org/0000-0002-0305-937X>, HADDEN, Dawn and DALTON,
Caroline <http://orcid.org/0000-0002-1404-873X>
Available from Sheffield Hallam University Research Archive (SHURA) at:
http://shura.shu.ac.uk/24102/
This document is the author deposited version. You are advised to consult the
publisher's version if you wish to cite from it.
Published version
ABDELLA, Hanan M., EL FARSSI, Hameida O.El, BROOM, David, HADDEN, Dawn
and DALTON, Caroline (2019). Eating behaviours and food cravings; influence of
age, sex, BMI and FTO genotype. Nutrients, 11 (2), p. 377.
Copyright and re-use policy
See
http://shura.shu.ac.uk/information.html
Sheffield Hallam University Research Archive
Article
Eating Behaviours and Food Cravings; Influence of
Age, Sex, BMI and
FTO
Genotype
Hanan M. Abdella1, Hameida O. El Farssi1, David R. Broom2 , Dawn A. Hadden1and Caroline F. Dalton1,*
1 Biomolecular Sciences Research Centre, Sheffield Hallam University, Sheffield S1 1WB, UK;
hanan.m.abdella@student.shu.ac.uk (H.M.A.); hameida.o.elfarssi@student.shu.ac.uk (H.O.E.F.); d.hadden@shu.ac.uk (D.A.H.)
2 Academy of Sport and Physical Activity, Sheffield Hallam University, Sheffield S10 2BP, UK;
d.r.broom@shu.ac.uk
* Correspondence: c.f.dalton@shu.ac.uk; Tel.: +44-114-225-3695
Received: 23 November 2018; Accepted: 24 January 2019; Published: 12 February 2019
Abstract: Previous studies indicate that eating behaviours and food cravings are associated with increased BMI and obesity. However, the interaction between these behaviours and other variables such as age, sex, BMI and genetics is complex. This study aimed to investigate the relationships between eating behaviours and food cravings, and to examine the influence of age, sex, body mass index (BMI) and fat mass and obesity-associated (FTO) genotype on these relationships. A total of 475 participants (252 female, 223 male, BMI: 25.82±6.14 kg/m2, age: 30.65±14.20 years) completed
the revised 18-question version of the Three Factor Eating Questionnaire (TFEQ-R18) to assess cognitive restraint, uncontrolled eating and emotional eating, and the Food Cravings Inventory (FCI) to assess cravings for fatty food, sweet food, carbohydrates and fast food. DNA samples were genotyped for the rs9939609 polymorphism in the obesity-linked geneFTO. Questionnaire data was analysed for associations between the TFEQ-R18 and FCI subscales for the whole study group, and the group divided by sex, genotype and age (≤25 years versus >25 years). Finally, mediation analysis was used to explore the relationships between BMI, cognitive restraint and food cravings. FTO AA + AT genotype was associated with increased BMI, but not with differences in eating behavior scores or food craving scores; age was associatedwith increased BMI and decreases in food craving scores in which this effect was stronger in women compared to men. Increased cognitive restraint was associated with decreased food craving scores in the ≤25 years group. Mediation analysis demonstrated that in this group the association between BMI and reduced food cravings was mediated by cognitive restraint indicating that in this age group individualsuse cognitive restraint to control their food cravings. The positive correlation between age and BMI confirms previous results but the findings of this study show that age, sex,FTOgenotype and BMI have an influence on the relationships between eating behaviours and food cravings and that these variables interact.
Keywords: body mass index; cognitive restraint; eating behavior; emotional eating; food craving; uncontrolled eating; weight gain; weight loss
1. Introduction
Obesity is a global problem; worldwide 39% of adults are classified as being overweight and 13% as having obesity [1]. It is now recognised that the development of obesity is influenced by a complex interaction between genetics and psychological factors, such as eating behaviours and food cravings. Behaviours related to food intake which influence the frequency of eating, meal size, meal content, and attitude to meals are described as ‘eating behaviours’. Eating behaviours can influence the amount
of energy consumed by an individual thus predisposing to an increased risk of obesity [2]. The most commonly studied types of eating behaviours are uncontrolled eating (UE), emotional eating (EE), and cognitive restraint (CR). UE refers to a tendency to overeat, with the feeling of being out of control. EE reflects a propensity to overeat in response to negative emotions (i.e., when feeling lonely, anxious or depressed) [3]. CR refers to a tendency to consciously restrict food intake instead of using physiological cues (i.e., hunger and satiety) as regulators of intake [4]. Previous studies have shown an association of eating behaviours with weight gain and increasing body mass index (BMI) [5,6] which are directly related to food intake [5].
Food craving is defined as a strong, irresistible desire to consume a specific type of food [7], this desire is extremely common with some studies estimating it is experienced by more than 90% of the adult population [8,9]. Food cravings can be categorised by both appetitive and aversive components and can be prompted by certain emotional conditions, such as psychological or physical stress, anxiety, depression, anger, or psychological reactance to food [10,11]. Increased food cravings have been associated with increased BMI [5,12].
Fat mass (FM) and obesity-associatedFTOis the first obesity risk gene recognised by genome wide association studies (GWAS) and is the gene most strongly associated with an increase in BMI [13]. Single-nucleotide polymorphisms (SNPs) that cluster in the first intron of theFTOgene show the strongest association with BMI (∼0.35 kg/m2 per allele), and obesity risk [14,15]. FTO is highly expressed in the hypothalamus, a region involved in the regulation of food intake and energy expenditure [16,17]. Previous studies have stated that the BMI-increasing allele A of theFTOvariant is associated with higher energy intake and higher fat and carbohydrates intake compared to TT homozygotes [18,19]
An influence ofFTOon eating behaviours has been shown, although the results are contradictory. Habron et al., suggest that theFTOrisk allele was associated with differences in eating behaviours in adults with overweight or obesity [20] and similar findings have been shown in normal weight controls [21]. In contrast, in a group of adolescents and children,FTOgenotype was associated with BMI but did not influence eating behaviour [22]. TheFTOgene has been reported to influence food cravings, with individuals carrying the obesity-susceptible A allele having higher total food cravings compared to TT homozygotes which correlates with higher BMI [23].
Sex and age also influence eating behaviours and food cravings. Previous studies highlight that females have higher scores for CR than males but report inconsistent sex effects for UE or EE [24–27]. Other studies found significant differences between sexes with females scoring higher on EE and CR but equal mean scores for UE [3,28,29]. Löffler et al. found that females scored significantly higher than males in all subscales of eating behaviours and also found individuals over 60 years old had significantly higher mean scores than people under 60 years for CR, but lower mean scores for UE and EE [30].
Aim
The aim of the current study is to investigate the interactions between eating behaviours, food cravings and BMI. Previous findings indicate that when considering the influence of eating behaviours and food cravings on obesity, it is important to take into account other variables that are known to also influence these measures including genetics, age and sex. It is also important consider which associations are mediated by other relevant variables. This study therefore (1) investigates the interactions between eating behaviours, food cravings and BMI (2) determines the influence ofFTO genotype, sex and age on these interactions and (3) uses mediation analysis to explore the role of these mediators in the interactions.
2. Materials and Methods
2.1. Study Participants
Participants were recruited through advertisements at Sheffield Hallam University, Sheffield, UK. The participants included students at the university, staff at the university and friends and family of students at the university. Ethical clearance for the study was granted by the Ethics Committee of the Biomolecular Research Centre, Sheffield Hallam University and all volunteers provided written informed consent before taking part in the study. To be included in the study participants needed to be≥18 years. People who were pregnant or breastfeeding, who had a history of serious psychiatric illness or were taking medication known to affect appetite or metabolism were excluded. A total of 475 participants (n= 252 F,n= 223 M), average BMI 25.82±6.14 kg/m2, average age 30.65±14.20, age range 18–81 were included in this study. 249 of the participants were aged 25 years or younger (≤25 years), with 226 participants aged over 25 years (>25 years). We were interested in studying eating behaviours at a stage in life before patterns had become fully established. We considered previous work which shows that life events such as co-habiting, marriage, securing a job and having children are associated with changes in eating patterns and weight gain [38–40]. We chose 25 years as the cut-off because for many in our study group up to this age would be prior to the aforementioned life events.
2.2. Anthropometry
Height was measured to the nearest 0.1 cm using a wall-mounted stadiometer (Seca, Hamburg, Germany). Participants stood barefoot with their heels together against a wooden back plate keeping their arms loosely by their side. The measurement was recorded when the head was in the Frankfort Plane i.e., a horizontal line between the lower orbits of the eyes and the external auditory meatus. Body mass was measured to the nearest 0.01 kg using a balance beam scale (Avery, Birmingham, UK). Participants wore light clothing, removed their shoes and jewelry and were told to remove anything from their pockets. BMI was calculated as the body mass in kilograms divided by the square of height in meters.
2.3. Eating Behaviours
on a 4-point response scale (definitely true: 4, mostly true: 3, mostly false: 2, definitely false: (1) and items scores are summated into subscale scores: CR, UE and EE. Previous studies have reported that TFEQ-R18 has adequate internal consistency reliability coefficients for the three subscales, as well as for the whole questionnaire (0.75–0.87) [3].
2.4. Food Cravings
Food cravings were measured using the Food Craving Inventory (FCI), a self-report measure that assesses general and specific food cravings [42]. The FCI is a valid and reliable measure of specific food cravings in a subjective manner within the previous month. The questionnaire consists of 28 items measuring the frequency of cravings for a specific food item on a scale of 0—never to 4—almost every day. The FCI has four subscales: (1) high fat foods (fried chicken, sausages, gravy, fried fish, bacon, steak, sausage rolls), (2) sweets (brownies, cookies, chocolate, doughnuts, cakes ice-cream, sweets, sponge cake), (3) carbohydrates (breads, pancakes, biscuits, sandwich bread rice, baked potato, pasta, cereal, danish pastry, crisps) and (4) fast food (hamburger, French fries, pizza). A total score for each subscale is calculated by the summation of each food item score for each participant. The FCI has demonstrated acceptable internal consistency reliability and test-retest reliability in adults [42]. The inventory shows adequate internal consistency (Cronbach’s a of 0.86 for the fats and sweets subscales, 0.84 for the starches/complex carbohydrates subscale, 0.76 for the fast-food subscale, and 0.93 for the inventory as a whole [42]. Further psychometric support for the FCI has been established in diverse community and clinical samples [43,44].
2.5. Genotyping
Buccal samples for genotyping were collected using Easicollect devices (GE Healthcare Life Sciences, Little Chalfont, UK). DNA was extracted from the FTA card contained in the device using a QIAamp DNA mini kit (QIAGEN, Manchester, UK) according to the manufacturer’s instructions. Genotyping was performed using Taqman SNP genotyping assays (Applied Biosystems, Life Technologies, Ltd., Paisley, UK).FTOgene, SNP ID: rs9939609 was investigated in this study.
2.6. Statistical Analysis
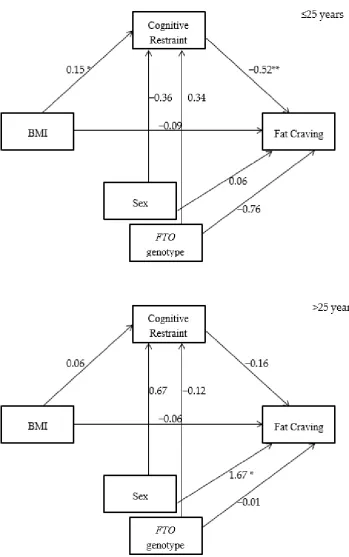
Statistical Package for the Social Sciences (SPSS software version 24, IBM) was used for the statistical analysis with significance accepted ifp< 0.05. Distribution of data was checked using the Kolmogorov–Smirnov Test and descriptive statistics were calculated. Pearson correlation was undertaken to explore association between variables including age, BMI, eating behaviours and food craving. T-tests were performed to assess gender and genotype differences in age, BMI, eating behaviours and food cravings. To explore relationships between variables mediation analysis with bootstrapping as recommended by Preacher and Hayes (2008) [45] was used; the SPSS macro provided by Hypotheses were tested in SPSS using PROCESS Model 59 [46], with using model 4,10,000 bootstrapped estimates and a 95 percent confidence interval. This model estimates a moderated indirect effect by evaluating the impact of the moderator on the indirect effect, as well as the predictive relationship to the direct effect. For the mediation model (Figures1and2), BMI was the independent variables, eating behaviours was the mediator variable, and food craving was the dependent variable. Age, sex andFTOgenotype were the covariates. For outcome data, effect sizes were calculated using Cohensd. Thresholds were set at 0.0–0.19 for a trivial effect, 0.2–0.49 for a small effect, 0.5–0.79 for a medium effect and≥0.8 for a large effect [47,48].
3. Results
Descriptive Statistics
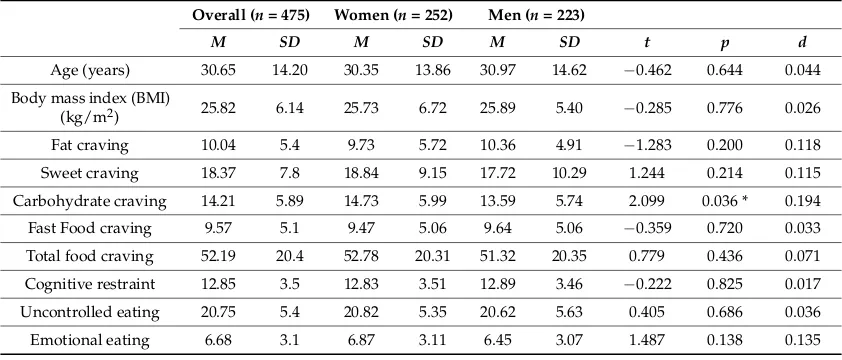
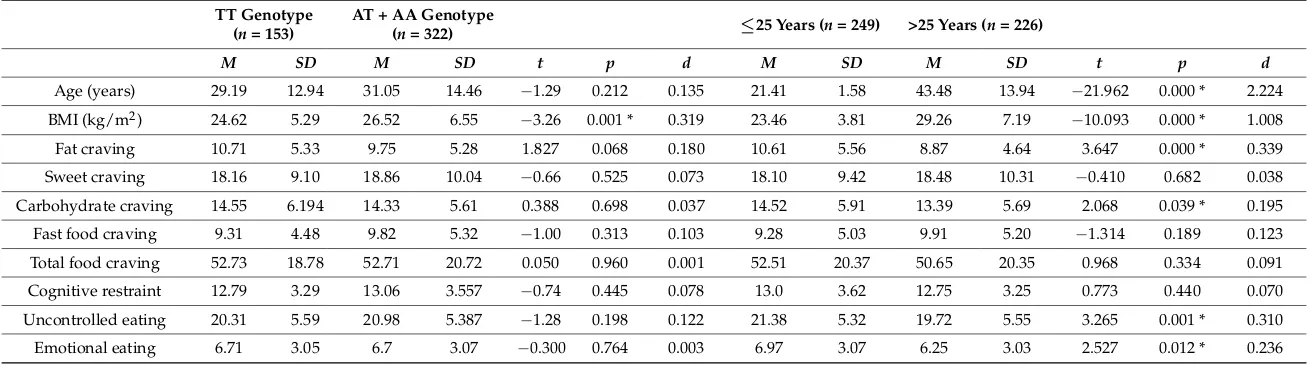
women but there was a significant difference between carriers of theFTOTT genotype compared to those with AT + AA genotype (24.62±5.29 versus 26.52±6.55 kg/m2,p= 0.001). Table1also shows the results of mean food craving scores; women had higher mean scores for carbohydrate cravings compared to men (14.73±5.99 versus 13.59±5.74,p= 0.036). There were no differences in eating behaviour scores between men and women and no difference in scores for food cravings or eating behaviours between the different genotypes. BMI was higher in the >25 years group, but craving for fat and carbohydrate were higher in the≤25 years group, as were scores for uncontrolled eating and emotional eating.
Table 1.Descriptive statistics for primary variables for the overall sample by sex.
Overall (n= 475) Women (n= 252) Men (n= 223)
M SD M SD M SD t p d
Age (years) 30.65 14.20 30.35 13.86 30.97 14.62 −0.462 0.644 0.044 Body mass index (BMI)
(kg/m2) 25.82 6.14 25.73 6.72 25.89 5.40 −0.285 0.776 0.026
Fat craving 10.04 5.4 9.73 5.72 10.36 4.91 −1.283 0.200 0.118 Sweet craving 18.37 7.8 18.84 9.15 17.72 10.29 1.244 0.214 0.115 Carbohydrate craving 14.21 5.89 14.73 5.99 13.59 5.74 2.099 0.036 * 0.194 Fast Food craving 9.57 5.1 9.47 5.06 9.64 5.06 −0.359 0.720 0.033 Total food craving 52.19 20.4 52.78 20.31 51.32 20.35 0.779 0.436 0.071 Cognitive restraint 12.85 3.5 12.83 3.51 12.89 3.46 −0.222 0.825 0.017 Uncontrolled eating 20.75 5.4 20.82 5.35 20.62 5.63 0.405 0.686 0.036 Emotional eating 6.68 3.1 6.87 3.11 6.45 3.07 1.487 0.138 0.135 All significance tests were two-tailed.M= mean score;SD= standard deviation;t=t-test;p=p-value;d= Cohen’sd. * Denotes a significant difference between women and men.
Table3shows that there is a positive relationship between age and BMI (r= 0.509 **) and an inverse relationship between age and fatty food cravings (r=−0.107 *), UE (r=−0.222 **) and EE (r=−0.184 *) for the whole sample. There is an inverse relationship between BMI and fatty food cravings (r=−0.180 **), and a positive relationship between BMI and CR (r= 0.128 **).
Table 2.Descriptive statistics for primary variables for the overall sample, by genotype and by age.
TT Genotype (n= 153)
AT + AA Genotype
(n= 322) ≤25 Years (n= 249) >25 Years (n= 226)
M SD M SD t p d M SD M SD t p d
Age (years) 29.19 12.94 31.05 14.46 −1.29 0.212 0.135 21.41 1.58 43.48 13.94 −21.962 0.000 * 2.224
BMI (kg/m2) 24.62 5.29 26.52 6.55 −3.26 0.001 * 0.319 23.46 3.81 29.26 7.19 −10.093 0.000 * 1.008
Fat craving 10.71 5.33 9.75 5.28 1.827 0.068 0.180 10.61 5.56 8.87 4.64 3.647 0.000 * 0.339
Sweet craving 18.16 9.10 18.86 10.04 −0.66 0.525 0.073 18.10 9.42 18.48 10.31 −0.410 0.682 0.038
Carbohydrate craving 14.55 6.194 14.33 5.61 0.388 0.698 0.037 14.52 5.91 13.39 5.69 2.068 0.039 * 0.195
Fast food craving 9.31 4.48 9.82 5.32 −1.00 0.313 0.103 9.28 5.03 9.91 5.20 −1.314 0.189 0.123
Total food craving 52.73 18.78 52.71 20.72 0.050 0.960 0.001 52.51 20.37 50.65 20.35 0.968 0.334 0.091
Cognitive restraint 12.79 3.29 13.06 3.557 −0.74 0.445 0.078 13.0 3.62 12.75 3.25 0.773 0.440 0.070
Uncontrolled eating 20.31 5.59 20.98 5.387 −1.28 0.198 0.122 21.38 5.32 19.72 5.55 3.265 0.001 * 0.310
Emotional eating 6.71 3.05 6.7 3.07 −0.300 0.764 0.003 6.97 3.07 6.25 3.03 2.527 0.012 * 0.236
Table 3.Correlation between age, BMI, eating behaviours and food cravings in the overall sample.
BMI Fatty Food Craving
Sweet Craving
Carbohydrate Craving
Fast Food Craving
Cognitive Restraint
Uncontrolled Eating
Emotional Eating
Age (years) 0.509 ** −0.110 * −0.041 −0.071 −0.037 −0.024 −0.222 ** −0.184 ** BMI (kg/m2) −0.180 ** −0.075 −0.078 0.026 0.128 ** 0.014 0.082
[image:8.595.87.510.204.275.2]Correlations of primary variables for overall population. All significance tests were two-tailed (*p< 0.05; **p< 0.01).
Table 4.Correlations between eating behaviours and food cravings in the overall sample.
Fatty Food Craving
Sweet Food Craving
Carbohydrate
Craving Fast Food Craving
Cognitive restraint −0.259 ** −0.138 ** 0.005 −0.167 **
Uncontrolled eating 0.000 0.059 0.164 ** 0.004
Emotional eating −0.197 ** −0.029 0.043 −0.125 **
Correlations of primary variables for overall population. All significance tests were two-tailed (**p< 0.01).
Tables5–7show the data dichotomised by sex (male and female), genotype (TT genotype and AA + AT genotype), and age (≤25 years and >25 years).
When exploring the differences between men and women, Table5shows that in women there is an inverse relationship between age and fat cravings (r= −0.157 *) and carbohydrate cravings (r=−0.195 **), in contrast to men where these relationships are not seen. In men there is an inverse relationship between BMI and CR (r= 0.210 **) in contrast to women where there is no relationship. In men there were also inverse relationships between CR, EE and fast food cravings which were not seen in women.
Table6shows thatFTOgenotype significantly affects the relationships between age, BMI, eating behaviours and food cravings. The decline in emotional eating with age was greater in the AA + AT genotype group; in addition the inverse relationship between BMI and fat craving was stronger in this group compared to the TT group.
Table 5.Correlation of Primary Variables by Sex.
Men
Women
Age BMI Fat Craving Sweet
Craving
Carbohydrate Craving
Fast Food Craving
Cognitive Restraint
Uncontrolled Eating
Emotional Eating
Age 0.544 ** −0.157 * −0.107 −0.195 ** −0.117 −0.073 −0.233 ** −0.140 *
BMI 0.473 ** −0.186 ** −0.102 −0.122 0.000 0.081 −0.028 0.122
Fat craving −0.050 −0.185 ** 0.494 ** 0.533 ** 0.525 ** −0.225 ** −0.097 −0.241 **
Sweet craving 0.020 −0.063 0.357 ** 0.330 ** 0.664 ** −0.121 0.020 −0.028
Carbohydrate craving 0.071 −0.016 0.418 ** 0.430 ** 0.331 ** 0.011 0.183 ** 0.038
Fast food craving 0.045 0.050 0.435 ** 0.686 ** 0.379 ** −0.117 −0.049 −0.083
Cognitive restraint 0.032 0.210 ** −0.301 ** −0.139 * 0.003 −0.156 * 0.303 ** 0.400 **
Uncontrolled eating −0.215 ** 0.059 0.113 0.078 0.140 * 0.047 0.173 ** 0.499 **
Emotional eating −0.232 ** 0.020 −0.144 * −0.055 0.033 −0.184 ** 0.376 ** 0.464 **
Correlations of primary variables among womenn= 252 presented above the diagonal, correlations of primary variables among menn= 223 are presented below the diagonal. All significance tests were two-tailed (*p< 0.05; **p< 0.01).
Table 6.Correlation of primary variable by genotype.
AA + AT
TT
Age BMI Fat Craving Sweet Craving
Carbohydrate Craving
Fast Food Craving
Cognitive Restraint
Uncontrolled Eating
Emotional Eating
Age 0.412 ** −0.082 0.014 −0.089 −0.021 −0.034 −0.215 * −0.144
BMI 0.548 * −0.078 −0.032 −0.077 0.076 0.154 −0.038 0.145
Fat craving −0.103 −0.206 ** 0.326 ** 0.497 ** 0.449 ** −0.283 ** 0.020 −0.154
Sweet craving −0.035 −0.098 0.465 ** 0.280 ** 0.599 ** −0.308 ** −0.068 −0.075
Carbohydrate craving −0.042 −0.083 0.451 ** 0.381 ** 0.304 ** −0.080 0.135 0.024
Fast food craving −0.024 0.016 0.501 ** 0.690 ** 0.333 ** −0.219 ** 0.063 −0.108
Cognitive restraint −0.020 0.101 −0.278 ** −0.114 * 0.001 −0.133 * 0.233 ** 0.445 **
Uncontrolled eating −0.220 ** 0.029 −0.046 0.065 0.147 ** −0.075 0.255 ** 0.442 **
Emotional eating −0.201 ** 0.053 −0.223 ** −0.050 0.011 −0.161 ** 0.354 ** 0.504 **
[image:9.842.95.750.330.493.2]Table 7.Correlation of primary variable by age.
>25 Years
≤25 Years
Age BMI Fat Craving Sweet
Craving
Carbohydrate Craving
Fast Food Craving
Cognitive Restraint
Uncontrolled Eating
Emotional Eating
Age 0.009 −0.050 −0.094 0.024 −0.095 0.032 0.103 0.038
BMI 0.322 ** −0.119 −0.058 −0.095 0.046 0.174 ** 0.022 0.185 **
Fat craving 0.059 −0.111 0.490 ** 0.430 ** 0.513 ** −0.326 ** −0.047 −0.314 **
Sweet craving −116 −0.127 0.365 ** 0.371 ** 0.710 ** −0.227 ** −0.004 −0.176 **
Carbohydrate craving 0.002 0.012 0.489 ** 0.397 ** 0.300 ** −0.032 0.133 * −0.045
Fast food craving −0.186 ** −0.045 0.512 ** 0.646 ** 0.428 ** −0.262 ** −0.059 −0.242 **
Cognitive restraint 0.005 0.127 −0.105 −0.003 0.102 0.044 0.264 ** 0.474 **
Uncontrolled eating −0.272 ** 0.143 −0.049 0.144 * 0.138 0.086 0.211 ** 0.405 **
Emotional eating −0.239 ** 0.127 −0.071 0.159 * 0.127 0.032 0.217 ** 0.565 **
Figure 1. CR mediates the relationship between body mass index (BMI) and cravings for fatty food in the 25 years group but not in the >25 years group (* p < 0.05; ** p < 0.01).
Figure 2. CR mediates the relationship between BMI and cravings for sweet food in the ≤25 years group but not in the >25 years group (* p < 0.05; ** p < 0.01).
4. Discussion
The aim of this study was to explore the relationships between eating behaviours and food cravings, and examine the influence of sex, BMI, age and FTO genotype on these relationships. We used the TFEQ-R18, FCI, and genotyped for the rs9939609 FTO polymorphism to study 475 individuals. We analysed data from this group split by sex, FTO genotype and age (≤25 years versus >25 years old). We then used mediation analysis to investigate possible mechanisms underlying the association between some of the relationships observed. The main findings are as follows.
Mean scores for the three subscales of the TFEQ-R18 and the four subscales of the FCI were similar to values previously reported. There were no differences between mean scores for BMI, eating behaviours or food cravings split by sex, with only cravings for carbohydrate being higher in women. This agrees with previous studies [28,49], but is in contrast with others which found higher scores for eating behavior subscales in women [30,50]. This difference may be due to the age of the groups
Figure 2.CR mediates the relationship between BMI and cravings for sweet food in the≤25 years group but not in the >25 years group (*p< 0.05; **p< 0.01).
4. Discussion
The aim of this study was to explore the relationships between eating behaviours and food cravings, and examine the influence of sex, BMI, age andFTOgenotype on these relationships. We used the TFEQ-R18, FCI, and genotyped for the rs9939609FTOpolymorphism to study 475 individuals. We analysed data from this group split by sex,FTOgenotype and age (≤25 years versus >25 years old). We then used mediation analysis to investigate possible mechanisms underlying the association between some of the relationships observed. The main findings are as follows.
for eating behavior subscales in women [30,50]. This difference may be due to the age of the groups studied; the average age of our group was 31 years, whereas the average age of the participants in these two studies was 50 and 48 years respectively indicating that sex differences in eating behaviours may become more apparent with increasing age. When the group was analysed by genotype the AA + AT group had a mean BMI of 26.52 kg/m2compared to the TT genotype group who had a mean BMI of 24.62 kg/m2, this is consistent with the findings of previous studies which also found that
carriers of the risk allele A had higher BMI scores compared to people with the TT genotype [13,51]. We did not find differences in TFEQ-R18 or FCI scores when the groups were split by genotype, which is in agreement with a recent study of children by Rivas et al. [52], which also did not find differences in subscale scores for the TFEQ-R18. This is in contrast to other findings which describe higher food cravings associated with the A allele in a group with an average age of 50 years [23]. These differences agree with our findings presented in Table6which demonstrate an influence ofFTOgenotype on age-related eating behaviours.
We report highly significant relationships between eating behaviours and food cravings, with BMI increasing with age, whilst cravings for fatty food decreased, and UE and EE decreased with age, in agreement with earlier studies [33–35]. The data presented in Table2also confirms this; when the two age groups were compared the scores for cravings for carbohydrates and fat, and the scores for emotional eating and uncontrolled eating were all higher in the≤25 years group compared to the >25 years group. This may reflect changes in eating patterns associated with stages of life; with younger people tending to consume less healthy food [53,54], it may also be due in part to age-related changes in taste sensitivity [36,37]. We also found that increased BMI was associated with a decrease in cravings for fatty foods but an increase in cognitive restraint, confirming previous results by Johnson et al. who also proposed that high cognitive restraint in normal weight individuals increases the risk of overeating tendencies when restraint is relaxed, thus leading to further increases in BMI [55]. We found highly significant relationships between eating behaviours and food cravings; increased cognitive restraint correlated with lower cravings for fatty foods, sweet foods and fast foods, increased uncontrolled eating was associated with increased cravings for carbohydrates, and increased emotional eating was associated with lower cravings for fatty foods and fast foods. This is consistent with previous findings; decreased food cravings are associated with increased fMRI-FCR of brain regions that regulate executive control over ingestion [56] and with cognitive reappraisal strategies, in particular those focusing on the benefits of not eating unhealthy foods, this could potentially increase the ability of individuals with obesity to inhibit appetitive motivation and reduce unhealthy food intake [57].
When the group was split by sex analysis showed that the relationships between age and decreasing food cravings were stronger in women compared to men. However, the relationships between eating behaviours and food cravings were not affected by sex. FTOgenotype influenced some of the relationships between BMI, age, eating behaviours and food cravings; in particular the inverse relationship between BMI and fatty food craving was stronger in the AA + AT genotype group compared to the TT group. We also saw an effect of theFTOgenotype on the relationship between age and emotional eating, with age-related decline in this behavior only present in the AA + AT genotype group.
We used mediation analysis to investigate these relationships. This showed that in the≤25 years group for both cravings for fatty food and cravings for sweet food CR mediated almost all of the relationships with BMI, demonstrating that it is very likely that the people in this group with higher BMI are using CR to suppress food cravings. This was in contrast to the >25 years group where this pattern was not seen. In the≤25 years group sweet cravings were strongly influenced by sex, with a more pronounced inverse relationship between BMI and sweet cravings seen in women. When CR was first investigated as an eating behavior the strong correlation observed between CR and BMI led to the conclusion that CR was a type of unhealthy eating behavior [4], and that people who restrained were more susceptible to binge eating, thereby leading to increased BMI. Thus, CR as an eating behavior was seen to drive an increase in BMI. However, many early studies were carried out in participants with overweight or obesity and in older demographic groups; in these groups CR may indeed be driving an increase in BMI. In contrast the data presented here supports that in younger age groups BMI may drive CR rather than the other way round, a suggestion which has also been made in other papers [29,57]. We have observed the same association between CR and BMI seen in previous studies, but in the≤25 years group this was particularly associated with a decrease in food cravings. We therefore propose that in people≤25 years, who are perhaps more self-conscious about their weight, CR is used to suppress food cravings, particularly in people with a raised BMI, hence the association between BMI and CR. This may instill habitual eating behaviours, which in later life increases the susceptibility to the cycles of restraint and binge-eating associated in some older populations with increased BMI [58]. Evidence to support this theory is provided by Rocks et al. who studied undergraduate students and found that this group, with a similar age and background to our
≤25 years group, demonstrated high dissatisfaction with body weight and high rates of disordered eating behaviours [59]. An additional possibility is that BMI also mediates the effect of age on eating behaviours and food cravings.
Our study has limitations; although many of the participants were drawn from the same geographical area there may be demographic differences between the≤25 years group who were mostly undergraduate students, and the >25 years group who were a mixture of staff, students and people from outside the university. In addition the lifestyle and eating habits of the≤25 years group in our study may not be fully representative of the general population in this age category. As some of the participants were friends and family of the students at the university they may share similar tastes, food preferences and cultural background which may also have influenced the results.
We did not collect detailed data on socio-economic status, education, marriage status or ethnicity in the current study so in future studies these potential confounders will be considered. The division into two age groups with a cut-off of 25 years was based on previous work that shows that life events such co-habiting, employment and having children are associated with changes in eating behaviour [38–40]; in our study group the age of 25 reflects a point after which these life events start to have an effect, in future studies collection of data on these variables will allow for their inclusion in the analysis. We chose to examine the effect ofFTOgenotype as this has been reported to be the most influential gene on BMI, in the future investigating a wider range of target genes would potentially reveal more information about the influence of genetics on the variables studied. A limitation of the use of self-reported questionnaires is that participants may not always be honest when answering, and the degree to which this is an issue may vary with weight status. In future studies we plan to standardise the conditions under which the questionnaires were completed to minimise this effect, and to incorporate food frequency questionnaires and DEXA analysis into our study protocol.
5. Conclusions
interact with notable differences between young and older age groups. Examining these interactions along with further polymorphisms linked to obesity could help identify those at risk of increasing BMI.
Author Contributions:Conceptualization, C.D. and D.B.; Data curation, H.A. and C.D.; Formal analysis, H.A. and H.E.F.; Funding acquisition, C.D.; Investigation, H.A., H.E.F. and C.D.; Methodology, H.A. and C.D.; Project administration, C.D.; Resources, C.D.; Supervision, D.B., D.H. and C.D.; Writing—original draft, H.A.; Writing—review and. editing, H.A., D.B., D.H. and C.D.
Funding:This research was funded by The Libyan Government.
Acknowledgments:The authors would like to thank all the participants who took part in this study.
Conflicts of Interest:The authors declare no conflict of interest.
References
1. World Health Organization. Obesity and Overweight; Fact Sheet; World Health Organization: Geneva, Switzerland, 2016; Volume 311.
2. Blundell, J.E.; Cooling, J. Routes to Obesity: Phenotypes, Food Choices and Activity.Br. J. Nutr.2000,83, S33–S38. [CrossRef] [PubMed]
3. Karlsson, J.; Persson, L.; Sjöström, L.; Sullivan, M. Psychometric Properties and Factor Structure of the Three-Factor Eating Questionnaire (TFEQ) in Obese Men and Women. Results from the Swedish Obese Subjects (SOS) Study.Int. J. Obes.2000,24, 1715. [CrossRef]
4. Hays, N.P.; Roberts, S.B. Aspects of Eating Behaviors “disinhibition” and “restraint” are Related to Weight Gain and BMI in Women.Obesity2008,16, 52–58. [CrossRef] [PubMed]
5. Burton, P.; Smit, H.J.; Lightowler, H.J. The Influence of Restrained and External Eating Patterns on Overeating. Appetite2007,49, 191–197. [CrossRef] [PubMed]
6. Van Strien, T.; Konttinen, H.; Homberg, J.R.; Engels, R.C.; Winkens, L.H. Emotional Eating as a Mediator between Depression and Weight Gain.Appetite2016,100, 216–224. [CrossRef] [PubMed]
7. Cherpitel, C.J.; Borges, G.; Ye, Y.; Bond, J.; Cremonte, M.; Moskalewicz, J.; Swiatkiewicz, G. Performance of a Craving Criterion in DSM Alcohol use Disorders.J. Stud. Alcohol. Drugs2010,71, 674–684. [CrossRef] [PubMed]
8. Hill, A.J. The Psychology of Food Craving*: Symposium on ‘Molecular Mechanisms and Psychology of Food Intake’.Proc. Nutr. Soc.2007,66, 277–285. [CrossRef] [PubMed]
9. Hallam, J.; Boswell, R.G.; DeVito, E.E.; Kober, H. Gender-Related Differences in Food Craving and Obesity. Yale J. Biol. Med.2016,89, 161–173.
10. Cepeda-Benito, A.; Fernandez, M.C.; Moreno, S. Relationship of Gender and Eating Disorder Symptoms to Reported Cravings for Food: Construct Validation of State and Trait Craving Questionnaires in Spanish. Appetite2003,40, 47–54. [CrossRef]
11. Rodriguez, S.; Fernandez, M.C.; Cepeda-Benito, A.; Vila, J. Subjective and Physiological Reactivity to Chocolate Images in High and Low Chocolate Cravers.Biol. Psychol.2005,70, 9–18. [CrossRef]
12. Chao, A.; Grilo, C.M.; White, M.A.; Sinha, R. Food Cravings, Food Intake, and Weight Status in a Community-Based Sample.Eat. Behav.2014,15, 478–482. [CrossRef]
13. Frayling, T.M.; Timpson, N.J.; Weedon, M.N.; Zeggini, E.; Freathy, R.M.; Lindgren, C.M.; Perry, J.R.; Elliott, K.S.; Lango, H.; Rayner, N.W.; et al. A Common Variant in the FTO Gene is Associated with Body Mass Index and Predisposes to Childhood and Adult Obesity.Science2007,316, 889–894. [CrossRef] [PubMed]
14. Speliotes, E.K.; Willer, C.J.; Berndt, S.I.; Monda, K.L.; Thorleifsson, G.; Jackson, A.U.; Allen, H.L.; Lindgren, C.M.; Luan, J.; Mägi, R. Association Analyses of 249,796 Individuals Reveal 18 New Loci Associated with Body Mass Index.Nat. Genet.2010,42, 937. [CrossRef] [PubMed]
15. Scuteri, A.; Sanna, S.; Chen, W.; Uda, M.; Albai, G.; Strait, J.; Najjar, S.; Nagaraja, R.; Orrú, M.; Usala, G. Genome-Wide Association Scan shows Genetic Variants in the FTO Gene are Associated with Obesity-Related Traits.PLoS Genet.2007,3, e115. [CrossRef] [PubMed]
18. Sonestedt, E.; Roos, C.; Gullberg, B.; Ericson, U.; Wirfält, E.; Orho-Melander, M. Fat and Carbohydrate Intake Modify the Association between Genetic Variation in the FTO Genotype and Obesity.Am. J. Clin. Nutr.2009, 90, 1418–1425. [CrossRef] [PubMed]
19. Lee, H.; kyoung Kim, I.; Kang, J.H.; Ahn, Y.; Han, B.; Lee, J.; Song, J. Effects of Common FTO Gene Variants Associated with BMI on Dietary Intake and Physical Activity in Koreans. Clin. Chim. Acta2010, 411, 1716–1722. [CrossRef]
20. Harbron, J.; Van der Merwe, L.; Zaahl, M.G.; Kotze, M.J.; Senekal, M. Fat Mass and Obesity-Associated (FTO) Gene Polymorphisms are Associated with Physical Activity, Food Intake, Eating Behaviors, Psychological Health, and Modeled Change in Body Mass Index in Overweight/Obese Caucasian Adults.Nutrients2014, 6, 3130–3152. [CrossRef]
21. Cornelis, M.C.; Rimm, E.B.; Curhan, G.C.; Kraft, P.; Hunter, D.J.; Hu, F.B.; Van Dam, R.M. Obesity Susceptibility Loci and Uncontrolled Eating, Emotional Eating and Cognitive Restraint Behaviors in Men and Women.Obesity2014,22, E135–E141. [CrossRef]
22. Ibba, A.; Pilia, S.; Zavattari, P.; Loche, A.; Guzzetti, C.; Casini, M.R.; Minerba, L.; Loche, S. The Role of FTO Genotype on Eating Behavior in Obese Sardinian Children and Adolescents.J. Pediatr. Endocrinol. Metab. 2013,26, 539–544. [CrossRef] [PubMed]
23. Dang, L.C.; Samanez-Larkin, G.R.; Smith, C.T.; Castrellon, J.J.; Perkins, S.F.; Cowan, R.L.; Claassen, D.O.; Zald, D.H. FTO Affects Food Cravings and Interacts with Age to Influence Age-Related Decline in Food Cravings.Physiol. Behav.2018,192, 188–193. [CrossRef] [PubMed]
24. Weingarten, H.P.; Elston, D. Food Cravings in a College Population.Appetite1991,17, 167–175. [CrossRef] 25. Drapeau, V.; Provencher, V.; Lemieux, S.; Després, J.; Bouchard, C.; Tremblay, A. Do 6-Y Changes in Eating
Behaviors Predict Changes in Body Weight? Results from the Quebec Family Study.Int. J. Obes.2003,27, 808. [CrossRef] [PubMed]
26. Hainer, V.; Kunesova, M.; Bellisle, F.; Parizkova, J.; Braunerova, R.; Wagenknecht, M.; Lajka, J.; Hill, M.; Stunkard, A. The Eating Inventory, Body Adiposity and Prevalence of Diseases in a Quota Sample of Czech Adults.Int. J. Obes.2006,30, 830. [CrossRef] [PubMed]
27. Chearskul, S.; Pummoung, S.; Vongsaiyat, S.; Janyachailert, P.; Phattharayuttawat, S. Thai Version of Three-Factor Eating Questionnaire.Appetite2010,54, 410–413. [CrossRef] [PubMed]
28. Lluch, A.; Herbeth, B.; Mejean, L.; Siest, G. Dietary Intakes, Eating Style and Overweight in the Stanislas Family Study.Int. J. Obes.2000,24, 1493. [CrossRef]
29. De Lauzon-Guillain, B.; Basdevant, A.; Romon, M.; Karlsson, J.; Borys, J.; Charles, M.A.; FLVS Study Group. Is Restrained Eating a Risk Factor for Weight Gain in a General Population? Am. J. Clin. Nutr. 2006,83, 132–138. [CrossRef]
30. Löffler, A.; Luck, T.; Then, F.S.; Luppa, M.; Sikorski, C.; Kovacs, P.; Tönjes, A.; Böttcher, Y.; Breitfeld, J.; Horstmann, A. Age-and Gender-Specific Norms for the German Version of the Three-Factor Eating-Questionnaire (TFEQ).Appetite2015,91, 241–247. [CrossRef]
31. Imperatori, C.; Innamorati, M.; Tamburello, S.; Continisio, M.; Contardi, A.; Tamburello, A.; Fabbricatore, M. Gender Differences in Food Craving among Overweight and Obese Patients Attending Low Energy Diet Therapy: A Matched Case–control Study.Eat. Weight Disord.2013,18, 297–303. [CrossRef]
32. Chao, A.; Grilo, C.M.; White, M.A.; Sinha, R. Food Cravings Mediate the Relationship between Chronic Stress and Body Mass Index.J. Health Psychol.2015,20, 721–729. [CrossRef] [PubMed]
33. Pelchat, M.L. Food Cravings in Young and Elderly Adults.Appetite1997,28, 103–113. [CrossRef] [PubMed] 34. Hill, A.J.; Weaver, C.F.; Blundell, J.E. Food Craving, Dietary Restraint and Mood.Appetite1991,17, 187–197.
[CrossRef]
35. Basdevant, A.; Craplet, C.; Guy-Grand, B. Snacking Patterns in Obese French Women. Appetite1993,21, 17–23. [CrossRef] [PubMed]
36. Narukawa, M.; Kamiyoshihara, A.; Kawae, M.; Kohta, R.; Misaka, T. Analysis of Aging-Dependent Changes in Taste Sensitivities of the Senescence-Accelerated Mouse SAMP1.Exp. Gerontol.2018,113, 64–73. [CrossRef] [PubMed]
37. Sergi, G.; Bano, G.; Pizzato, S.; Veronese, N.; Manzato, E. Taste Loss in the Elderly: Possible Implications for Dietary Habits.Crit. Rev. Food Sci. Nutr.2017,57, 3684–3689. [CrossRef] [PubMed]
39. Laroche, H.H.; Wallace, R.B.; Snetselaar, L.; Hillis, S.L.; Steffen, L.M. Changes in Diet Behavior when Adults Become Parents.J. Acad. Nutr. Diet.2012,112, 832–839. [CrossRef] [PubMed]
40. Au, N.; Hollingsworth, B. Employment Patterns and Changes in Body Weight among Young Women. Prev. Med.2011,52, 310–316. [CrossRef]
41. Stunkard, A.J.; Messick, S. The Three-Factor Eating Questionnaire to Measure Dietary Restraint, Disinhibition and Hunger.J. Psychosom. Res.1985,29, 71–83. [CrossRef]
42. White, M.A.; Whisenhunt, B.L.; Williamson, D.A.; Greenway, F.L.; Netemeyer, R.G. Development and Validation of the Food-craving Inventory.Obes. Res.2002,10, 107–114. [CrossRef] [PubMed]
43. Barnes, R.D.; White, M.A. Psychometric Properties of the Food Thought Suppression Inventory in Men. J. Health Psychol.2010,15, 1113–1120. [CrossRef] [PubMed]
44. White, M.A.; Grilo, C.M. Psychometric Properties of the Food Craving Inventory among Obese Patients with Binge Eating Disorder.Eat. Behav.2005,6, 239–245. [CrossRef] [PubMed]
45. Preacher, K.J.; Hayes, A.F. Asymptotic and Resampling Strategies for Assessing and Comparing Indirect Effects in Multiple Mediator Models.Behav. Res. Methods2008,40, 879–891. [CrossRef] [PubMed]
46. Hayes, A.F.; Preacher, K.J. Statistical Mediation Analysis with a Multicategorical Independent Variable.Br. J. Math. Stat. Psychol.2014,67, 451–470. [CrossRef] [PubMed]
47. Cohen, J. A Power Primer.Psychol. Bull.1992,112, 155. [CrossRef] [PubMed]
48. Sullivan, G.M.; Feinn, R. Using Effect Size—Or Why the P Value is Not Enough.J. Grad. Med. Educ.2012,4, 279–282. [CrossRef] [PubMed]
49. Cappelleri, J.; Bushmakin, A.; Gerber, R.; Leidy, N.; Sexton, C.; Lowe, M.; Karlsson, J. Psychometric Analysis of the Three-Factor Eating Questionnaire-R21: Results from a Large Diverse Sample of Obese and Non-Obese Participants.Int. J. Obes.2009,33, 611. [CrossRef]
50. Van Strien, T.; Engels, R.C.; Van Leeuwe, J.; Snoek, H.M. The Stice Model of Overeating: Tests in Clinical and Non-Clinical Samples.Appetite2005,45, 205–213. [CrossRef]
51. Zavattari, P.; Loche, A.; Pilia, S.; Ibba, A.; Moi, L.; Guzzetti, C.; Casini, M.R.; Loche, S. rs9939609 in the FTO Gene is Associated with Obesity but Not with several Biochemical Parameters in Sardinian Obese Children. Ann. Hum. Genet.2011,75, 648–654. [CrossRef]
52. Rivas, A.M.O.; Santos, J.L.; Valladares, M.A.; Cameron, J.; Goldfield, G. Association of the FTO Fat Mass and Obesity–associated Gene rs9939609 Polymorphism with Rewarding Value of Food and Eating Behavior in Chilean Children.Nutrition2018,54, 105–110. [CrossRef] [PubMed]
53. Bull, N.L. Dietary Habits, Food Consumption, and Nutrient Intake during Adolescence.J. Adolesc. Health 1992,13, 384–388. [CrossRef]
54. Munt, A.; Partridge, S.; Allman-Farinelli, M. The Barriers and Enablers of Healthy Eating among Young Adults: A Missing Piece of the Obesity Puzzle: A Scoping Review.Obes. Rev.2017,18, 1–17. [CrossRef] [PubMed]
55. Johnson, F.; Pratt, M.; Wardle, J. Dietary Restraint and Self-Regulation in Eating Behavior.Int. J. Obes.2012, 36, 665. [CrossRef] [PubMed]
56. Kahathuduwa, C.N.; Davis, T.; O’Boyle, M.; Binks, M. Do Scores on the Food Craving Inventory and Three-Factor Eating Questionnaire Correlate with Expected Brain Regions of Interest in People with Obesity? Physiol. Behav.2018,188, 1–10. [CrossRef] [PubMed]
57. Yokum, S.; Stice, E. Cognitive Regulation of Food Craving: Effects of Three Cognitive Reappraisal Strategies on Neural Response to Palatable Foods.Int. J. Obes.2013,37, 1565. [CrossRef] [PubMed]
58. Stice, E.; Ziemba, C.; Margolis, J.; Flick, P. The Dual Pathway Model Differentiates Bulimics, Subclinical Bulimics, and Controls: Testing the Continuity Hypothesis.Behav. Ther.1996,27, 531–549. [CrossRef] 59. Rocks, T.; Pelly, F.; Slater, G.; Martin, L.A. Eating Attitudes and Behaviours of Students Enrolled in
Undergraduate Nutrition and Dietetics Degrees.Nutr. Diet.2017,74, 381–387. [CrossRef]