Thermal curing of concrete with conductive polymer
technology.
CATLEY, David G.
Available from Sheffield Hallam University Research Archive (SHURA) at:
http://shura.shu.ac.uk/19431/
This document is the author deposited version. You are advised to consult the
publisher's version if you wish to cite from it.
Published version
CATLEY, David G. (2009). Thermal curing of concrete with conductive polymer
technology. Doctoral, Sheffield Hallam University (United Kingdom)..
Copyright and re-use policy
ProQuest Number: 10694312
All rights reserved
INFORMATION TO ALL USERS
The quality of this reproduction is dependent upon the quality of the copy submitted.
In the unlikely event that the author did not send a com plete manuscript and there are missing pages, these will be noted. Also, if material had to be removed,
a note will indicate the deletion.
uest
ProQuest 10694312
Published by ProQuest LLC(2017). Copyright of the Dissertation is held by the Author.
All rights reserved.
This work is protected against unauthorized copying under Title 17, United States C ode Microform Edition © ProQuest LLC.
ProQuest LLC.
789 East Eisenhower Parkway P.O. Box 1346
Thermal Curing of Concrete with Conductive Polymer Technology
David Gerald Catley
A thesis submitted in partial fulfilment of the requirements of Sheffield Hallam University
for the degree of Doctor of Philosophy
Confidentiality Agreement
Abstract
“Concrete is used on the majority of all construction projects. It is manufactured using the core constituents of a cement binder, typically Portland Cement, proportions of coarse and fine aggregates and water. The strength development of concrete is achieved by the addition of water that reacts with the binder in the form of a hydration reaction. This hydration reaction or strength development is dependant on two primary curing factors, time and temperature. Increasing the rate of strength development of concrete by elevating the curing temperature at early ages has advantages of maximising concrete production and reducing manufacturing time. Increasing the temperature of early age concrete up to 70 deg C is used in precast plants where it is critical for a minimum strength to be achieved within a certain time period to allow the removal of the concrete sections from moulds and forms. Various practices are adopted by precast concrete manufacturers to achieve the early strengths required to maximise production, both thermal and non-thermal. These include heating the various mix constituents of the concrete, using unnecessarily high cement contents within the mix, using large quantities of chemical admixtures or by increasing the ambient temperature of plants within which the elements are manufactured. In precast concrete plants the use of steam to elevate the curing temperature of the concrete is the most commonly adopted technique. However, it is inefficient and rarely provides controlled temperatures to the concrete as recommended in approved codes of practices and standards. This research programme has investigated the use of an alternative heating technology for concrete curing, optimising a unique Conductive Polymer Technology (CPT). The application and optimisation of the CPT material to provide heat curing to concrete within the laboratory, in-situ and within precast concrete plants has been investigated. The electrical properties of the CPT were investigated to determine their relationship with the size of the concrete elements. This was done for various CPT materials with different Characteristic Resistances. Having gained an in depth understanding of the electrical properties of the CPT, various heating Jackets were designed and manufactured to thermally cure concrete elements at early ages. The Jackets were designed with various outer protective materials. The effect of CPT curing on the strength and shrinkage, both at early ages and long-term,
was determined. The thermal performance of the heating jackets was determined for each
application including the uniformity of the heating provided into the concrete element. The interaction of the heat generated by hydration and CPT heating for larger elements was also investigated.
materials selection e.g. the importance of the contact between CPT heating elements and the concrete element and the selection of appropriate insulation materials
The test programme also investigated the durability of CPT under different exposure conditions. The results from testing the CPT material under conditions such as freeze thaw, heating & cooling and wetting & drying showed that wetting and drying had the most significant affect on the CPTs resistance, altering by 10%. Other tests of durability included punching holes of various sizes into the CPT samples to determine their effect on the CPT’s resistance. This was found to be directly linked to the area of CPT material removed.
The manufacture, performance and operation of the CPT materials has also been investigated to provide an understanding of its mode of heating and its effect on concrete curing. The concept of maturity has been used to determine relationships between strength development and thermal curing and energy requirement for thermal curing when using CPT.”
Keywords
Acknowledgements
The author would like to particularly acknowledge the following five people without whom the following research work could not have been conducted
• Professor Pritpal Mangat (Sheffield Hallam University): For his advice and support; and for sharing his knowledge and experience both on a personal and professional level.
• Patrick O’Grady (PJO Industrial I Inditherm pic): For his drive and enthusiasm towards the research programme and its objectives.
• lordanis Chidiroglou (Sheffield Hallam University): For his assistance during the latter period of the research programme.
• Bob Skelton and Geoff Harwood (Sheffield Hallam University): For their support and assistance within the construction materials & structures laboratories at Sheffield Hallam University.
In addition the author would like to acknowledge the contribution made by the following people and
organisations:-• Dr Finbar O’Flaherty and the staff of the Centre for Infrastructure Management at
Sheffield Hallam University.
• Colin Tarry and Alan Duffty of Inditherm pic.
• The DTi’s Knowledge Transfer Partnership (KTP) programme.
Candidates Declaration
I herby declare that no portion of the work referred to in this thesis has been submitted in support of an application for another degree or qualification of this or any other institution of learning. All sources of information have been acknowledged.
Candidate
David Gerald Catley - March 2009
Director of studies
Contents
C o n fid en tiality A g re e m e n t...ii
A bstract iii Keywords ... iv
A ckn o w led g em en ts...v
C andidates D e c la ra tio n ...vi
C ontents viii List of F ig u re s ...xii
List of Tables ...xvi
C hapter 1. In tro d u c tio n ...1
1.1. Background to Research...1
1.2. Scope of Research...2
1.3. Project Objectives...3
1.4. Thesis Structure...4
C hapter 2. Literature R eview ... 6
2.1. Introduction... 6
2.2. Fundamentals of Concrete... 7
2.5. Thermal Properties of Concrete... 11
2.5.1. Thermal Conductivity...11
2.5.2. Specific Heat Capacity...14
2.6. Heat of Hydration...15
2.7. Acceleration of the Hydration Reaction with Temperature... 16
2.8. Temperature Effects on Concrete...17
2.8.1. Delayed Ettringite Formation... 19
2.9. Steam Curing of Concrete at Atmospheric Pressure... 19
2.10. Hot Mix Curing...22
2.11. Direct Electric Curing... 22
2.12. Other Temperature Curing Techniques... 23
2.13. Conductive Polymer Technology...24
2.14. Optimum High Temperature Curing Profiles...25
2.15. Standards for Thermal Curing of Concrete at Early Ages...29
2.16. Cold Weather Concreting... 29
2.16.1. BS 8110-1:1997 Structural use of Concrete. .Code of Practice for Design and Construction...30
2.17. Maturity Method...32
2.18. Controlled Permeability Formwork...33
2.19. ■ ' Temperature Gradient Control... 33
2.20. Optimisation of Cement Content and Pozzolans... 34
2.21. Discussion... 34
2.22. Concluding Remarks...34
C hapter 3. Theory of C onductive Polym er Technology ... 36
3.1. Introduction... 36
3.1.1. Ohms Law... 37
3.1.2. Resistivity... 39
3.1.3. Conductive Properties of Carbon... 41
3.2. Manufacture of CPT... 41
3.2.1. Control of Resistance... 42
3.3. Manufacture of CPT Elements... 43
3.3.1. Bonding of the Conductive Rails... 44
3.3.2. Operating Voltage...45
3.3.4. Connecting Numerous Elements... 47
3.3.5. Common Rail (Series)...49
3.3.6. Common Rail (Parallel)...50
C hapter 4. M aterials S p ecificatio n , Therm al Jacket Design and In s tru m en tatio n ...53
4.1. Introduction...53
4.2. Blanket / Jacket Design...53
4.2.1. Outer Protective Materials... 54
4.2.3. Insulation Layers... 55
4.2.5. Cable 57 4.2.6. Connectors...58
4.2.7. Blanket Securing Mechanisms... 60
4.3. CPT Blankets used in the Tests... 60
4.3.1. LAB 100 Jacket... 61
4.3.2. LAB 300 Jacket... 63
4.3.3. LAB 400 Jacket... 65
4.3.4. INSITU 1500 Jacket (Side)... 67
4.3.5. INSITU 1500 Jacket (Upper)... 69
4.3.6. PRECAST 6500 Jacket ... 71
4.4. Transformer Control Units... 73
4.5. Concrete Mix Designs...73
4.7. Shrinkage Strain Measurement... 77
4.8. Controlled Environments... 77
4.8.1. Environmental Control Room... 77
4.8.2. Temperature - Humidity Chamber... 77
4.9. Other Data Acquisition...78
C hapter 5. Basic R elationships of C P T ... 80
5.1. Introduction...80
5.2. Experimental Procedure...80
5.2.1. Characteristic Resistance...80
5.2.2. Relationship between Element Length and Resistance... 81
5.2.3. Relationship between Element Width and Resistance... 82
5.2.4. Relationship between Current and Applied Voltage for Elements of Various Lengths...83
5.3. Results... 84
5.3.1. Characteristic Resistance... 84
5.3.2. Relationship between Element Length and Resistance...86
5.3.3. Relationship between Element Width and Resistance... 88
5.3.4. Relationship between Current and Voltage...90
5.4. Discussion and Analysis...93
5.4.1. Determination of Effective Length Factor... 93
5.4.2. General Relationship between R and W.... 97
5.4.3. Alternative Relationship between R and W...103
5.4.4. Voltage - Current Relationships of CPT...105
5.4.5. Prediction of Current at given Voltages... 106
5.4.6. Resistivity of CPT... 107
5.5. Conclusions...109
C hapter 6. Strength D evelopm ent and Shrinkage of C oncrete Cured with C P T ...110
6.1 Introduction... 110
6.2 Initial Heating... 110
6.2.1 Empty Mould... 112
6.2.2 Full Mould...114
6.3 Effect of CPT Curing on Compressive Strength...115
6.4 Comparison of Different Heat Curing Methods...117
6.5 Shrinkage...119
6.6.1 CPT Heating...121
6.6.2 Strength... 123
6.6.3 Curing Regimes...124
6.6.4 Shrinkage... 125
6.7 Conclusions... 125
C hapter 7. Interaction between Tem perature and Heat of H ydration in Large Concrete Elem ents ... 127
7.1. Introduction...127
7.2. Experimental Set up and Procedure...127
7.2.1. Thermal Curing Profiles... 128
7.2.2. Temperature monitoring... 129
7.2.3. Core Sampling and Concrete Strength Testing... 130
7.3. Results... 131
7.3.1. Calibration of LAB 400 Jacket...131
7.3.2. Curing Blanket Performance used to Heat 400mm Concrete Mould 133 7.3.3. Curing Profiles of the 400mm Concrete Cubes... 135
7.3.4. Interaction of Heat of Hydration and Heat Supplied by the Thermal Jacket...137
7.4. Discussion of Results... 139
7.4.1. Temperature Distribution...139
7.5. CPT interactions with Heat of Hydration... 141
7.6. Strength Distribution...142
7.7. Conclusions...147
C hapter 8. A pplications ...148
8.1. Introduction...148
8.2. Experimental Set-up... 148
8.2.1. Stanchion Foundation...149
8.2.2. Precast Concrete... 151
8.3. CPT Jackets...152
8.3.1. INSITU 1500 Jacket...152
8.3.2. PRECAST 6500 Jacket...153
8.4. Control and Transformer unit... 153
8.5. Concrete...155
8.6. Temperature Monitoring and Data Acquisition...156
8.6.1. Foundation thermocouple positioning...156
8.6.2. Precast concrete thermocouple positioning...158
8.6.3. Thermocouple Calibration...159
8.7. Results...160
8.7.1. Stanchion Foundation...160
8.7.2. LAB 6500 Jacket performance... 162
8.8. Discussion of Results...166
8.8.1. Protection Period... 168
8.8.2. Period before striking...169
8.8.3. Maturity Factor... 170
8.9. Conclusions... 170
C hapter 9. D urability of CPT and Cover M a te ria ls ...171
9.1. Introduction...171
9.2. Experimental Set-up and Procedure...171
9.2.1. Freeze Thaw Cycles...172
9.2.2. Wetting and Drying... 174
9.2.3. Heating and Cooling...174
9.2.4. Exposure to Cement Alkalinity... 175
9.2.5. The Effect of Holes in CPT Elements...176
9.3. Results and discussion...178
9.3.1. Durability of CPT...178
9.3.2. Durability of Cover Materials... 180
C h a p te r 10. G en eral D is c u s s io n and A n a ly s is ... 186
10.1. Introduction... ....186
10.2. Performance of CPT Jackets...186
10.2.1. Heat Flux...187
10.2.2. Volume of Concrete...191
10.3. Maturity...198
10.3.1. Non-adiabatic Beam Curing...199
10.3.2. Adiabatic Slab testing...200
10.4. The Influence of Surface Volume Ratio on Temperature Profile...201
10.4.1. Element Volume...206
10.4.2. Volume / Surface Ratio... 208
10.6. Conclusions...214
C hapter 11. C onclusions and R eco m m en d atio n s...215
11.1. Conclusions...215
11.2. Recommendations... 217
Awards and A ckn o w led g em en ts...224
P ublications ... 225
List of Figures
Chapter 2
Figure 2.1. The relationship between cement content, w/c ratio and early-age
specific heat (assuming the specific heat of the aggregate is 0.8 kJ/kg°C)
(CIRIA 660)...15
Figure 2.2. Heat generated due to cement hydration within a typical concrete mix.. 16
Figure 2.3. Influence of curing temperature on compressive strength at 1 and 28 days (specimens tested after cooling to 23 deg over a period of two hours) GJ Verbeck and RA Helmuth 1968)... 18
Figure 2.4. Free steam curing of prestressed pipes (Picture courtesy of Prefabet Precast Concrete Ltd)...20
Figure 2.5. Captured steam pipe network running adjacent to steel ‘Double-T’ mould (picture courtesy of Tarmac Precast Concrete Ltd)... 21
Figure 2.6. Positioning of hoses prior to casting and insulating with blankets 24 Figure 2.8. General temperature profile for accelerated curing of concrete 26 Figure 2.9. Effect of delay in steam curing on early age strength with maturity (Small figures indicate the delay in hours before curing at the temperature indicated (Neville 1995)... 27
Chapter 3 Figure 3.1. CPT prior to configuration into heating elements...36
Figure 3.2. Linear relationship between voltage V and Current I for an Ohmic metal ...38
Figure 3.3. Non-Linear relationship between voltage V and Current I for non-Ohmic semi conductors...38
Figure 3.4. Relationship between R, p, L and A for a wire element... 39
Figure 3.5. A typical CPT element...42
Figure 3.6. Sample dimensions of CPT used to determine R!D... 43
Figure 3.7. Sample of CPT with conductive rails to determine R|D... 43
Figure 3.8. Parallel and parallel conductive rails resulting in uniform and non-uniform heat distribution respectively... 44
Figure 3.9. Positioning of conductive tape onto the CPT material (end view)... 45
Figure 3.10. Simple solder connection (side view)...46
Figure 3.11. Crimp and press stud electrical connection (side view)... 47
Figure 3.12. Similar CPT elements connected in series... 48
Figure 3.13. CPT elements connected in parallel...48
Figure 3.14. Similar CPT elements wired in parallel to maintain function in case either is damaged... 49
Figure 3.15. CPT element with common middle rail (series)...50
Figure 3.16. CPT element with common middle rail (parallel)...51
Figure 3.17. Wiring of CPT element...52
Chapter 4 Figure 4.1. Cross section through a typical CPT heating blanket... 54
Figure 4.2. Lamination machine through which the CPT element is passed... 57
Figure 4.3. Amphenol type connector, Male - Female in-line connector with S-Y braided cable... 59
Figure 4.4. Typical Bulgin 900 series In-line connector (image courtesy of (http://www.bulgin.co.uk)...59
Figure 4.5. General Lay-out of Blanket CPT LAB-100 (not to scale)...61
Figure 4.6. General Lay-out of Blanket CPT LAB-300 (Not to scale)...63
Figure 4.7. LAB 400 Jacket... 65
Figure 4.8. INSITU 1500 Jacket (Side)... 67
Figure 4.9. INSITU 1500 Jacket (Upper)... 69
Figure 4.10. Precast 6500 Jacket...71
Figure 4.11. Thermocouple configuration and ‘butt’ crimp resin protection method. ..76
Chapter 5 Figure 5.1. Figure 5.2. Figure 5.3. Figure 5.4. Figure 5.5. Figure 5.6. Figure 5.7. Figure 5.8. Figure 5.9. Figure 5.10. Figure 5.11. Figure 5.12. Figure 5.13. Figure 5.14. Figure 5.15. Figure 5.16. Figure 5.17. Figure 5.18. Figure 5.19. Figure 5.20. Figure 5.21. Figure 5.22. Figure 5.23. Figure 5.24. Figure 5.25.
Determination of Characteristic Resistance R!D...81
CPT element configuration and resistance measurement locations 82 CPT configuration and resistance measurement points...83
CPT configuration and current measurement points... 84
Batch resistances (Characteristic and Target) for the three CPT’s ...85
Graph of measured resistance versus element length... 86
Graph of measured resistance versus effective length... 88
Graph of measured resistance versus element width, W, for given element lengths, /, (RT= 20 ohm)...89
Graph of measured resistance versus element width, W, for given element lengths, /, (RT= 150 ohm)...89
Current versus element length, /, for RT = 20 ohm, W = 1 m ...91
Current versus element length, /, for RT = 50 ohm, W = 1 m ...91
Current versus element length, /, for the RT = 150 ohm...92
Graph of measured resistance versus element length for various element widths (Rt = 20 ohm)...94
Graph of measured resistance versus element length for various element widths (RT = 150 ohm)...95
Graph of effective length factor e versus width, W for RT = 20 and 150 ohms... 96
Graph of Ln W versus LnR for CPT of RT = 20 ohms... 98
Graph of LnWversus LnR for CPT of RT = 150ohms... 99
Graph of measured resistance versus element width for given element lengths... 100
Experimental and calculated relationship between R and W, RT = 20 ohms... 101
Experimental and calculated relationship between R and W, RT = 150 ohms... 102
Graph of W versus Ln R for RT = 20 ohm s...104
Graph of W versus Ln R for RT = 150 ohm s...104
Graph of Measured and Calculated Current versus Width (RT = 20, 50 and 150 ohms) (element I = 280mm, W - 1m )...105
Graph of Measured and Calculated Current versus length. I (RT = 20 ohms)... 106
Graph of Measured and Calculated Current versus length, / (RT = 150 ohms)... 107
Chapter 6 Figure 6.1. 100mm x 100mm x 100mm cast iron mould conforming to BS1881 .... 111
Figure 6.2. Application of LAB 100 Jacket to 100mm x 100mmx 100mm standard BS 8110 mould...111
Figure 6.3. Performance of the LAB 100 CPT thermal jacket applied to the empty 100mm x 100mm x 100mm cube mould... 112
Figure 6.4. Cooling Profile of the empty 100mm cube mould following heating with the LAB 100 Jacket...113
Figure 6.5. Heating profile of 100mm x 100mm x 100mm mould using 50, 60 and 70 deg thermostats in sequence... 114
Figure 6.6. Heating profile of 100mm x 100mm x 100mm mould containing concrete, using 70 deg C thermostat... 115
Figure 6.7. Effect of curing temperature on strength - age relationship of concrete.... ...117
Figure 6.8. Strength development of the concrete with different high temperature uring methods... 118
Figure 6.9. Location of axial strain measuring points... 120
Chapter 7
Figure 7.1. Figure 7.2. Figure 7.3. Figure 7.4. Figure 7.5. Figure 7.6. Figure 7.7. Figure 7.8. Figure 7.9. Figure 7.10 Figure 7.11 Figure 7.12 Figure 7.13 Figure 7.14 Figure 7.15 Figure 7.16 Figure 7.17 Figure 7.18 Chapter 8 Figure 8.1. Figure 8.2. Figure 8.3. Figure 8.4. Figure 8.5. Figure 8.6. Figure 8.7. Figure 8.8. Figure 8.9. Figure 8.10. Figure 8.11. Figure 8.12. Figure 8.13. Figure 8.14. Figure 8.15. Figure 8.16. Figure 8.17. Figure 8.18. Figure 8.19.
Thermal curing jacket fitted onto the 400 x 400 x 400 mm cube mould 128
Accelerated curing profiles used throughout the test programme 129
Location of temperature sensors...130
Location of core samples taken from the 400mm concrete cube... 131
Performance of the thermal jacket when not applied to the 400mm cube mould. Operating temperature profile: 50 deg C @ 5 deg C /h...132
Performance of the thermal jacket when not applied to the 400mm cube mould. Operating profile 1: 70 deg C @ 15 deg C/h... 132
Temperature profile across the empty 400mm cube mould. Curing profile: 70 deg C @ 10 deg C /h ...133
Curing profile of concrete cast in the 400mm cube mould, profile 1: 50 deg C @ 10 deg C /h...135
Curing profile of concrete cast in the 400mm cube mould, profile 2: 50 deg C @ 15 deg C /h...136
Curing profile of concrete cast in the 400mm cube mould, profile 3: 60 deg C @ 10 deg C /h...137
Heat of hydration generated by concrete cast in the 400mm steel mould.. ...137
Heat of hydration temperature profiles in the 400mm concrete cube...139
Temperature profiles through the 400mm concrete cube when cured with the thermal jacket; profile 1 50 deg C @ 10 deg C/h... 140
Typical Profile of heat generated by cement hydration... 141
Histogram of concrete core strengths taken from 400mm cubes cured using profiles 1,2 and 3 ...142
Core strength relative to core 5 (Profile 1: 50 deg C @ 10 deg C/h).... 145
Core strength relative to core 5 (Profile 2: 50 deg C @ 15 deg C/h) 145 Core strength relative to core 5 (Profile 3: 60 deg C @ 10 deg C/h) 146 Cross-section of a typical stanchion foundation...149
Location of foundations in relation to each other...150
Positioning of CPT Jackets on the terrace mould... 151
Curing liner in position prior to casting of Foundation A ...152
Precast mould and CPT jacket positioning... 153
Control unit for the INSITU 1500 Jacket... 154
Control unit for the INSITU 1500 Jacket... 154
Typical precast terrace section cast within the mould... 156
Reinforcement cage arrangement showing position of thermocouple sensors...157
Thermocouple sensor location on cages of Foundations A and B ... 157
Precast concrete mould thermocouple locations...158
Calibration graph thermocouple Sensors T1 -T10 (Foundation A )... 159
Calibration graph thermocouple sensors T10-T20 (Foundation B)... 159
Temperature curing profile of Foundation A. (Cured with CPT liner).... 160
Temperature curing profile of Foundation B.(No CPT liner)...161
Terrace section cured at 24 Volts using the PRECAST 6500 Jacket on the mould (24 Volts)...163
Terrace section cured at 24 Volts using the PREACST 6500 Jacket (24 Volts, modified)... 164
Comparison of naturally cured terrace sections cured using INSITU 6500 Jacket (36 Volts)... 165
Chapter 9
Figure 9.1. Locations of resistance measuring points...172
Figure 9.2. Samples during freeze / thaw durability testing...173
Figure 9.3. Heating and cooling cycle...175
Figure 9.4. Concrete mould containing CPT sample, before and after casting 176 Figure 9.5. Location of holes and resistance testing points...177
Figure 9.6. Effective CPT width... 179
Figure 9.7. Visual inspection of CPT and outer materials...181
Figure 9.8. Temperature output under constant operation (48 Volts)...183
Figure 9.9. Temperature output under cyclic operation (48 Volts)... 183
Figure 9.10. Temperature output of composite element under constant operation ..184
Chapter 10 Figure 10.1. Element configuration, Jacket and Heat flux...186
Figure 10.2. Graph of Power vs Volume of Concrete... 192
Figure 10.3. Graph of Volume vs Heat Flux...193
Figure 10.4. Graph of Volume vs Heat Flux (Large elements)... 194
Figure 10.5. Maximum change in Temperature versus Power per m 3...196
Figure 10.6. Time to reach maximum temperature versus Power per m3... 197
Figure 10.7. Temperature vs time for heated applications (Non - adiabatic)...202
Figure 10.8. Temperature vs time for un heated curing (Non - adiabatic)...202
Figure 10.9. Graph of Maturity vs Energy delivered by each system...205
Figure 10.10. Graph of Maturity vs Energy delivered by each system per m3...207
Figure 10.11. Graph of Maturity vs Enegy Delivered per A rea... 210
Figure 10.12. Graph of Maturity vs Volume / Surface area ratio...212
Figure 10.13. Maturity against volume to surface ratio...213
List of Tables
Chapter 2
Table 2.1. Definition of early, medium and long-term in terms of concrete strength
development...6
Table 2.2. Range of cement contents and w/c ratios used for practical mixes (Neville 1995 and Cement and Concrete Association) ...7
Table 2.3. Typical compound compositions within rapid hardening Portland cement (W Czernin)... 9
Table 2.4. Estimated values of thermal conductivity ay early age (5 days) for concretes using different aggregate types. Aggregate data were obtained from Clauser and Huenges (1995)... 13
Table 2.5. Proposed values of thermal conductivity of concrete for use in early age thermal modelling (CIRIA 660 Appendix 2)...14
Table 2.6. Heat of hydration of the four major compounds of cement clinker (taken from LOVACS Mid term reports - 2 UMM (PWN Warszawa 1991)... 15
Table 2.7. Heat of Hydration developed after 72 hours (3 days) at different temperatures (Lerch W and Ford C L )... 17
Table 2.8. Energy comparisons of CPT heating and steam curing... 25
Table 2.9. Optimum delay periods, Saul (1994)...27
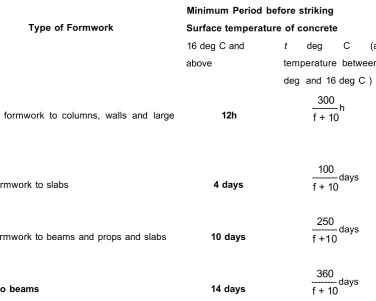
Table 2.10. Minimum periods of curing and protection... 30
Table 2.11. Minimum period before striking formwork...31
Chapter 4 Table 4.1. Jacket ID’s and applications... 53
Table 4.2. Details of outer materials...54
Table 4.3. Outer material details...55
Table 4.4. Description of insulation materials... 56
Table 4.5. Properties of insulation layers... 56
Table 4.6. Core assignment for 4 - core cable...57
Table 4.7. Core assignment for 7 - core cable...58
Table 4.8. LAB 100 Jacket specification... 62
Table 4.9. LAB 300 Jacket specification... 64
Table 4.10. LAB 400 Jacket specification... 66
Table 4.11. INSITU 1500 Jacket specification (side)...68
Table 4.12. INSITU 1500 Jacket specification (upper)...70
Table 4.13. PRECAST 6500 Jacket specification...72
Table 4.14. Sieve analysis of fine aggregate showing zone M grading...74
Table 4.15. Mix design for concrete Mix A ... 74
Table 4.16. Specification for Mix B used in rail track stanchion foundations... 75
Table 4.17. Specification for Mix C used in precast concrete units...75
Table 4.18. K and T - Type thermocouples used throughout the experimental programme ... 76
Table 4.19. Electrical meter specification...78
Chapter 5 Table 5.1. Summary of batch resistances... 85
Table 5.2. Summary of batch resistances... 87
Table 5.3. Values of effective length factor, £ (RT = 20 ohm)...94
Table 5.4. Calculation of effective length factor, £ (RT= 150 ohms)... 95
Table 5.5. Calculation of the Material Constant, M, for RT = 20 ohms... 98
Table 5.6. Calculation of Material Constant for M for CPT RT = 150 ohms...99
Chapter 6 Table 6.1. Test cubes cast and corresponding CPT curing temperatures...116
Table 6.2. Curing regimes for shrinkage tests... 119
Chapter 7
Table 7.1. Compressive strengths of core samples... 142
Table 7.2. Compressive strengths of core samples (Curing Profile 1: 50 deg C @ 10 deg C/h) ... 143
Table 7.3. Compressive strengths of core samples (Curing Profile 2: 50 deg C @ 15 deg C/h)...144
Table 7.4. Compressive strengths of core samples (Curing Profile 3: 60 deg C @ 10 deg C/h)...144
Chapter 8 Table 8.1. Foundation concrete specification (Mix B )... 155
Table 8.2. Precast concrete specification (Mix C )...155
Table 8.3. Compressive strength results of 150mm cubes tested at 7 and 28 days 162 Table 8.4. Element curing temperatures... 167
Table 8.5. Protection period (BS8110) required to prevent frost attack...169
Table 8.6. Period before striking of formwork is permitted (BS8110)...169
Chapter 9 Table 9.1. Summary of holes and locations...177
Table 9.2. Average resistance of CPT samples after different durability test regimes ....178
Table 9.3. he resistance of the CPT elements throughout constant and cyclic operation ... 184
Chapter 10 Table 10.1. Jacket heating area...187
Table 10.2. acket heating area summary... 188
Table 10.3. CPT element heating area... 189
Table 10.4. CPT Jacket Electrical Properties...189
Table 10.5. Jacket Heat Flux... 190
Table 10.6. Element Heat Flux... 190
Table 10.7. Volume of concrete...191
Table 10.8. CPT power in-put comparisons...191
Table 10.9. Increase in temperature per application... 195
Table 10.10. Details of beam elements... 200
Table 10.11. Energy applied by CPT Jackets...203
Table 10.12. Maturity for non adiabatic applications (24 hours)... 204
Table 10.13. Maturity of adiabatically cured slab elements (24 hours)...204
Table 10.14. Energy delivered per m3 of concrete... 206
Table 10.15. Energy delivered per m3for non adiabatic curing... 206
Table 10.16. Concrete element surface area...208
Table 10.17. Mould internal surface area (excludes the open faces)...209
Table 10.18. Volume surface ratio... 209
Table 10.19. CPT power output comparisons...211
Table 10.20. CPT power output comparisons...211
Chapter 1. Introduction
1.1. Background to Research
Concrete is used in most construction projects. Its constituents are a cement binder, typically Ordinary Portland Cement (OPC), proportions of coarse and fine aggregates and water. The strength development of concrete is achieved by adding water which reacts with the binder in a resulting hydration reaction. The rate of hydration and the properties of concrete can be altered by varying the proportions of the mix constituents. The hydration reaction and strength development of concrete depend on two primary factors, time and temperature. Hydration is a reaction which continues at a steadily declining rate over a long time in the presence of free water and unhydrated cement within the concrete matrix. This continued hydration and thus development of strength, is very much an advantage of the material in terms of its long-term durability. However, the rate of strength development within the first few hours and days after casting can be of greater importance particularly if construction times are to be reduced, construction costs minimised and manufacturing volumes increased. Therefore a key consideration in the manufacture of concrete is the rate of strength development at early age.
Increasing the rate of strength development of concrete at early ages has advantages of maximising the production of concrete elements and reducing the time before external forces (e.g. prestress) can be applied. The strength development of concrete depends on the rate of hydration of the cement binder and the availability of water. This reaction can be accelerated by increasing the temperature of the concrete mix at early ages. The strength of a concrete mix depends on the water cement ratio (W/C); the lower this value the greater the strength.
Increasing the temperature of early age concrete up to 70 deg C is used in the manufacture of precast and prestressed concrete. In precast plants it is critical to achieve a minimum target strength of the concrete within a certain time period to allow the removal of the concrete elements from moulds and forms. It is also critical that a target compressive strength of concrete is achieved so that prestressing forces can be applied. The sooner concrete elements can support their dead and imposed loads (e.g. prestressing), the sooner moulds and forms can be freed and reused, speeding up the production of the elements.
adopted curing technique in precast plants. It is used to heat the concrete either by using steam ‘captured’ in networks of pipes running adjacent to the concrete moulds; or by ‘live’ steam either injected into the concrete mix or in make shift tents erected around the moulds in which concrete is cast.
Heat curing concrete with steam is an inefficient practice and rarely provides controlled curing temperatures to the concrete as recommended in approved codes of practice and standards (ACI306, BS8110). The traditional steam curing systems consume large quantities of fossil fuels and produce large volumes of C 02. For example, a typical precast concrete plant manufacturing 50,000 m3 of concrete per annum consumes 4,000 - 5,000 litres of diesel per day (Tarmac Precast Concrete plant, Tallington). This equates to C02 production of 2,412 tonnes per annum (assuming 2.68 kg of C 02 emitted per litre of diesel consumed). This equates to approximately 0.5 tonnes of C 02 emitted per m3 of concrete produced. A typical precast element is cured for 5 - 18 hours.
A heating medium that conducts heat directly to the concrete rather than heating the concrete moulds via the ambient would provide a more controllable and energy efficient solution for accelerating early age hydration of concrete. This concept is the basis of the following research programme.
1.2. Scope of Research
This research programme will provide direct heat transfer to early age concrete by optimising a unique Conductive Polymer Technology (CPT), developed by the South Yorkshire company, Inditherm pic. The CPT material comprises of a polymer coating loaded with fine carbon particles, to form a conductive compound. The compound is applied to a textile fabric to form a flexible conductive heating membrane.
The CPT material is used to form heating elements of various sizes. The elements are operated by low voltages up to 50 Volts and can achieve temperatures up to 120 deg C. The material can provide a temperature control of +/-1 deg C. CPT elements can be manufactured for small applications such as heated pizza bags or large scale applications such as under pitch heating for sports fields. The heat output of the CPT elements can be changed by altering the width between the conductive rails applied to the material. Electronic control systems can be used with the CPT material to profile the temperature with time.
and its interaction with the CPT temperature will also be considered. The programme will develop CPT curing systems for trials at precast concrete plants and develop guidelines for the design of such curing systems. It is expected that the development of the systems and the greater understanding of the technology will result in commercial opportunity both for the developer of the material and the end users adopting such systems.
1.3. Project Objectives
The project has the following objectives:
I) To gain a full understanding of the hydration of cement within a concrete matrix, reviewing existing curing techniques and literature on concrete curing at elevated temperatures.
II) To evaluate the electrical and thermal properties of the CPT materials including design limitations, design parameters and thermal performance of various CPT materials. Establish some simple, practical design parameters for the use of the CPT for accelerated curing and frost protection of early age concrete.
III) To determine the suitability of CPT for concreting application and to determine the effect of CPT thermal energy input on early age strength and durability, including strength development and shrinkage
IV) To determine the interaction between heat of hydration and CPT thermal input for ‘mass’ concrete samples
V) To determine the performance of CPT curing under cold ambient conditions including cold joints.
VI) To conduct field trials of CPT in a manufacturing environment for accelerated curing of precast concrete.
1.4. Thesis Structure
The thesis structure is as follows:
Chapter 2 presents a review of relevant literature. It reviews various concrete curing techniques and strength development of concrete in environments such as precast concrete manufacturing plants and during cold weather. The chapter evaluates comparable curing technologies to CPT and their suitability for thermal curing.
Chapter 3 presents CPT design fundamentals and electrical configurations including application of electrical theory. It also discusses the primary materials used to manufacture CPT and the potential affects these have on its performance.
Chapter 4 describes the various materials and monitoring equipment used throughout the testing programme, including the design and manufacture of various CPT Jackets and blankets for curing concrete, control units and operating systems and concrete mixes used throughout testing.
Chapter 5 describes the test procedure and presents results on the relationship between resistance, current and operating voltage in order to determine if basic electrical theory can be applied and used for the design of CPT elements. The chapter determines if there is a linear proportionality between the applied voltage to CPT elements and the current passing in order to determine if CPT is an ohmic or non ohmic material.
Chapter 6 describes the test procedure for investigating the heat transfer characteristics of the CPT material into early age concrete for accelerated curing. It determines if CPT Jackets are capable of heating small scale laboratory samples to temperatures comparable to existing curing techniques, such as steam curing at 50 - 70 deg C. The chapter considers what affect CPT curing has on properties such as strength and shrinkage.
Chapter 7 describes the test procedure to determine the suitability of CPT for curing large concrete elements comparable in dimension to those cured in precast plants. The chapter considers the interaction between the heat applied through CPT and the internal heat of hydration developed within a concrete element. The chapter considers different heat curing profiles. It also considers how evenly CPT heats concrete and what affect this has on strength development through concrete elements.
jackets for curing concrete during low ambient winter conditions for the construction of foundation elements and also for use on precast concrete moulds.
Chapter 9 describes the test procedures used to investigate the durability of CPT and cover materials used to manufacture heating jackets for curing concrete. Results reported in this chapter include the impact of freeze thaw cycles, wetting and drying cycles and direct contact of CPT with concrete. The chapter investigates the effect of holes within CPT elements and the exposure conditions on the long term performance of CPT.
Chapter 10 discusses and analyses the results of the various tests undertaken in Chapters 5- 9. It considers the relationships between surface / volume ratio, area heated by the CPT and thermal properties of the concrete elements and strength. The chapter introduces the concept of maturity.
Chapter 2. Literature Review
2.1. Introduction
Concrete is a complex material with many variables affecting its characteristics. Achieving the required properties often requires the use of additives or specified curing techniques. Altering the curing conditions can have a dramatic affect on the strength development and durability of the concrete which can be advantageous in some applications. Good curing provides hydration of cement and, therefore, high strength.
Accelerating the hydration processes of cement has many advantages within the concrete industry and in particular the pre-stressed and precast concrete sectors. Increasing the early strength gain of concrete provides economic benefits by increasing production and reducing production area required (e.g. pre-stressing beds). The early strength development of concrete is critical in the manufacture of precast concrete to enable the elements to be removed from the moulds allowing the moulds to be cleaned and prepared for subsequent elements. Early age strength is particularly important within the prestressed concrete sector (precast or in-situ) of the industry, as an adequately high strength is required before the pre stressing tendons are released to transfer the pre-stress to the concrete. Often this release of prestress is conducted in two stages, the first after 10-15 hours and the second after a period of 3 - 5 days after casting. This process helps to eliminate cracking and improve the ultimate performance of the element. Examples of such elements are car park slabs. These slabs are typically very slender with a low volume / surface ratio, hence, typically do not increase in temperature as a result of hydration and, are therefore, susceptible to low ambient conditions where frost damage may occur. For the purpose of this research thesis the periods early,
medium and long term for concrete elements have been defined in Table 2.1 below.
Early age Medium age Long - term
On-site (insitu) 1-5 days 5 - 2 8 days >28
Precast 5 -2 4 hours 3-10 days >10
Table 2.1. Definition of early, medium and long-term in terms of concrete strength development
2.2. Fundamentals of Concrete
Concrete comprises of aggregate (course and fine), cement and water, mixed in suitable proportions to give the required characteristics. When cement (traditionally Ordinary Portland Cement, OPC) comes into contact with water, a chemical reaction of hydration takes place. Over a period of hours the cement will undergo initial set. The process of hydration continues after initial set, leading to strength gain of the concrete. The strength of concrete carries on increasing for many months, however, the strength at 28 days is usually specified in practice, as by this time a high proportion of the final strength (for most concretes) is achieved. If the process of hydration is accelerated, the 28 day strength developed under standard curing conditions (20 deg C 60% RH) can be achieved more rapidly. This can provide major economic gains in terms of production and project duration. If the specified 28-day strength can be achieved at 12 - 24 hours, productivity of standard elements such as railway sleepers can be increased dramatically.
The main strength and durability controlling parameter of concrete is the water / cement ratio, the lower this ratio the greater the strength, assuming the concrete can be fully compacted. However, at very low water cement ratios the mix is so dry it cannot be fully compacted, and therefore optimum strength cannot be gained. Typically water / cement ratios of 0.4 to 0.5 result in mixes of good workability without admixtures. For acceptable mix design, cement content has to be sufficiently high to provide strength and durability, but not too high to cause problems such as excessive shrinkage or cracking. The range of cement contents used in practice are shown in Table 2.2 (Neville 1995 and Cement and Concrete Association).
Typical Water / Cement Typical cement contents ratio’s
On-site (insitu) Structural 0 .4 -0 .5 350 - 500 kg/m*
Insitu Non structural 0 .45 -0 .6 200 - 350 kg/m*
Precast 0 .2 -0 .5 450 - 500 kg/m*
Table 2.2. Range of cement contents and w/c ratios used for practical mixes (Neville 1995 and Cement and Concrete Association)
Partial replacement of primary concrete constituents such as aggregate or cement with pozzolanic materials such as fly-ash, silica-fume and GGBS is quite common. Although these materials can be extremely advantageous in improving the durability and workability of concrete, their inclusion often retards the early age strength development. This is due to the pozzolanic reaction of these materials, their reaction with CaOH2 being secondary to the hydration reaction of OPC. However, similar to the hydration reaction of cement, this pozzolanic reaction can be accelerated at elevated temperatures. The use of such materials is becoming increasingly common within precast concrete manufacture due to improved performance, economic and ecological pressures. For these reasons their inclusion has been considered throughout this research programme.
2.3. Strength Development of Concrete
Ordinary Portland Cement (OPC) is made from basic materials of lime and clay containing alumina and silicates, which are combined at high temperatures (about 1500 deg C) to produce OPC with the following four major constituent compounds.
Tricalcium silicate 3Ca0.Si02 C3S
Dicalcium silicate 2Ca0.Si02 C2S
Tricalcium aluminate 3CaO. Al20 3 C3A
Tetracalcium aluminoferrite 4Ca0.AI20 3F e20 3 c4a f
These four compounds create calcium silicate hydrate gel (C-S-H) after hydration, forming a solid matrix. The hydration reactions of these compounds are temperature dependant to a greater or lesser extent.
The performance of cement depends on the proportion of glass-like material within the cement clinker. This is controlled by the rate of cooling of the above compounds from high temperatures during manufacture. This affects the degree of crystallisation, and the amount of amorphous (glass like) material present in the cooled clinker prior to it being ground into fine particles (standard OPC or rapid-hardening OPC depending upon its fineness). The rate of cooling of the clinker particularly affects the characteristics of the Dicalcium Silicate compound C2S, which can have up to four forms.
The proportions of the these compounds can be calculated by using the Bogue composition technique (R H Bogue et al (1955)) given by the following
expressions:-% C3S = 4.07(CaO) - 7.60 (Si02) - 6.72(AI20 3) - 1.43(Fe20 3) -2.85(S03) % C2S = 2.87(Si02) - 0.75(3CaO.SiO2)
The Bogue composition method underestimates the amount of Tricalcium Silicate C3S and over estimates Dicalcium Silicate C2S, because other oxides replace some of the Calcium oxide CaO in the C3S. This is because chemically pure C3S and C2S do not occur in Portland cement clinker.
In addition to these four major compounds, there are other minor compounds such as MgO, T i02, Mn03, K20 and Na20. The minor compounds of Na20 and K20 (typically 0.3-1.2% of cement mass), known as alkalis, are of particular interest as they can cause alkali aggregate reaction, leading to disintegration of concrete (Neville A M 1995). These minor compounds are controlled by careful selection of raw materials used to manufacture cements. Typical proportions of the major compounds rapid hardening OPC are given in Table 2.3.
Compound % by weight
C3S 65
C2S 8
c3a 14
c4a f 9
Table 2.3. Typical compound compositions within rapid hardening Portland cement (Czernin 1962)
The very rapid hydration reaction of C3S is retarded by the addition of gypsum, whereas the reaction of C2S is naturally more gradual. It is therefore the hydration reaction of C2S which needs to be accelerated for rapid strength development.
2.4. Hydration of Portland Cement
described as the Ca0:Si02 ratio of the gel. The composition of the C-S-H gels produced during the hydration of the anhydrous silicates changes during the period of the reaction and also varies with the water : cement ratio and the temperature during the hydration reaction. This variation of the development of C-S-H gel with temperature is of particular interest to this research programme.
When finely ground C3S is mixed with water, the reaction for complete hydration can be given
as:-2C3S + 6H = 3C-S-H + 3CH
2(3Ca0.Si02) + 6H20 = 3Ca.2SiO2.3H20 + 3Ca(OH)2
Complete hydration of C3S can take over 1 year. However, the hydration process can be accelerated by increasing the fineness of the compound (Lea Frederick M 1970). An OPC with an increased fineness is referred to as rapid hardening OPC (RHPC) which is frequently used in precast concrete plants to increase early age strength development of concrete elements, particularly if thermal curing options are not available.
The process of hydration of C2S is similar to C3S. C2S, however, produces a C-S-H gel with a lower CaO : S i02 ratio. As with the C3S compounds, hydrated layers are formed on the particles, but the coating of C2S is thicker and increases over time. For complete hydration the reaction can be given
as:-2C2S + 4H = 3C-H-S + CH
2(2Ca0.Si02) + 4H20 = 3Ca0.2Si02.3H20 + Ca(OH)2
The hydraulic reactions for both C2S and C3S are exothermic, therefore, the initial rate of hydration is related to the rate of heat produced. The rate of heat produced is not uniform but peaks at different stages. In summary,
• Tricalcium silicate (C3S). Hydrates and hardens rapidly and is largely responsible for initial set and early strength. Portland cements with higher percentages of C3S will exhibit higher early strength.
• Dicalcium silicate (C2S). Hydrates and hardens slowly and is largely responsible for strength increases beyond one week.
Gypsum is added to Portland cement to retard C3A hydration. Without gypsum, C3A hydration would cause a flash set.
• Tetracalcium aluminoferrite (C4AF). Hydrates rapidly but contributes very little to strength. Its presence allows lower kiln temperatures in Portland cement
manufacturing. Gives colour to Portland cement.
2.5. Thermal Properties of Concrete
The two main characteristics that affect heat transfer through concrete are, i) Thermal Conductivity and ii) Specific Heat Capacity. These can be very different depending upon the age of concrete. At early ages the thermal properties are similar to that of a liquid; whereas as its age and strength increases, the concrete will have thermal properties more comparable to a solid with a crystalline structure.
2.5.1. Thermal Conductivity
The thermal conductivity of concrete, /\c, is the rate of heat transport through it. Two main factors influence the thermal conductivity of concrete, the aggregate type and moisture content. Published values of thermal conductivity vary considerably but are typically within the range 1.0 to 2.5 W/m.K. This range is due in part to the different moisture conditions under which tests have been conducted and in part to the variation of aggregate properties (Clauser and Huenges, 1995) (Ciria 660)
With regard to the prediction of temperature rise in hydrating concrete it is only the moisture content within the first day or so that is important. During this period the volume of free water will be reducing as the cement hydrates and the thermal conductivity will reduce accordingly. It has been reported that the thermal conductivity of maturing concrete is about 33 per cent higher than that of hardened concrete (Ruiz et al, 2003). Based on this observation the CIRIA 660 report proposed the following relationship between thermal conductivity at time, t, Act, and the initial thermal conductivity Aci.
A , = n(1.33 „ n - , r----,--- r- / ciulJ ) [Eq 2.1]
Where;
Aci = the initial thermal conductivity (W/m.K) at time t=0
Act = thermal conductivity at time (t) (W/m.K)
at = the degree of hydration at time t
auit = The ultimate degree of hydration
The initial thermal conductivity can be calculated using a multiphase model from the CIRIA 660 report if the properties of the individual constituents are known. Various models have been used to predict concrete properties, the most common being the series model and the parallel model. The series model is of the form given in equation
2.2:-1 Va Vs Vce Vw
— — 1 1
1---Ac Aa As Ace Aw [Eg 2.2]
The parallel model is given in equation
2.3:-A c — V a.A a4" Vs.As4" Vce.Ace4“ V w .A w [Eq 2.3]
Where;
Ac = Thermal conductivity (concrete)
A a , s , c e , w = Thermal conductivity of each component (aggregate, sand, cement and water)
va , s , c e , w - Volume fraction of each component (aggregate, sand, cement and water) (m3)
Thermal conductivity, W/m.K
Concrete
Rocktype Examples Aggregate Aggregate and
sand Aggregate withsilicious sand
Mean SD 95 %Lower Mean 95 %Lower Mean 95 %Lower
High quartz
content Quartzite 5.8 0.4 5.14 3.2 2.91 3.2 2.91
Metamorphic Low quartz content
Gneisses, hornfels, schist,
slate 2.9 0.6 1.92 1.86 1.37 2.34 2.01
Low in
feldspar gabbroGranite, diorite, 3 0.6 2.02 1.91 1.42 2.37 2.05 Plutonic
High in feldspar
Syenite, grano- syenite, syentite,
syenite porphyry 2.8 0.4 2.14 1.81 1.48 2.31 2.09
Volcanic Low porosity Basalt, rhyolite 2.9 0.7 1.75 1.86 1.28 2.34 1.95
Sedimentary
Chemical
sediments Limeston, dolomite, cherty 2.6 0.7 1.45 1.71 1.12 2.24 1.84 Physical
[image:33.613.51.509.108.360.2]sediments Sandstone 2.4 0.6 1.42 1.61 1.05 2.18 1.83
Table 2.4. Estimated values of thermal conductivity ay early age (5 days) for concretes using different aggregate types. Aggregate data were obtained from Clauser and Huenges (1995)
Aggregate type Thermal conductivity of concrete (W/m.K)
Sand and aggregate from
same rock type Aggregate from defined rock type with siliceous sand
Quartzite and siliceous gravels
with high quartz content 2.9 2.9
Granite, gabbros, hornfels 1.4 2.0
Dolerite, basalt 1.3 1.9
[image:34.613.105.453.42.164.2]Limestone, sandstone, chert 1.0 1.8
Table 2.5. Proposed values of thermal conductivity of concrete for use in early age thermal modelling (CIRIA 660 Appendix 2)
2.5.2. Specific Heat Capacity
The specific heat of concrete is determined by the specific heat of the individual components and their relative proportions. It has been reported that the range for mass concrete may vary from 0.75 to 1.17 kJ/kg deg C (USACE, 1997). This is a very significant variation, indicating that the temperature rise associated with a particular amount of heat input may vary by as much as ± 20 per cent from a mean value of about 0.96 kJ/kg deg C. It is important that a representative value is used in any model for temperature prediction.
Two factors in particular influence the specific heat of concrete, the aggregate type and the water content, the former because it constitutes the largest proportion of the mass and the latter because it is the component with the highest specific heat (greater than 4 times that of the other mix constituents). Reported values of specific heat for rocks range from 0.8 to 1.0 kJ/kg deg C and for a typical structural concrete this variation alone may result in values from 1.0 to 1.15 kJ/kg deg C. Dealing with the water content is more complicated as the specific heat differs for free water (4.18 kJ/kg deg C) and bound water (2.22 kJ/kg deg C) in concrete. To calculate the specific heat for concrete it is necessary to know the relative amounts of free and bound water and this is determined by the degree of hydration.
Specific heat (kJ/kg.C) 0.97 x.
0.99
0.8
1.01 o
■a 1.04
5 0.6
i
1.070.4
0.3
0.2
450 500
250 300 350 400
200
Cement content (kg/m3)
Figure 2.1. The relationship between cement content, w/c ratio and early-age specific heat (assuming the specific heat of the aggregate is 0.8 kJ/kg°C) (CIRIA 660)
2.6. Heat of Hydration
Of the four major strength developing compounds identified in sections 2.3 and 2.4, the reaction of Tricalcium aluminate C3A is the fastest. The speed of the reaction of C3A is often slowed down by the addition of gypsum (CaS04.2H20). Gypsum is added to the cement clinker to stop flash setting of the cement paste. However, the purity of the gypsum and free alkalis within the gypsum can cause alkali silica reaction and also influence the false set. When gypsum is not present within the system, C3A reacts with water to form a variety of crystalline hydration products, C3AH6 being the ultimately stable hydration product.
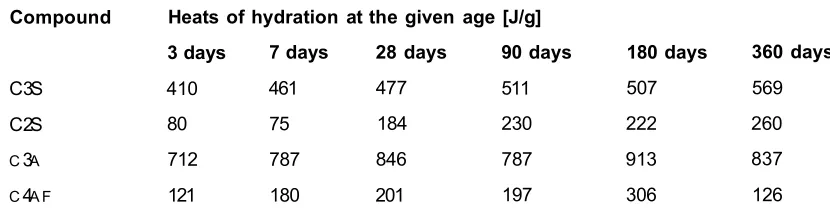
The resulting heat of hydration of the four major compounds for typical CEM I (OPC) is given in Table 2.6.
Compound Heats of hydration at the given age [J/g]
3 days 7 days 28 days 90 days 180 days 360 days
C3S 410 461 477 511 507 569
C2S 80 75 184 230 222 260
c3a 712 787 846 787 913 837
[image:35.612.101.464.44.268.2]c4a f 121 180 201 197 306 126
Table 2.6. Heat of hydration of the four major compounds of cement clinker LOVACS Mid term reports - 2 UMM (Warszawa 1991)
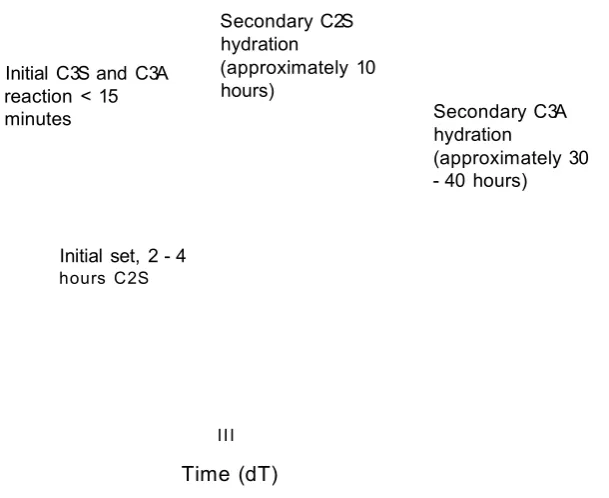
[image:35.612.69.484.519.627.2]generated by hydrating cement. Figure 2.2 shows the typical profile of heat generated with time.
Initial set, 2 - 4
hours C2S
Initial C3S and C3A reaction < 15 minutes
Secondary C2S hydration
(approximately 10 hours)
Secondary C3A hydration
(approximately 30 - 40 hours)
[image:36.613.152.457.81.330.2]III Time (dT)
Figure 2.2. Heat generated due to cement hydration within a typical concrete mix
The heat of hydration curve is split into five sections, these
are:-I. The initial reaction (typically 1 5 -3 0 minutes) II. Induction (typically 1 - 4 hours)
III. Acceleratory period (typically 4 - 1 0 hours) IV. Deceleratory period (typically beyond 10 hours)
2.7. Acceleration of the Hydration Reaction with Temperature
The hydration reactions of the four major compounds within cement clinker are temperature dependant. The external temperature during hydration can greatly affect the degree of hydration of cement within a concrete mix as shown in Table 2.7, (Lerch W and C L Ford).
Cement Heat of Hydration developed
J/g cal/g J/g cal/g J/g cal/g J/g cal/g
I 154 36.9 285 68.0 309 73.9 335 80.0
III 221 52.9 348 83.2 357 85.3 390 93.2
IV 108 25.7 195 46.6 192 45.8 214 51.2
Table 2.7. Heat of Hydration developed after 72 hours (3 days) at different temperatures (Lerch W and Ford C L)
Table 2.7 shows that for a typical Type-1 cement the heat generated by hydration can be more than doubled by increasing the curing temperature from 4 deg C to 41 deg C.
The results of Table 2.7 are of particular importance to this study as they show that by efficiently providing uniform heat to concrete at early ages (less than three days), the degree of hydration of cement can be accelerated and thus the rate of strength gain accelerated. It also indicates that once the hydration reaction is triggered by external heat, the internal heat generated by cement hydration within a concrete element will further accelerate hydration resulting in rapid strength gain, particularly if the concrete element is well insulated.
Because the heat given out during hydration progresses over time, and the rate of this progression is dependent on temperature, it is possible to estimate the extent of hydration by tracking time and temperature. This is the concept of maturity and will be considered in greater detail in section 2.17 following the review of existing curing techniques, and the introduction to CPT technology.
2.8. Temperature Effects on Concrete
Typically, increasing the temperature of concrete during early ages increases the early strength by speeding up the hydration reaction. However, increasing the early strength of concrete through high temperature curing is thought to have an adverse affect on the quality of the concrete, resulting in a more porous concrete. (Neville A M 1995).
Figure 2.3 shows one day and 28 day strengths of concrete samples cured at temperatures ranging from 1 2 -5 0 deg C.
104 122
- - 7000 Age of Concrete:
- - 6000
28 days: Compressive
strength MPj, - - 5000
- - 4000
3000
1 days
' " 2000
" " 1 0 0 0
Curing temperature (deg C)
Figure 2.3. Influence of curing temperature on compressive strength at 1 and 28 days (specimens tested after cooling to 23 deg over a period of two hours) GJ Verbeck and RA Helmuth 1968)
Figure 2.3 shows that when using high temperature curing, leads to lower long-term (28 day) strength of concrete, while increasing the rate of early age (1 day) strength gain. Therefore, there is a requirement for a compromise between the loss of longer term strength and the gains in the efficiency of the manufacturing process provided by rapid strength development.
The use of high temperature curing is beneficial for concretes containing pozzolanic materials as partial replacement of OPC. The secondary hydration of such materials is slower than OPC but has the advantage of reducing costs and improving the workability and durability of the mix. Using high temperature curing increases the rate of hydration of such materials.
Steam curing is the primary method of heating concrete at early ages to accelerate the rate of strength development.
2.8.1. Delayed Ettringite Formation
Ettringite otherwise known as calcium sulphoaluminate, is found in all portland cement concretes. Calcium sulphate sources, such as gypsum, are added to Portland cement to prevent rapid setting and improve strength development they are also present in supplementary cementitious materials and admixtures such as gypsum and other sulphate compounds react with calcium aluminate in the cement to form ettringite within the first few hours after mixing with water. Essentially all of the sulphur in the cement is normally consumed to form ettringite within 24 hours. The formation of ettringite results in a volume increase in the fresh, plastic concrete. Due to the concrete’s plastic condition, this expansion is harmless and unnoticed. However, the early age formation of ettringite can become an issue if the strength development of concrete is accelerated and the concrete makes the transition from plastic to chrystaline structure before the formation of ettringite (Portland Cement association 2001)
Delayed ettringite formation refers to a condition usually associated with temperature cured concrete exposed to temperatures over approximately 70°C. Following exposure to such temperatures at early ages, the concrete can undergo expansion and cracking caused by later ettringite formation. This occurs due to high temperature decomposition of any initial ettringite formed and holds the sulphate and alumina tightly in the calcium silicate hydrate (C- S-H) gel of the cement paste. The normal formation of ettringite is thus impeded.
Over time and in the presence of moisture the sulphate and alumina (ettringite) can dissolve from the confines of the C-S-H to form ettringite in cooled and hardened concrete. After months or years the ettringite can form in confined locations within the paste. Since the concrete is rigid and if there are insufficient voids to accommodate the ettringite volume increase, expansion and cracks can occur. In addition, some of the initial ettringite formed before heating may be converted to monosuphoaluminate at high temperatures and upon cooling, revert back to ettringite. Because ettringite takes up more space than monosulphoaluminate from which it forms, the transformation is an expansive reaction resulting in deleterious cracking (RL Day 1992). When considering the application of CPT for accelerated thermal curing of concrete, the presence and consequence of ettringite formation has to be kept in mind.
Steam curing under atmospheric pressure is currently the preferred method of elevated temperature curing within the precast and prestressed sectors of the industry, as it is suited to high volume productions for a variety of concrete units (Patel H H 1996). Steam curing at atmospheric pressure is restricted to temperatures below 100 deg C. The two most commonly used methods are ‘free’ steam in conjunction with large curing chambers and ‘captive steam’. Free steam is applied directly to the exposed and mould surfaces of the concrete. Typically this is conducted in low pressure steam curing chambers or tunnels often transporting the concrete members to be cured on conveyor belts (Neville A M 1995). Figure 2.4 shows the use of live steam to cure a concrete pipe in a typical precast concrete plant.
Figure 2.4. Free steam curing of prestressed pipes (Picture courtesy of Prefabet Precast Concrete Ltd)
The captive steam method usually comprises of portable boxes or plastic covers placed over precast members with steam being introduced through flexible pipes running beneath the forms or the moulds. The aim is to reduce the loss of heat away from the mould and concrete. This is of particular significance in the United Kingdom where the majority of precast concrete plants are located in open sided factories allowing breeze with a cooling effect to pass the moulds, particularly in winter. This is comparable to cold weather concreting on site. Figure 2.5 shows captive steam pipes fixed adjacent to a concrete mould.
particularly extensive, steam at the end of the network can be at temperatures below 30 deg C, or even condense back to water within the pipe. The primar