ORIGINAL RESEARCH
ADULT BRAIN
Diffusion-Weighted Imaging for Predicting and Monitoring
Primary Central Nervous System Lymphoma Treatment
Response
XW.-Y. Huang,XJ.-B. Wen,XG. Wu,XB. Yin,XJ.-J. Li, andX D.-Y. Geng
ABSTRACT
BACKGROUND AND PURPOSE: Whether ADC value predicts the therapy response and outcomes of primary central system lymphoma remains controversial. This study assessed the minimum ADC correlated with treatment response in patients with primary central nervous system lymphoma undergoing methotrexate-based chemotherapy.
MATERIALS AND METHODS: Thirty-five patients with primary central nervous system lymphoma underwent conventional MR imaging and DWI before chemotherapy and after 1 and 5 cycles of chemotherapy. Treatment response was determined according to the International PCNSL Collaborative Group criteria and was classified as a complete response, partial response, or progressive disease. Pretreatment minimum ADC, minimum ADC after 1 cycle, minimum ADC after 5 cycles, and change in minimum ADC were compared among the different response groups. The Pearson correlation test was calculated between these ADC parameters and tumor response.
RESULTS:The pretreatment minimum ADC of the progressive disease group was lower than that of the complete response and partial response groups, but there was no significant difference among them. The minimum ADC after 1 cycle and minimum ADC after 5 cycles were statistically significantly higher than the pretreatment minimum ADC. A comparison among groups showed that minimum ADC after 1 cycle, minimum ADC after 5 cycles, minimum ADC change, and the percentage of minimum ADC change were all significantly different among the 3 groups. A significant positive correlation was observed between the percentage of minimum ADC after 1 cycle of chemo-therapy and the size reduction percentage after 5 cycles of chemochemo-therapy. The minimum ADC change and the percentage of minimum ADC change performed better in the differentiation of the final treatment response, specifically in complete response and partial response from progressive disease.
CONCLUSIONS: The minimum ADC after 1 cycle and minimum ADC changes were better correlated with the treatment response than the pretreatment minimum ADC. Minimum ADC after early therapy may potentially to be used to predict and monitor the response of primary central nervous system lymphoma to chemotherapy.
ABBREVIATIONS:ADCmin⫽minimum ADC; ADCminearly⫽ADCmin after 1 cycle; ADCminpre⫽pretreatment ADCmin; CR⫽complete response; PCNSL⫽ primary central nervous system lymphoma; PD⫽progressive disease; PR⫽partial response
P
rimary central nervous system lymphoma (PCNSL) is a rare subtype of non-Hodgkin lymphoma, which is confined to the brain, eyes, and/or leptomeninges. The overall incidence of PCNSL in the immunocompetent population has been increasing during the past several years, and it is one of the few malignantprimary brain tumors that is sensitive to both chemotherapy and radiation therapy.1,2 Methotrexate-based chemotherapy is the cornerstone of therapy in PCNSL, while whole-brain irradiation is recommended for patients with recidivation. Patients who are at low risk of tumor recidivation may benefit from methotrexate-based chemotherapy alone. On the contrary, high-risk patients may require further chemotherapy and/or whole-brain irradia-tion for consolidairradia-tion of the response.3,4
Until recently, no proved imaging biomarkers could
indi-Received February 2, 2016; accepted after revision May 11.
From the Departments of Radiology (W.-Y.H., J.-J.L.) and Radiotherapy (G.W.), Hainan General Hospital, Haikou, Hainan, China; and Department of Radiology (J.-B.W., B.Y., D.-Y.G.), Huashan Hospital, Fudan University, Shanghai, China.
Wei-Yuan Huang and Jian-Bo Wen contributed equally to this work and should be considered co-first authors.
This research was supported by funding from the National Key Discipline Project, the Hainan Provincial Key Foundation Project (ZDXM2015066), and the National Natural Science Foundation of China under grant No. 81471627.
Please address correspondence to Jian-Jun Li, MD, Department of Radiology, Hainan General Hospital, No. 19 Xiuhua Rd, Xiuying District, Haikou, Hainan, China;
e-mail: lijianjunhngh@163.com; Dao-Ying Geng, MD, Department of Radiology, Huashan Hospital, Fudan University, No. 12 Wulumuqi Rd, Jing’an District, Shanghai, China; e-mail: gengdaoying2245@163.com
Indicates open access to non-subscribers at www.ajnr.org
cate tumor refractoriness to methotrexate-based chemother-apy and predict therapeutic outcomes in PCNSL treatment. Such biomarkers would provide clinicians with strong evi-dence for making clinical decisions, which might generate the early start of second-line salvage therapy in high-risk patients with PCNSL and likely contribute to personalized therapeutic strategies to detect tumor recurrence without delay and im-prove prognosis.5
Noninvasive MR diffusion-weighted imaging of the brain is based on the differential diffusion rates or the Brownian mo-tion of water. It is an essential technique used to diagnose acute infarct in the brain, due to its ability to detect cytotoxic edema derived by altered water diffusion due to cellular damage. DWI has also been widely used in neuro-oncology to assess tumor pathology characteristics.6Specifically, the apparent diffusion coefficient values derived from DWI have been shown to cor-relate with tumor cellularity, glioma grade, and treatment re-sponse.6-9Some previous research has also suggested that pre-therapeutic ADC values in tumor may be biomarkers noninvasively predictive of treatment response in patients with PCNSL.5However, a number of other studies have not shown tumor ADC metrics to be predictive of response.10
To our knowledge, no research has reported whether dy-namic changes of ADC values are related to treatment re-sponses in patients with PCNSL. Thus, we assessed pre- and posttherapeutic ADC values in responsive or prognostic sub-groups of patients with PCNSL in an effort to identify which tumors may experience recurrence and disease progression at an early stage.
MATERIALS AND METHODS
Patient PopulationThirty-five patients with biopsy-proved PCNSL (26 men, 9 women; mean age, 58 ⫾ 15 years; all immunocompetent) treated at the Huashan Hospital of Fudan University between October 2007 and February 2010 were selected for this retro-spective study.
Inclusion criteria were patients being 18 years of age or older; histologic confirmation of PCNSL by stereotactic needle biopsy; serology negative for human immunodeficiency virus; no evi-dence of systemic non-Hodgkin lymphoma as demonstrated by PET-CT or CT of the chest, abdomen, and pelvis and bone mar-row aspirate and biopsy; and baseline laboratory values being leu-kocytesⱖ4000/L, plateletsⱖ100,000/L, and creatinineⱕ1.5 mg/dL or creatinine clearanceⱖ50 cm3/min/1.73 m2without any
corticosteroids before treatment. All patients had a pathologic
diagnosis of diffuse large B-cell PCNSL as defined by the World Health Organization and received methotrexate-based induction chemotherapy. Of the 53 patients who met the inclusion criteria for this investigation, 48 were studied on the basis of having un-dergone pretherapeutic contrast-enhanced MR imaging of the brain with DWI. Furthermore, 35 of the 48 patients had prethera-peutic, interval, and posttreatment follow-up contrast-enhanced MR imaging of the brain with DWI. Exclusion criteria consisted of any other active primary malignancy, preexisting immunode-ficiency, and prior treatment for PCNSL. Pretreatment evalua-tions included baseline ophthalmologic examination (including dilated fundus examination, slit lamp examination, and color photography of the posterior pole) to assess ocular involvement and lumbar puncture to assess leptomeningeal involvement.
Treatment and Response Evaluation
Each methotrexate treatment cycle was administered in the hos-pital setting. Every patient received methotrexate-based chemo-therapy, including methotrexate, 3– 8 g/m2/day 1,⫹
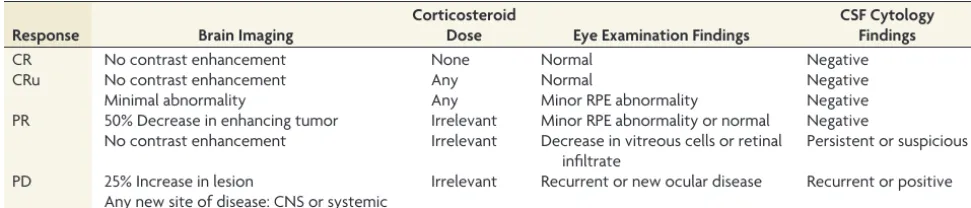
dexametha-sone, 15 mg/days 1–3,⫹idarubicin, 15 mg/day 2 and every 21 days for 5 cycles. The response was assessed by using the Interna-tional PCNSL Collaborative Group criteria, based on imaging, corticosteroid use, CSF cytology, and slit lamp examination in cases of CSF or ocular involvement (Table 1).11Patients who achieved a complete response (CR) were defined as having reso-lution of contrast-enhancing lesions on follow-up MR imaging and, if indicated, by CSF cytologic analysis (if the CSF cytology was positive for malignant cells at the time of diagnostic staging). Patients who achieved a partial response (PR) were defined as an interval decrease in contrast-enhancing lesion volume. Progres-sive disease (PD) were defined as an interval increase in contrast-enhancing lesion volume or the development of new contrast-enhancing lesions on follow-up contrast-enhanced MR imaging or involve the eye or CSF.5All follow-up imaging was performed no longer than 2 weeks after completion of all planned therapy to assess overall treatment response.12
MR Imaging Protocol
Patients underwent MR imaging before receiving their first course of therapy (pretreatment); at an earlier stage of⬍48 hours after the end of the patient’s first chemotherapy cycle, as indicated by the last chemotherapeutic injection (early treat-ment); and at the completion of all the standard treatments associated with the regular review of clinical time (postment). None of the patients had begun corticosteroid treat-Table 1: Response criteria for primary central nervous system lymphoma
Response Brain Imaging
Corticosteroid
Dose Eye Examination Findings
CSF Cytology Findings
CR No contrast enhancement None Normal Negative
CRu No contrast enhancement Any Normal Negative
Minimal abnormality Any Minor RPE abnormality Negative
PR 50% Decrease in enhancing tumor Irrelevant Minor RPE abnormality or normal Negative No contrast enhancement Irrelevant Decrease in vitreous cells or retinal
infiltrate
Persistent or suspicious
PD 25% Increase in lesion Irrelevant Recurrent or new ocular disease Recurrent or positive Any new site of disease: CNS or systemic
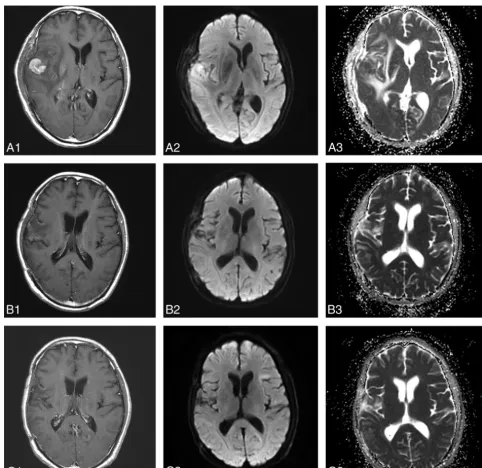
[image:2.594.52.538.56.160.2]FIG 1. MR images in a 54-year-old man with diffuse large B-cell PCNSL, belonging to the CR group (A1,A2,A3, before therapy;B1,B2,B3, after 1 cycle of chemotherapy;C1, C2,C3, after 5 cycles of chemotherapy). Contrast-enhanced T1-weighted image shows an apparent enhanced tumor on the right temporal lobe (A1). The tumor shows hyperintense on the DWI (A2,B2). The pretherapeutic ADCmin of the tumor was 668⫻10⫺6 mm2/s (A3). After 1 cycle of chemotherapy, the size of tumor has decreased significantly (B1,B2) and the ADCmin of the tumor has increased to 1014⫻10⫺6 mm2/s (B3). After 5 cycles of chemotherapy, the tumor has almost disappeared (C1), and the ADCmin has increased to 1026⫻10⫺6 mm2/s (C2,C3).
Table 2: Comparison of ADCmin values among CR, PR, and PD groupsa
No. ADCminpre ADCminearly ADCminpost ADCmin Changeb Percentage ADCmin Changec
CR 12 566.56⫾120.84 849.09⫾182.45 858.06⫾185.89 282.54⫾110.40 51.17⫾21.44
PR 15 487.54⫾78.00 669.73⫾130.28 677.14⫾131.47 182.19⫾88.28 37.52⫾20.02
PD 8 476.13⫾93.36 456.65⫾93.36 432.55⫾88.85 ⫺19.49⫾13.46 ⫺4.17⫾2.60
Total 35 512.03⫾103.15 682.52⫾203.52 683.26⫾213.34 170.50⫾142.03 32.68⫾27.67
Pvalue .072 .000 .000 .000 .000
CR-PR .045 .003 .003 .006 .63
CR-PD .051 .000 .000 .000 .000
PR-PD .792 .002 .001 .000 .000
Note:—ADCminpostindicates ADCmin after 5 cycles. a
All ADC values are reported as 100⫻10⫺6 mm2
/s. Data are means. b
ADCmin Change⫽ADCminearly⫺ADCminpre. c
[image:3.594.51.534.198.667.2]ment, radiation therapy, or chemotherapy or had a previous brain biopsy at the first MR imaging.
All patients were imaged by using a 3T clinical MR imaging scan-ner (Tim Trio; Siemens, Erlangen, Germany). MR imaging exami-nations included conventional contrast-enhanced T1-weighted im-aging and DWI sequences obtained according to a standardized protocol: axial T1-weighted spin-echo (TR/TE, 2000/17 ms), axial T2-weighted fast spin-echo (TR/TE, 3000/98 ms), axial fluid-atten-uated inversion recovery (TR/TE/TI, 8000/102/2200 ms), axial diffu-sion-weighted echo-planar imaging (TR/TE, 5000/82 ms; section thickness/intersection gap, 5/0 mm; matrix size, 130⫻130; FOV,
20⫻23 cm; 3 directions; b-value, 0 and 1000 s/mm2) acquired in the
transverse plane throughout the infratentorial and supratentorial brain, and contrast-enhanced T1-weighted imaging. Gd-DTPA (Magnevist; Bayer HealthCare Pharmaceuticals, Wayne, New Jersey) was the intravenous contrast agent for the MR imaging study at 0.1 mmol/kg of body weight.
MR Image Processing
[image:4.594.55.533.47.526.2]The ADC map was calculated from DWI, by using software provided by the manufacturer (syngo; Siemens). ROIs were man-ually placed within the solid components of the tumor. The ROIs were as large as possible and were placed to avoid areas of cystic, necrotic, or hemorrhagic components in the tumor. Each neuro-radiologist drew 3 ROIs to obtain the minimum ADC (ADCmin). The minimum ADC value among these values was chosen as the result. An average of the results of 2 neuroradiologists was used as the patient’s ADCmin. When multifocal lesions were observed, the ADCmin was measured for each lesion and the mean ADCmin was calculated for multifocal lesions (⬍5 lesions).
The volumetric response of tumors to treatment was evaluated according to the Response Evaluation Criteria In Solid Tumors criteria.13The longest tumor diameter before and after treatment was measured on axial contrast-enhanced T1-weighted images, and the change of tumor diameter was calculated according to the following equations: Change in Tumor Diameter ⫽ Diameterpre⫺Diameterpost; Percentage of Change in Tumor
Di-ameter⫽(Diameterpre⫺Diameterpost)/Diameterprewith “pre”
and “post” indicating before and after.
[image:5.594.57.529.45.527.2](ADCminearly)⫺pretreatment ADCmin (ADCminpre); Percentage
of Change in ADCmin ⫽ (ADCminearly ⫺ ADCminpre)/
ADCminpre.
If the enhancing lesion was not detected after chemotherapy, then the ROIs were defined in the area where the tumor was ini-tially present.
Statistical Analysis
Statistical analyses were performed by using statistical software (SPSS, Version 13.0; IBM, Armonk, New York). The intraclass correlation coefficient of ADCmin measure between the 2 radiol-ogist was calculated. One-way analysis of variance was used to compare pretreatment ADCmin values, changes in ADCmin val-ues, tumor diameter, and changes in tumor diameter among the CR, PR, and PD groups, and the comparison among groups was performed by using the least significant difference method for the post hoc evaluation. Linear regression models were used to examine size change and ADC measures. The Pearson correlation was per-formed to determine whether the pretreatment mean ADCmin value and percentage ADCmin change of the tumor after 1 month of chemotherapy were significantly related to the percentage size reduction of the tumor after chemotherapy. The differences be-tween pretreatment and posttreatment ADC values as well as pre-treatment and postpre-treatment tumor diameters were calculated by using a paired-samplesttest. APvalue⬍.05 was a statistically significant difference.
RESULTS
Thirty-five patients with PCNSL were enrolled in this study. The mean pretreatment diameter of the tumors was 5.07⫾2.02 cm (range, 1.75–11.02 cm). Standard International PCNSL Collabor-ative Group criteria follow-up of the tumor response classified 12 patients as having CR, 15 patients as having PR, and 8 patients as having PD. The intraclass correlation coefficient of ADC mea-sures between the 2 radiologists was 0.73.
Pretreatment Prediction of Therapeutic Response
The pretreatment tumor diameter of the PR (n⫽15) group was larger than that of the CR (n⫽12) and PD (n⫽8) groups, but there was no significant difference among them (F⫽1.17,P⫽
.33). The pretreatment ADCmin of the PD group was lower than that in the CR and PR groups, but there was no significant differ-ence among them (F⫽2.87,P⫽.07) (Table 2).
Monitoring and Early Assessment of Therapeutic Response
The mean ADCmin value for the CR and PR groups increased to different extents during chemotherapy (Table 2). For the CR group, the mean ADCmin value after 1 cycle of chemotherapy increased by 49.9%, and it was statistically significantly higher than the pretreatment ADC value (P⬍.001). The ADCmin value after 1 cycle and after 5 cycles of chemotherapy was statistically significantly higher than the pretreatment values (P⬍.001,P⬍
.001), but there was no statistically significant difference between the ADCmin values after 1 and 5 cycles of chemotherapy (P⫽.17) (Fig 1).
For the PR group, the ADCmin value after therapy increased
Response PD PR CR 800 600 400 200 0 -200 35 3 ADCminchange ADCminpre Response PD PR CR
Percentage of ADCmin change (%)
100.00 80.00 60.00 40.00 20.00 .00 -20.00 6 28
Percentage of ADCmin Percentage of diameter change Percentage of diameter change Percentage of diameter change Percentage of ADCmin Percentage of diameter change Percentage of diameter change Percentage of diameter change
Percentage of diameter change (%)
100.00 50.00 .00 -50.00 -100.00 800.00 600.00 400.00 200.00 .00 -200.00
A
B
C
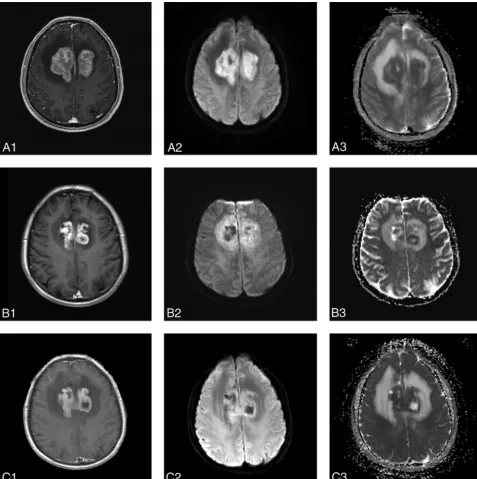
[image:6.594.301.530.39.604.2]gradually, though the increments were relatively small. The ADCmin values after 1 cycle and after 5 cycles of chemotherapy were statistically significantly higher than the pretreatment values (P ⬍.001,P⬍.001), but there was no statistically significant difference between ADCmin values after 1 and 5 cycles of chemo-therapy (P⫽.60) (Fig 2).
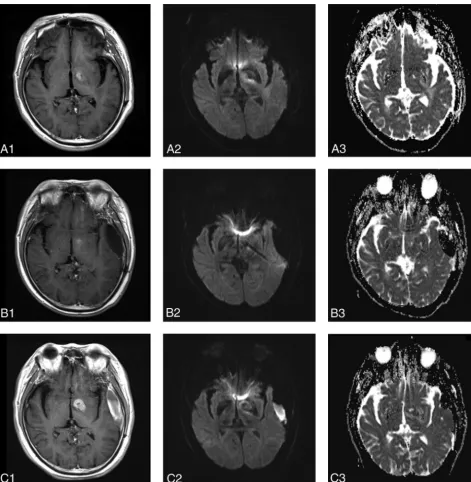
The mean ADCmin value for the PD group decreased slightly or showed no obvious change during chemotherapy. The post-treatment ADCmin values for the patients with PD appeared to increase slightly compared with the pretreatment ADCmin val-ues. The ADCmin values after 1 and 5 cycles of chemotherapy were statistically significantly higher than pretreatment values (P⫽.01,P⫽.04), but there was no statistically significant differ-ence between the ADCmin values after 1 and 5 cycles of chemo-therapy (P⫽.28) (Fig 3).
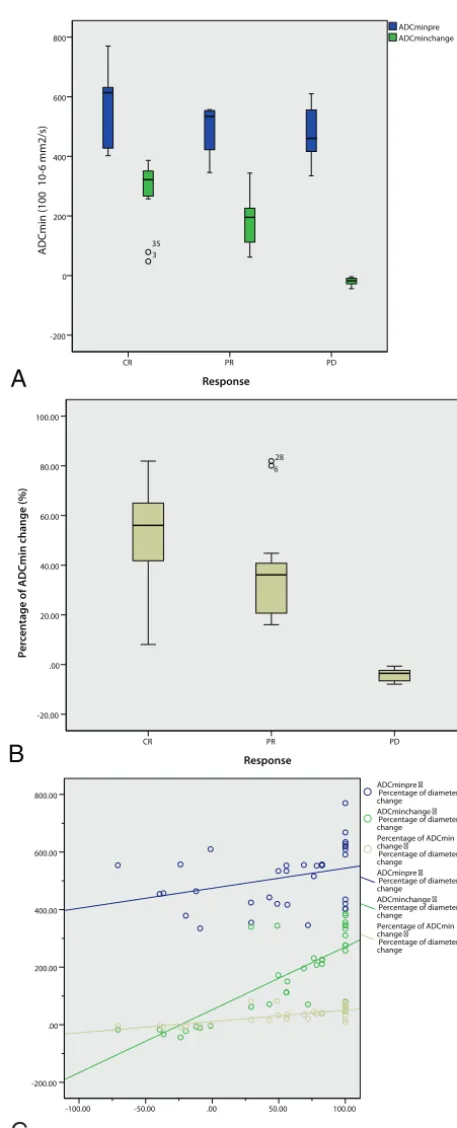
The comparison among groups showed that ADCminearly,
ADCmin after 5 cycles, ADCmin change, and percentage of ADCmin change were all significantly different among the 3 groups (CR, PR, and PD). Specifically, the mean percentage of ADCmin changes of the tumors after 1 cycle of chemotherapy was 55.68% for CR, 37.52% for PR, and⫺3.78% for PD, and there was a significant difference among these values (F ⫽
22.10, P ⬍ .001) (Table 2). Comparison of pretreatment ADCmin, ADCmin early change, and percentage ADCmin change indicated that the ADCmin change and percentage ADCmin change performed better in differentiating the final treatment response, specifically differentiating the CR and PR groups from the PD group (Fig 4A,-B).
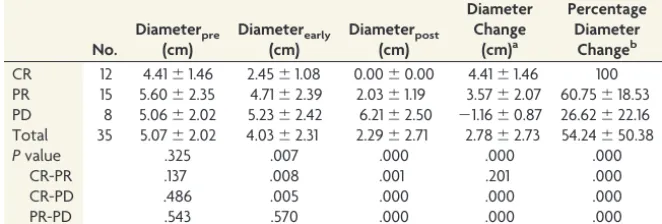
The mean percentage diameter of early changes of the tumors after 5 cycles of chemotherapy was 46.43% for CR, 20.83% for PR, and⫺1.46% for PD, and there was a significant difference among these values (F⫽22.10,P⬍.001) (Table 3).
A positive correlation was observed between ADCminpreand
the size reduction percentage after 5 cycles of chemotherapy (Pearson coefficient, 0.34;P⫽.05). In addition, a significant pos-itive correlation was observed between the early ADCmin changes, early percentage of ADCmin changes after 1 cycle of chemotherapy, and size reduction percentage after 5 cycles of che-motherapy (Pearson coefficient, 0.58,P⬍.001; 0.72,P⬍.001, respectively) (Fig 4C).
DISCUSSION
Traditionally, an assessment of solid cancer therapy effectiveness relies on comparison of changes in tumor size by images obtained before and after the therapeutic intervention. However, tumor
size measurement by using images (CT or MR imaging) is insensitive to early treatment changes and cannot monitor changes in tissue structure at the cellular level.14DWI can detect relatively small changes in tissue structure at the cellular level because it is specifically sensitive to cellular status, density, and microstruc-tural organization.15 The combination of DWI with conventional MR imaging enables morphologic and physiologic changes to be assessed during the same examination. The extremely high DWI signal intensity is characteristic of MR imaging findings in PCNSL due to the high cell density, and cell density has a great differential value for tumors of the brain.16,17Previous studies have shown a significant inverse correlation between cellularity and ADC values in PCNSL, suggesting ADC as a surrogate marker of tumor pro-liferation.17ADC has shown promise in the prognostication of response to therapy for non-Hodgkin lymphoma, even if not technically in the central nervous system.18DWI-derived ADC values provide an opportunity to quantitatively and serially follow treatment-induced changes in PCNSL, and specifically, ADCmin values were more powerful than ADC mean or ADC 25% values.5 Here, we aimed to confirm the validity of ADCmin measurement as an imaging biomarker of therapy response in immunocompe-tent patients with PCNSL.
The validity of pretherapeutic ADC as a predictor of clinical outcomes in patients with PCNSL remains controversial. Several studies have proposed that the lower the pretherapy baseline tu-mor ADC values, the shorter the progression-free survival and overall survival in patients with lymphoma.6,5,19However, a new study showed no association between a higher baseline ADC and CR, and no differences were observed in progression-free survival or overall survival according to the baseline ADC among the CR, PR, and PD groups.10
In our study, the pretherapeutic ADCmin of the PD (476.14⫾ 93.36 ⫻ 10⫺6 mm2/s) group was lower than that in the CR
(566.56⫾120.84⫻10⫺6mm2/s) and PR (487.54⫾78.00⫻10⫺6
mm2/s) groups; however, there was no significant difference
among these values. The mean percentage of ADCmin change of the tumor after 1 cycle of chemotherapy was 55.68% for CR, 37.52% for PR, and⫺3.78% for PD, and there was a significant difference observed among them. Our results indicate that the ADCmin changes and percentage changes after early therapy could more precisely predict treatment response than the pretreat-ment ADCmin value. Although tumors with higher pretherapeutic ADC values and lower signal intensity at DWI responded better to treatment, neither the pretherapeutic diameter nor pretherapeutic ADCmin could completely predict the PCNSL outcome from methotrexate-based chemotherapy. A possible explanation is that pretherapeutic cellularity cannot precisely reflect the treatment response. However, cellularity reduction caused by chemotherapy drugs increases ADCmin. Thus, posttherapeu-tic ADCmin growth might indicate the later tumor regression or decelerated growth and enable early detection of tumor re-sponse. Change is a better assessment strategy based on pre-Table 3: Comparison of tumor diameter among CR, PR, and PD groups
No. Diameterpre (cm) Diameterearly (cm) Diameterpost (cm) Diameter Change (cm)a Percentage Diameter Changeb
CR 12 4.41⫾1.46 2.45⫾1.08 0.00⫾0.00 4.41⫾1.46 100 PR 15 5.60⫾2.35 4.71⫾2.39 2.03⫾1.19 3.57⫾2.07 60.75⫾18.53 PD 8 5.06⫾2.02 5.23⫾2.42 6.21⫾2.50 ⫺1.16⫾0.87 26.62⫾22.16 Total 35 5.07⫾2.02 4.03⫾2.31 2.29⫾2.71 2.78⫾2.73 54.24⫾50.38
Pvalue .325 .007 .000 .000 .000
CR-PR .137 .008 .001 .201 .000
CR-PD .486 .005 .000 .000 .000
PR-PD .543 .570 .000 .000 .000
a
Diameter Change⫽Diameterpre⫺Diameterpost. b
[image:7.594.52.383.59.171.2]theraputic data. Another explanation is the lack of sufficient statistical power due to the relatively small sample size.
Previous studies have confirmed that effective anticancer treatment resulted in an increase in water diffusion. Studies with animal models found that chemotherapy increased the tumor ADC value within days through reducing cellularity as a result of apoptosis and/or cell death.20,21The ADC value also rose with greater histologic changes (such as a progressive increase in tumor extracellular space and an increase in pleomorphism, giant cells, and cells with the characteristic morphologic features of apopto-sis) because water mobility was increased by the greater extracel-lular space and membrane permeability.22
In this study, the mean ADCmin values for patients with CR and PR all increased after treatment.13,23,24The posttreatment ADCmin values of the CR group increased rapidly compared with the pretreatment values. In the PR group, the ADCmin value changed moderately, while in PD, it changed slightly and even decreased slightly after therapy. The percentage ADCmin change of the tumor after 1 cycle of chemotherapy correlated positively with the percentage size reduction of the tumor after 5 cycles of chemotherapy; this finding suggests that significant changes in tumor ADCmin values that occurred after treatment might indi-cate a better response to therapy. However, a minute change in tumor ADCmin values might indicate a less satisfactory outcome or even a therapeutically unresponsive tumor.
One hypothesis is that successful treatment of a tumor will result in significant damage to tumor cells in the form of a loss of cell membrane integrity with a subsequent reduction in tumor cell density. We observed that necrosis appeared in the center of the lesion in some cases after therapy, suggesting increases in the movement of water molecule diffusion, resulting in changes in tumor ADC values. Moreover, intratumoral edema, necrosis, and/or cysts may appear or increase due to damage to tumor cells or dynamic reorganization of the heterogeneous tumor structure after treatment. In addition, through dynamic changes of the ADCmin and diameter pre- and postchemotherapy, it was found that the change in mean ADCmin value occurred in advance of changes in tumor diameter, indicating that DWI is not dependent on relatively slow changes in tumor volume. Thus, DWI may be capable of providing earlier indications of therapeutic outcome due to molecular and cellular changes that typically precede ob-servable macroscopic changes in gross tumor size. These findings offer a window of opportunity to modify the initial treatment regimen to improve the clinical outcome and minimize the mor-bidity associated with prolonged and ineffective treatment.
These results demonstrate the feasibility of using the ADCmin of DWI for the prediction of treatment outcomes in patients with PCNSL undergoing chemotherapy. Early identification of pa-tients likely to have a poor response facilitates a chemoradiation regimen that may enable an early change in the treatment plan, such as addition of radiation therapy.
This study has a number of limitations. First, the follow-up time was short; thus, the correlation among the parameters ob-tained from DWI, the progression-free survival, and overall sur-vival in patients with PCNSL could not be analyzed. Thus, further studies are needed to confirm the predictive value of ADCmin for the final prognosis. Second, the study included only cases of
dif-fuse large B-cells of the PCNSL and did not contain other patho-logic types, such as Burkitt or T-cell types. Third, the study size was relatively small for the comparison of the pretherapeutic ADCmin among groups.
CONCLUSIONS
Correlation between the percentage of ADCmin changes of a tu-mor after 1 cycle of chemotherapy and treatment outcomes pro-vides a potential basis that may ultimately lead to the use of DWI for predicting and monitoring treatment response.
REFERENCES
1. Nakajima S, Okada T, Yamamoto A, et al.Differentiation between primary central nervous system lymphoma and glioblastoma: a comparative study of parameters derived from dynamic suscepti-bility contrast-enhanced perfusion-weighted MRI. Clin Radiol
2015;70:1393–99CrossRef Medline
2. Bhagavathi S, Wilson JD. Primary central nervous system lym-phoma.Arch Pathol Lab Med2008;132:1830 –34Medline
3. Kansara R, Shenkier TN, Connors JM, et al.Rituximab with high dose methotrexate in primary central nervous system lymphoma.
Am J Hematol2015;90:1149 –54CrossRef Medline
4. PDQ Adult Treatment Editorial Board. Primary CNS Lymphoma Treat-ment. Bethesda, Maryland: National Cancer Institute. Updated Septem-ber 21, 2015. http://www.cancer.gov/types/lymphoma/patient/primary-cns-lymphoma-treatment-pdq. Accessed June 9, 2016Medline 5. Barajas RF Jr, Rubenstein JL, Chang JS, et al.Diffusion-weighted MR
imaging derived apparent diffusion coefficient is predictive of clin-ical outcome in primary central nervous system lymphoma.AJNR Am J Neuroradiol2010;31:60 – 66CrossRef Medline
6. Wieduwilt MJ, Valles F, Issa S, et al.Immunochemotherapy with intensive consolidation for primary CNS lymphoma: a pilot study and prognostic assessment by diffusion-weighted MRI.Clin Cancer Res2012;18:1146 –55CrossRef Medline
7. Lee EJ, Lee SK, Agid R, et al.Preoperative grading of presumptive low-grade astrocytomas on MR imaging: diagnostic value of mini-mum apparent diffusion coefficient.AJNR Am J Neuroradiol2008; 29:1872–77CrossRef Medline
8. Guo AC, Cummings TJ, Dash RC, et al.Lymphomas and high-grade astrocytomas: comparison of water diffusibility and histologic characteristics.Radiology2002;224:177– 83CrossRef Medline 9. Lee KC, Moffat BA, Schott AF, et al.Prospective early response
im-aging biomarker for neoadjuvant breast cancer chemotherapy.Clin Cancer Res2007;13:443–50CrossRef Medline
10. Morris PG, Correa DD, Yahalom J, et al.Rituximab, methotrexate, procarbazine, and vincristine followed by consolidation reduced-dose whole-brain radiotherapy and cytarabine in newly diagnosed primary CNS lymphoma: final results and long-term outcome.
J Clin Oncol2013;31:3971–79CrossRef Medline
11. Abrey LE, Batchelor TT, Ferreri AJ, et al; International Primary CNS Lymphoma Collaborative Group.Report of an international workshop to standardize baseline evaluation and response criteria for primary CNS lymphoma.J Clin Oncol2005;23:5034 – 43CrossRef Medline 12. Iwadate Y1, Suganami A, Ikegami S, et al.Non-deep-seated primary
CNS lymphoma: therapeutic responses and a molecular signature.
J Neurooncol2014;117:261– 68CrossRef Medline
13. Prasad SR, Jhaveri KS, Saini S, et al.CT tumor measurement for therapeutic response assessment: comparison of unidimensional, bidimensional, and volumetric techniques initial observations. Ra-diology2002;225:416 –19CrossRef Medline
14. Liua Y, Baia R, Suna H, et al.Diffusion-weighted imaging in predicting and monitoring the response of uterine cervical cancer to combined chemoradiation.Clin Radiol2009;64:1067–74CrossRef Medline 15. Server A, Kulle B, Maehlen J, et al.Quantitative apparent diffusion
16. Zacharia TT, Law M, Naidich TP, et al.Central nervous system lym-phoma characterization by diffusion-weighted imaging and MR spectroscopy.J Neuroimaging2008;18:411–17CrossRef Medline 17. Africa E, Pauciulo A, Vadala` R, et al.Primary central nervous system
lymphoma: role of DWI in the differential diagnosis.Rays2005;30: 221–26Medline
18. Wu X, Kellokumpu-Lehtinen PL, Pertovaara H, et al. Diffusion-weighted MRI in early chemotherapy response evaluation of pa-tients with diffuse large B-cell lymphoma: a pilot study— com-parison with 2-deoxy-2-fluoro-D-glucose-positron emission tomography/computed tomography. NMR Biomed 2011;24: 1181–90CrossRef Medline
19. Valles FE, Perez-Valles CL, Regalado S, et al. Combined diffusion and perfusion MR imaging as biomarkers of prognosis in immuno-competent patients with primary central nervous system lym-phoma.AJNR Am J Neuroradiol2013;34:35– 40CrossRef Medline
20. Fujimoto H, Kazama T, Nagashima T, et al.Diffusion-weighted im-aging reflects pathological therapeutic response and relapse in breast cancer.Breast Cancer2014;21:724 –31CrossRef Medline 21. Chenevert TL, Stegman LD, Taylor JM, et al.Diffusion magnetic
reso-nance imaging: an early surrogate marker of therapeutic efficacy in brain tumors.J Natl Cancer Inst2000;92:2029 –36CrossRef Medline 22. Chenevert TL, McKeever PE, Ross BD.Monitoring early response of
experimental brain tumors to therapy using diffusion magnetic resonance imaging.Clin Cancer Res1997;3:1457– 66Medline 23. Moffat BA, Chenevert TL, Lawrence TS, et al.Functional diffusion
map: a noninvasive MRI biomarker for early stratification of clini-cal brain tumor response.Proc Natl Acad Sci U S A2005;102:5524 –29 CrossRef Medline
24. Moffat BA, Hall DE, Stojanovska J, et al.Diffusion imaging for eval-uation of tumor therapies in preclinical animal models.MAGMA