ORIGINAL RESEARCH
ADULT BRAIN
Measurement of Cortical Thickness and Volume of Subcortical
Structures in Multiple Sclerosis: Agreement between 2D
Spin-Echo and 3D MPRAGE T1-Weighted Images
XA. Vidal-Jordana,X D. Pareto,X J. Sastre-Garriga,XC. Auger,X E. Ciampi,XX. Montalban, andXA. Rovira
ABSTRACT
BACKGROUND AND PURPOSE:Gray matter pathology is known to occur in multiple sclerosis and is related to disease outcomes. FreeSurfer and the FMRIB Integrated Registration and Segmentation Tool (FIRST) have been developed for measuring cortical and subcortical gray matter in echo T1-weighted images. Unfortunately, most historical MS cohorts do not have 3D-gradient-echo, but 2D-spin-echo images instead. We aimed to evaluate whether cortical thickness and the volume of subcortical structures measured with FreeSurfer and FIRST could be reliably measured in 2D-spin-echo images and to investigate the strength and direction of clinicoradiologic correlations.
MATERIALS AND METHODS: Thirty-eight patients with MS and 2D-spin-echo and 3D-gradient-echo T1-weighted images obtained at the same time were analyzed by using FreeSurfer and FIRST. The intraclass correlation coefficient between the estimates was obtained. Correlation coefficients were used to investigate clinicoradiologic associations.
RESULTS:Subcortical volumes obtained with both FreeSurfer and FIRST showed good agreement between 2D-spin-echo and 3D-gradient-echo images, with 68.8%–76.2% of the structures having either a substantial or almost perfect agreement. Nevertheless, with FIRST with 2D-spin-echo, 18% of patients had mis-segmentation. Cortical thickness had the lowest intraclass correlation coefficient values, with only 1 structure (1.4%) having substantial agreement. Disease duration and the Expanded Disability Status Scale showed a moderate correlation with most of the subcortical structures measured with 3D-gradient-echo images, but some correlations lost significance with 2D-spin-echo images, especially with FIRST.
CONCLUSIONS: Cortical thickness estimates with FreeSurfer on 2D-spin-echo images are inaccurate. Subcortical volume estimates obtained with FreeSurfer and FIRST on 2D-spin-echo images seem to be reliable, with acceptable clinicoradiologic correlations for FreeSurfer.
ABBREVIATIONS:3D-GE⫽3D gradient-echo; 2D-SE⫽2D spin-echo; EDSS⫽Expanded Disability Status Scale; FIRST⫽FMRIB Integrated Registration and Segmentation Tool; ICC⫽intraclass correlation coefficient; TIV⫽total intracranial volume
G
ray matter pathology in patients with multiple sclerosis is present from the very early stages of the disease and has been related to long-term disability.1,2Therefore, in recent years,re-search has focused on obtaining accurate markers of GM damage, and different software packages have been developed or opti-mized for measuring it in MS. FreeSurfer software (http://surfer.
nmr.mgh.harvard.edu)3,4allows automatic calculation of cortical
thickness and the volume of subcortical GM structures by using 3D T1-weighted images. Briefly, the image-processing pipeline includes Talairach transformation of the 3D T1-weighted images and segmentation of the subcortical white matter and deep GM structures, relying on the gray and white matter boundaries and pial surfaces. The FMRIB Integrated Registration and Segmenta-tion Tool (FIRST; http://fsl.fmrib.ox.ac.uk/fsl/fslwiki/FIRST) software package5automatically segments subcortical GM
struc-tures also on the basis of 3D T1-weighted images. Briefly, FIRST is a model-based segmentation and registration program that uses shape and appearance models constructed from manually seg-mented images. On the basis of the learned models, FIRST searches through linear combinations of shape modes of variation for the most probable shape instance, given the observed intensities in the 3D T1-weighted input images. Both software packages have been shown to be accurate and reproducible.6-11
The study of cortical pathology in patients with MS by using Received May 5, 2016; accepted after revision September 5.
From the Department of Neurology-Neuroimmunology and Multiple Sclerosis Centre of Catalonia (A.V.-J., J.S.-G., E.C., X.M.) and Magnetic Resonance Unit (D.P., C.A., A.R.), Radiology Department, Hospital Universitari Vall d’Hebron, Universitat Auto`noma de Barcelona, Barcelona, Spain.
Paper previously presented, in part, at: Annual Meeting of the European Commit-tee for Treatment and Research in Multiple Sclerosis–Americas CommitCommit-tee for Treatment and Research in Multiple Sclerosis, September 11–13, 2013; Boston, Massachusetts.
Please address correspondence to Deborah Pareto, MD, Radiology Department. Vall d’Hebron University Hospital, Psg Vall d’Hebron 119-129, Barcelona 08035, Spain; e-mail: deborah.pareto@idi.gencat.cat
FreeSurfer has shown cortical thinning in patients with MS com-pared with healthy controls,12,13which has been related to lesion
volume, disease duration, disability,12 and cognitive
impair-ment.14Also, cortical thinning of the superior frontal gyrus,
thal-amus, and cerebellum significantly predicted conversion to MS in patients presenting with clinically isolated syndromes,15 and
global cortical thinning for 6 years was significantly associated with a more aggressive disease evolution.16The volume of deep
GM structures (measured with both FreeSurfer and FIRST) has also been shown to be lower in patients with MS compared with healthy controls,17-19and it has been related to different clinical
disease outcomes such as fatigue,20cognitive impairment,17-19,21
disability,19and walking function.22
Both FreeSurfer and FIRST have been optimized for 3D T1-weighted gradient-echo images that incorporate a magnetization-prepared inversion pulse that increases the T1-weighting.23
Un-fortunately, for most of the historical MS cohorts with long-term clinical and radiologic follow-up, only 2D spin-echo (2D-SE) T1-weighted images were acquired, a sequence that does not provide an optimal contrast between gray and white matter, particularly when acquired with high-field magnets.24The objectives of this
work were the following: 1) to evaluate whether cortical thickness and subcortical volumes obtained with FreeSurfer could be reli-ably measured with 2D-SE T1-weighted images by using as the criterion standard the same measures obtained with 3D gradient-echo (3D-GE) T1-weighted sequences, 2) to investigate whether subcortical volumes obtained with FIRST could be reliably mea-sured in 2D-SE T1-weighted images by using as the criterion stan-dard the same measures obtained with 3D-GE T1-weighted images,
and 3) to assess whether the correlations between clinical outcomes and subcortical normalized volumes obtained with 3D-GE and 2D-SE T1-weighted images had a similar strength and direction.
MATERIALS AND METHODS
Patients with relapsing-remitting MS with 2D-SE and 3D-GE T1-weighted images obtained at the same time were included in the analysis. Clinical and demographic data at the moment of MR imaging acquisition were recorded.
MR Imaging Acquisition and Analysis
All MR images were acquired on a 1.5T scanner (Magnetom Sym-phony; Siemens, Erlangen, Germany) with a standard head coil. The scanning protocol included 2 precontrast T1-weighted scans: a 3D magnetization-prepared rapid acquistion of gradient echo (TR/TE/TI, 2700/4.88/850 ms; voxel size, 1⫻1⫻1.2 mm3; matrix
size, 224⫻256⫻144; flip angle, 10°; receiver bandwidth, 130 Hz; averages, 1; acquisition time, 10 minutes) and a 2D-SE sequence (TR/TE, 450/17 ms; voxel size, 0.98⫻0.98⫻3 mm3; matrix size,
192 ⫻256 ⫻46; section gap, 0; receiver bandwidth, 130 Hz; averages, 2; acquisition time, 2 minutes 52 seconds). Both se-quences covered the whole brain. FreeSurfer software3,4(release
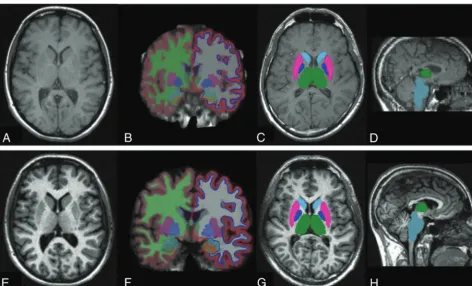
Version 5.1.0) was used to obtain cortical thickness and volumes of subcortical structures in all 2D-SE and 3D-GE sequences (Fig 1). Ninety-one GM structures (70 cortical and 21 subcortical) were obtained and used for 2D-SE versus 3D-GE reliability assess-ment. Cortical parcellation was also grouped into a categoric vari-able by medial or lateral structures. The estimated total intracra-nial volume, a measure obtained with FreeSurfer, was used to
[image:2.594.56.528.45.331.2]normalize the volume of subcortical structures as follows: raw subcortical structure volume/estimated total intracranial volume. FIRST software,5part of the FMRIB Software Library (FSL; http://
www.fmrib.ox.ac.uk/fsl),25was used to obtain volumes of 15
sub-cortical structures in all 2D-SE and 3D-GE sequences (Fig 1). Because FIRST does not provide a measure of total intracranial vol-ume (TIV), this was calculated by obtaining the matrix determinant of each scan (by using the avscale utility of the FMRIB Linear Image Registration Tool [FLIRT; http://www.fmrib.ox.ac.uk],26,27part of
the FSL) and applying the following formula: (FIRST template volume/matrix determinant)⫻1000. Normalized subcortical volume was then calculated as follows: raw subcortical struc-ture volume/TIV.
Statistical Analysis
We used the SPSS program (IBM, Armonk, New York) to analyze clinical and demographic data. To assess reliability, we calculated the intraclass correlation coefficient (ICC) between the values ob-tained with 2D-SE and 3D-GE. ICC estimates of agreement were categorized as the following: slight (0.01– 0.20), fair (0.21– 0.40), moderate (0.41– 0.60), substantial (0.61– 0.80), and almost per-fect agreement (0.81–1.0). Cortical thickness measures were grouped into lateral-versus-medial structures, and 2-tailed2
tests were used for group comparison. Parametric and nonpara-metric correlation coefficients were used as appropriate to inves-tigate associations between clinicodemographic data and normal-ized subcortical volume data. Because this was an exploratory study, correction for multiple comparisons was not performed. Statistical significance was set atP⬍.05.
RESULTS
Thirty-eight patients were included in the study. Twenty-three patients (60.5%) were women, with a mean age of 36.5⫾8.8 years, a mean disease duration of 10.5⫾7.2 years, and a median Expanded Disability Status Scale (EDSS) score of 4 (range, 1– 6).
FreeSurfer Reliability Assessment
Cortical thickness measurements had the lowest ICC values, with 40% and 42.9% of the structures having a moderate or fair agree-ment, respectively. Only 1 structure (the right superior temporal gyrus) had a substantial agreement, and no structures had an al-most perfect agreement (Table 1). Cortical thickness measure-ments of lateral structures had a higher proportion of moderate ICC estimates than medial structures (58.3% versus 15.6%,P⫽
.002). For most cortical structures (except for some right and left frontal lobe structures: frontal pole, rostral middle frontal, medial orbitofrontal, and pars triangularis) thickness values were under-estimated with 2D-SE sequences. Estimates of subcortical vol-umes showed a better agreement between 2D-SE and 3D-GE images, with 76.2% of the structures having either a substantial or almost perfect agreement compared with only 1.4% in the cortical structures (P⬍.001). The highest ICC values for sub-cortical volume estimates included relevant structures for MS pathology such as the thalamus, pallidum, caudate, brain stem, and putamen (Table 2). No clear pattern of over- or underes-timation when using 2D-SE sequences was seen for subcortical structures.
FIRST Reliability Assessment
With 2D-SE images, a registration error leading to a mis-segmen-tation occurred in 7 of 38 patients (18%) compared with none when 3D-GE images were used. Nevertheless, measurement of subcortical volumes from the studies that went through segmen-tation and registration showed a good agreement between 2D-SE and 3D-GE images, with 68.8% of the structures having either a substantial or almost perfect agreement (Table 2). Again, no clear pattern of over- or underestimation when using 2D-SE sequences was seen for subcortical structures.
Clinicoradiologic Correlations
Using normalized subcortical volume estimates obtained with FreeSurfer, we found the following: 1) Age did not correlate with any of the subcortical structures measured with both 3D-GE and 2D-SE images, and 2) disease duration and disability as measured with the Expanded Disability Status Scale showed a significant moderate correlation with most of the subcortical structures mea-sured with both 3D-GE and 2D-SE images; however, when we used 2D-SE images, some correlations lost statistical significance (Table 3). Using normalized subcortical volume measures
ob-Table 1: Intraclass correlation coefficients for 2D-SE and 3D-GE cortical thickness estimates using FreeSurfera
Structure ICC Structure ICC
None ⱖ0.81 L supramarginal 0.395
R superior temporal 0.663 R parahippocampal 0.393 R temporal pole 0.605 L inferior parietal 0.391 L superior temporal 0.59 L superior frontal 0.363 R inferior temporal 0.589 R lateral orbitofrontal 0.35 R superior parietal 0.58 R postcentral 0.343 L superior parietal 0.54 R isthmus cingulate 0.342 L inferior temporal 0.519 L precuneus 0.334
L fusiform 0.512 L precentral 0.329
R rostral middle frontal 0.508 R insula 0.328 R inferior parietal 0.503 L temporal pole 0.327 L lingual 0.501 L isthmus cingulate 0.325 L pars orbitalis 0.489 R entorhinal 0.324 R frontal pole 0.483 L parahippocampal 0.322 L middle temporal 0.481 R lateral occipital 0.319 R mean thickness 0.479 L transverse temporal 0.305 L caudal middle frontal 0.476 L lateral occipital 0.299 L pars triangularis 0.473 L entorhinal 0.293 L pars opercularis 0.465 R posterior cingulate 0.281 R pars opercularis 0.465 R caudal anterior cingulate 0.274 R caudal middle frontal 0.462 L pericalcarine 0.265 R fusiform 0.46 L posterior cingulate 0.251 R middle temporal 0.442 R medial orbitofrontal 0.248
R precuneus 0.439 L bankssts 0.223
L mean thickness 0.438 R pericalcarine 0.199 L rostral middle frontal 0.431 L paracentral 0.179 R supramarginal 0.431 L frontal pole 0.177
R pars orbitalis 0.429 R lingual 0.16
R precentral 0.428 R paracentral 0.159
L lateral orbitofrontal 0.418 R rostral anterior cingulate 0.156
L cuneus 0.409 L insula 0.128
R superior frontal 0.405 L rostral anterior cingulate 0.12 R pars triangularis 0.402 L medial orbitofrontal 0.103 L postcentral 0.401 R transverse temporal 0.04 R bankssts 0.399 L caudal anterior cingulate 0.016
R cuneus 0.399
Note:—L indicates left; R, right; bankssts, banks of the superior temporal sulcus.
a
[image:3.594.300.532.65.422.2]tained with FIRST, we found the following: 1) Age did not corre-late with any of the subcortical structures measured with both 3D-GE and 2D-SE images, and 2) disease duration and EDSS scores showed a significant moderate correlation with most of the subcortical structures measured with 3D-GE images, while almost all correlations were nonsignificant if estimates from 2D-SE im-ages were used (Table 4).
DISCUSSION
Brain volume loss, as measured with different postprocessing software packages, is known to occur in patients with MS, and it is clinically meaningful because it has been related to long-term mo-tor and cognitive disability outcomes.2,18,28Historical MR
imag-ing data from MS cohorts, with long-term follow-up that would provide relevant clinical information, do not include 3D heavily T1-weighted images (such as MPRAGE) but conventional 2D-SE T1-weighted images instead. Thus, reliability assessment of segmen-tation techniques in 2D-SE T1-weighted images may be of interest for these cohorts. As far as we are aware, this is the first time that FreeSurfer software has been evaluated by using 2D-SE T1-weighted images and that clinical correlations by using 3D-GE and 2D-SE im-ages processed with FIRST and FreeSurfer have been compared.
Cortical thickness estimates by using FreeSurfer software have been previously evaluated and have been demonstrated to be a robust and reproducible measure, except when different field strengths were used.6-8All studies performed to date have used 3D
T1-weighted sequences. In this study, we found that measure-ment of cortical thickness with 2D-SE images yields inaccurate and unreliable results, with ICC values below 0.6 for almost all structures; this finding was especially notable when medial struc-tures were evaluated. Pulse sequence, voxel geometry, and parallel imaging do not seem to influence cortical thickness measure-ments.6-8 Although FreeSurfer segmentation does not rely on
voxel intensity histograms, the different gray-white matter con-trast in 2D-SE compared with 3D-GE T1-weighted images (Fig 1) could partially explain this result. The contrast-to-noise ratio was calculated in a small subset sample (n⫽10; data not shown). The mean contrast-to-noise ratio between gray and white matter was 10.1 in the 2D-SE sequence and 19.7 in the 3D-GE. There are fundamental differences between contrast behaviors of spin-echo and gradient-echo sequences, especially when this last sequence is obtained with a magnetization-prepared inversion pulse.23
[image:4.594.55.285.155.395.2]This magnetization-prepared inversion pulse produces a strong T1-weighting in the image, resulting in an excellent gray-white matter contrast compared with the standard 2D-SE
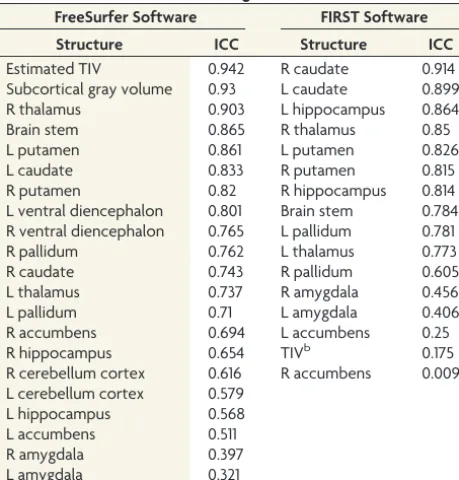
Table 2: Intraclass correlation coefficients for 2D-SE and 3D-GE subcortical volume estimates using FreeSurfer and FIRSTa
FreeSurfer Software FIRST Software
Structure ICC Structure ICC
Estimated TIV 0.942 R caudate 0.914
Subcortical gray volume 0.93 L caudate 0.899
R thalamus 0.903 L hippocampus 0.864
Brain stem 0.865 R thalamus 0.85
L putamen 0.861 L putamen 0.826
L caudate 0.833 R putamen 0.815
R putamen 0.82 R hippocampus 0.814
L ventral diencephalon 0.801 Brain stem 0.784 R ventral diencephalon 0.765 L pallidum 0.781
R pallidum 0.762 L thalamus 0.773
R caudate 0.743 R pallidum 0.605
L thalamus 0.737 R amygdala 0.456
L pallidum 0.71 L amygdala 0.406
R accumbens 0.694 L accumbens 0.25
R hippocampus 0.654 TIVb 0.175
R cerebellum cortex 0.616 R accumbens 0.009 L cerebellum cortex 0.579
L hippocampus 0.568
L accumbens 0.511
R amygdala 0.397
L amygdala 0.321
Note:—L indicates left; R, right.
a
The ICCs for 2D-SE and 3D-GE subcortical volume estimates using FreeSurfer and FIRST are shown. The ICC values are grouped in 5 categories: 33.3% and 43.8% of the structures with an almost perfect agreement using FreeSurfer and FIRST respectively, 42.9% and 25% of the structures with a substantial agreement using FreeSurfer and FIRST respectively, 14.3% and 12.5% of the structures with a moderate agreement using FreeSurfer and FIRST respectively, 9.5% and 6.25% of the structures with a fair agreement using FreeSurfer and FIRST respectively, and 0% and 12.5% of the struc-tures with a slight agreement using FreeSurfer and FIRST respectively.
b
FIRST total intracranial volume was calculated with the following formula: (FIRST template volume/matrix determinant)⫻1000.
Table 3: Clinicoradiologic correlation using 3D-GE and 2D-SE normalized subcortical structure values obtained with FreeSurfer software
Subcortical Structure
FreeSurfer 3D-GE FreeSurfer 2D-SE
Disease Duration EDSS Disease Duration EDSS
r P P r P P
Brain stem ⫺0.258 .123 ⫺0.408a .012a ⫺0.143 .400 ⫺0.545a ⬍.001a
L thalamus ⫺0.249 .137 ⫺0.268 .109 ⫺0.301 .070 ⫺0.313b .059b
L caudate ⫺0.304b .068b ⫺0.285b .088b ⫺0.316b .057b ⫺0.283 .090
L putamen ⫺0.443a .006a ⫺0.494a .002a ⫺0.466a .004a ⫺0.510a .001a
L pallidum ⫺0.489a .002a ⫺0.409a .012a ⫺0.315b .057b ⫺0.404a .013a
L hippocampus ⫺0.191 .256 ⫺0.122 .472 ⫺0.144 .397 ⫺0.085 .615
L amygdala ⫺0.083 .627 ⫺0.335a .043a 0.001 .997 ⫺0.141 .404
L accumbens ⫺0.332a .045a ⫺0.418a .010a ⫺0.358a .030a ⫺0.096 .571
R thalamus ⫺0.409a .012a ⫺0.402a .014a ⫺0.386a .018a ⫺0.376a .022a
R caudate ⫺0.455a .005a ⫺0.365a .02a ⫺0.29b .074b ⫺0.230 .171
R putamen ⫺0.505a .001a ⫺0.490a .002a ⫺0.472a .003a ⫺0.494a .002a
R pallidum ⫺0.459a .004a ⫺0.395a .016a ⫺0.220 .192 ⫺0.28b .093b
R hippocampus ⫺0.262 .118 ⫺0.302b .069b ⫺0.238 .157 ⫺0.220 .190
R amygdala ⫺0.181 .285 ⫺0.294b .077b ⫺0.183 .279 ⫺0.323b .051b
R accumbens ⫺0.330a .046a ⫺0.416a .011a ⫺0.215 .202 ⫺0.216 .199
Note:—rindicates the Pearson correlation coefficient;, the Spearman correlation coefficient; L, left; R, right.
a
Significant correlations.
[image:4.594.55.532.510.705.2]images, facilitating morphologic evaluation and gray-white matter tissue segmentation.
The section thickness of the 2 sequences was quite different (1.2 mm3for the 3D-GE sequence versus 3 mm3for the 2D-SE
sequence). This greater thickness in the 2D-SE sequences could probably have influenced the volumetric measures obtained with both software, since section thickness has already been demon-strated to play a role when estimating lesion volumes in patients with MS.29We are aware that visual inspection of intermediate
outputs to exclude MR images with segmentation errors could have improved our reliability results30; however, this
improve-ment would probably have been at the expense of introducing operator-derived biases. Furthermore, correcting cortical thick-ness segmentation errors (specially in 2D-SE T1-weighted im-ages) would have been a very laborious and time-consuming task and very difficult to apply in future research involving a large number of patients. Thus, we decided to analyze the data obtained with FreeSurfer without adding control points to correct for top-ographic errors.
In this study, subcortical volume estimates of T1-weighted images by using both FreeSurfer and FIRST had a good 2D-SE versus 3D-GE reliability, with most of the ICC values being greater than 0.6. Subcortical GM volumes are estimated in both packages with a registration atlas– based technique (both by using the same atlas), a technique that is robust and insensitive to image contrast. We found that the amygdala and accumbens had the lowest ICC values, similar to descriptions in the literature for test-retest reliability assessment of 3D-GE subcortical segmenta-tions by using FIRST software.9,10,31These structures are among
the smallest; therefore, smaller volume differences may represent a higher percentage of error. The high ICC values obtained in our study for most of the subcortical structures using FIRST are in agreement with the only study performed to date that evaluated the performance of FIRST in 2D-SE T1-weighted images compared with 3D-GE T1-weighted images.31Also, we found segmentation
errors in up to 18% of 2D-SE images, similar to what had been de-scribed in that work.31These mis-segmentations were not corrected
because we did not focus on improving 2D-SE FIRST segmentation
but on analyzing the performance of FIRST in these sequences in an automated fashion.
The main reason to study the performance of both packages in 2D-SE T1-weighted images was to test whether we could obtain measures that could be used to investigate clinical associations. Therefore, we assessed whether the subcortical normalized esti-mates obtained with 3D-GE and 2D-SE T1-weighted images by using the 2 packages were similarly associated with demographic and disease outcomes. Significant moderate correlations were ob-tained by using 3D-GE images, with relevant clinical outcomes such as disease duration and disability (measured with EDSS). However, by using 2D-SE scans, only normalized FreeSurfer esti-mates were significantly associated with clinical outcomes. This result could be partly explained because of the low ICC value of the TIV estimate between 2D-SE and 3D-GE T1-weighted images obtained by using FIRST (Table 2). Unlike FreeSurfer, FIRST does not provide a TIV estimate, and we calculated it by dividing the FIRST template volume (a fixed number of 1948.105) by the ma-trix determinant. Although both sequences covered the whole brain, the head coverage of the 2D-SE T1-weighted images is usu-ally lower than the 3D template used in FSL, covering a lesser portion of the scalp and lower part of the brain stem (Fig 1). Thus, it is possible that the template volume used to calculate TIV does not match well enough for 2D-SE T1-weighted images.
We are aware that using FSL SIENAX software (http://fsl. fmrib.ox.ac.uk/fsl/fslwiki/SIENA)25 to calculate TIV may have
been a better approach. However, we wanted to evaluate whether robust volume measures could be obtained with 2D-SE T1-weighted images by using a single package and without using im-age-processing options in the volumetric analysis (ie, the ade-quate threshold) that could introduce biases. Nevertheless, to confirm our interpretation, we used SIENAX software to calculate the normalized brain volume from 2D-SE and 3D-GE sequences in a small subset sample (n⫽15, data not shown). The ICC value of the normalized brain volume estimate between 2D-SE and 3D-GE T1-weighted images was 0.85 (almost perfect agreement), and most of the associations between subcortical normalized es-timates and disease outcomes obtained by using 3D-GE
se-Table 4: Clinicoradiologic correlation using 3D-GE and 2D-SE normalized subcortical structure values obtained with FIRST software
Subcortical Structure
FIRST 3D-GE FIRST 2D-SE
Disease Duration EDSS Disease Duration EDSS
r P P r P P
Brain stem ⫺0.133 .433 ⫺0.160 .345 0.079 .674 ⫺0.150 .420
L thalamus ⫺0.424a .009a ⫺0.226 .170 0.053 .777 0.080 .671
L caudate ⫺0.410a .012a ⫺0.302b .069b ⫺0.297 .105 ⫺0.065 .728
L putamen ⫺0.383a .019a ⫺0.364a .027a ⫺0.056 .767 ⫺0.262 .154
L pallidum ⫺0.308b .063b ⫺0.430a .008a ⫺0.073 .696 ⫺0.002 .991
L hippocampus ⫺0.429a .008a ⫺0.170 .313 ⫺0.226 .222 ⫺0.083 .658
L amygdala ⫺0.276b .098b ⫺0.029 .864 0.195 .294 0.230 .213
L accumbens ⫺0.234 .164 ⫺0.30b .071b 0.384a .033a 0.023 .901
R thalamus ⫺0.496a .002a ⫺0.235 .162 ⫺0.022 .905 ⫺0.092 .621
R caudate ⫺0.501a .002a ⫺0.270a .106a ⫺0.419a .019a ⫺0.188 .310
R putamen ⫺0.406a .013a ⫺0.454a .005a ⫺0.043 .817 ⫺0.286 .119
R pallidum ⫺0.288b .08b ⫺0.36b .029b ⫺0.005 .980 0.013 .945
R hippocampus ⫺0.384a .019a ⫺0.002 .988 ⫺0.082 .662 ⫺0.064 .731
R amygdala ⫺0.253 .131 0.046 .785 0.027 .887 0.331 .069
R accumbens ⫺0.316b .057b ⫺0.322 .052 0.233 .208 ⫺0.014 .941
Note:—L indicates left; R, right;r, the Pearson correlation coefficient;, the Spearman correlation coefficient.
a
Significant correlations.
b
[image:5.594.54.532.54.240.2]quences remained significant when using 2D-SE sequences. These results reinforce our hypothesis that the poor clinicoradiologic correlations seen with 2D-SE sequences are most probably due to a bad TIV estimation when using the avscale tool.
There are some limitations to our study. First, it was con-ducted with 2D-SE and 3D-GE T1-weighted images used in clin-ical practice with particular acquisition parameters. It is possible that a better optimized 2D-SE sequence obtained with a higher field scanner would have produced better segmentation results. Therefore, our results should be extrapolated with caution when using different 2D sequences. Second, a voxel-by-voxel compari-son of the binary masks would have provided relevant informa-tion regarding whether the software included the same image points in both sequences. Unfortunately, 2D-SE and 3D-GE FIRST outputs have different resolutions; therefore, an accurate comparison of the binary masks could not be performed. Never-theless, we believe this issue does not diminish the relevance of our results because a visual inspection of the outputs was performed to ensure that the FIRST software was correctly measuring subcortical structures in both sequences. Finally, a test-retest variability study with 2D-SE images would have provided more detailed information regarding reliability. Unfortunately, as stated before, the images used for this study were obtained in a clinical practice setting, with specific schedules, and test-retest studies are lacking.
CONCLUSIONS
We have demonstrated the following: 1) Measurement of cortical thickness with FreeSurfer with 2D-SE T1-weighted images is not accurate enough; 2) measurement of subcortical volumes with FreeSurfer and FIRST in 2D-SE images produces accept-able results; but 3) when we used normalized subcortical vol-umes of 2D-SE images for clinical correlations, FreeSurfer per-formed better than FIRST. Therefore, FreeSurfer should be preferred if normalized subcortical volume measures are to be used in transversal correlations with clinical and demographic variables but should not be used to measure cortical thickness in 2D-SE images.
Disclosures: Angela Vidal-Jordana—UNRELATED:Payment for Lectures including Service on Speakers Bureaus: Novartis, Roche, Sanofi, Biogen. Deborah Pareto—
UNRELATED:Payment for Lectures including Service on Speakers Bureaus: Novartis, Genzyme. Jaume Sastre-Garriga—UNRELATED: Consultancy: Almirall; Grants/ Grants Pending: Genzyme*;Payment for Lectures including Service on Speakers Bureaus: Novartis, Biogen, Almirall, Merck-Serono, Genzyme, Teva Pharmaceutical;
Payment for Development of Educational Presentations: Novartis, TOPEC;Travel/ Accommodations/Meeting Expenses Unrelated to Activities Listed: Merck, No-vartis. Cristina Auger—UNRELATED:Payment for Lectures including Service on Speakers Bureaus: Novartis, Biogen, Sthendal. Ethel Ciampi—RELATED:Other: Euro-pean Committee for Treatment and Research in Multiple Sclerosis,Comments: I received the European Committee for Treatment and Research in Multiple Sclerosis Clinical Training Fellowship Award 2013, which supported my stay in Barcelona for the period in which the study was performed but did not provide direct support of the study;UNRELATED:Board Membership: Biogen;Employment: School of Medicine UC;Travel/Accommodations/Meeting Expenses Unrelated to Activi-ties Listed: Genzyme, Merck, Biogen. Xavier Montalban—UNRELATED: Consul-tancy: Actelion, Almirall, Biogen, Genzyme, Merck, Novartis, Receptos, Roche, Sanofi-Genzyme, Teva Pharmaceutical. Alex Rovira—UNRELATED:Board Mem-bership: Novartis, Biogen, Genzyme, OLEA;Consultancy: Novartis, Biogen, Gen-zyme;Payment for Lectures including Service on Speakers Bureaus: Novartis, Bio-gen, Genzyme, OLEA, Bracco, Teva Pharmaceutical;Payment for Development of Educational Presentations: Novartis, Biogen, Genzyme, Teva Pharmaceutical. *Money paid to the institution.
REFERENCES
1. Pe´rez-Miralles FF, Sastre-Garriga J, Tintore´ M, et al.Clinical impact of early brain atrophy in clinically isolated syndromes.Mult Scler
2013;19:1878 – 86CrossRef Medline
2. Popescu V, Agosta F, Hulst HE, et al; MAGNIMS Study Group. Brain atrophy and lesion load predict long term disability in multiple sclerosis.J Neurol Neurosurg Psychiatry2013;84:1082–91
CrossRef Medline
3. Fischl B.FreeSurfer.Neuroimage2012;62:774 – 81CrossRef Medline
4. Desikan RS, Se´gonne F, Fischl B, et al.An automated labeling system for subdividing the human cerebral cortex on MRI scans into gyral based regions of interest.Neuroimage2006;31:968 – 80CrossRef Medline
5. Patenaude B, Smith SM, Kennedy DN, et al.A Bayesian model of shape and appearance for subcortical brain segmentation. Neuro-image2011;56:907–22CrossRef Medline
6. Han X, Jovicich J, Salat D, et al.Reliability of MRI-derived measure-ments of human cerebral cortical thickness: the effects of field strength, scanner upgrade and manufacturer.Neuroimage2006;32: 180 –94CrossRef Medline
7. Wonderlick J, Ziegler D, Hosseini-Varnamkhasti P, et al.Reliability of MRI-derived cortical and subcortical morphometric measures: effects of pulse sequence, voxel geometry, and parallel imaging. Neuroimage2009;44:1324 –33CrossRef Medline
8. Govindarajan KA, Freeman L, Cai C, et al.Effect of intrinsic and extrinsic factors on global and regional cortical thickness.PLoS One
2014;9:e96429CrossRef Medline
9. Morey RA, Selgrade ES, Wagner HR 2nd, et al.Scan-rescan reliabil-ity of subcortical brain volumes derived from automated segmen-tation.Hum Brain Mapp2010;31:1751– 62CrossRef Medline
10. Nugent AC, Luckenbaugh DA, Wood SE, et al.Automated subcorti-cal segmentation using FIRST: test-retest reliability, interscanner reliability, and comparison to manual segmentation.Hum Brain Mapp2013;34:2313–29CrossRef Medline
11. Derakhshan M, Caramanos Z, Giacomini PS, et al.Evaluation of automated techniques for the quantification of grey matter atrophy in patients with multiple sclerosis.Neuroimage2010;52:1261– 67
CrossRef Medline
12. Sailer M.Focal thinning of the cerebral cortex in multiple sclerosis. Brain2003;126:1734 – 44CrossRef Medline
13. Calabrese M, Atzori M, Bernardi V, et al.Cortical atrophy is relevant in multiple sclerosis at clinical onset.J Neurol2007;254:1212–20
CrossRef Medline
14. Calabrese M, Rinaldi F, Mattisi I, et al.Widespread cortical thinning characterizes patients with MS with mild cognitive impairment. Neurology2010;74:321–28CrossRef Medline
15. Calabrese M, Rinaldi F, Mattisi I, et al.The predictive value of gray matter atrophy in clinically isolated syndromes.Neurology2011;77: 257– 63CrossRef Medline
16. Calabrese M, Favaretto A, Poretto V, et al.Low degree of cortical pathology is associated with benign course of multiple sclerosis. Mult Scler2013;19:904 –11CrossRef Medline
17. Batista S, Zivadinov R, Hoogs M, et al.Basal ganglia, thalamus and neocortical atrophy predicting slowed cognitive processing in mul-tiple sclerosis.J Neurol2012;259:139 – 46CrossRef Medline
18. Benedict RH, Ramasamy D, Munschauer F, et al.Memory impair-ment in multiple sclerosis: correlation with deep grey matter and mesial temporal atrophy.J Neurol Neurosurg Psychiatry 2009;80: 201– 06CrossRef Medline
19. Datta S, Staewen TD, Cofield SS, et al; CombiRx Investigators Group. Regional gray matter atrophy in relapsing remitting multiple sclerosis: baseline analysis of multi-center data.Mult Scler Relat Dis-ord2015;4:124 –36CrossRef Medline
20. Calabrese M, Rinaldi F, Grossi P, et al.Basal ganglia and frontal/parietal cortical atrophy is associated with fatigue in relapsing-remitting mul-tiple sclerosis.Mult Scler2010;16:1220 –28CrossRef Medline
22. Motl RW, Hubbard EA, Sreekumar N, et al.Pallidal and caudate volumes correlate with walking function in multiple sclerosis. J Neurol Sci2015;354:33–36CrossRef Medline
23. Mugler JP 3rd, Brookeman JR.Three-dimensional magnetization-prepared rapid gradient-echo imaging (3D MP RAGE).Magn Reson Med1990;15:152–57CrossRef Medline
24. Fischer HW, Rinck PA, Van Haverbeke Y, et al.Nuclear relaxation of human brain gray and white matter: analysis of field depen-dence and implications for MRI. Magn Reson Med 1990;16: 317–34CrossRef Medline
25. Smith SM, Zhang Y, Jenkinson M, et al.Accurate, robust, and auto-mated longitudinal and cross-sectional brain change analysis. Neu-roimage2002;17:479 – 89CrossRef Medline
26. Jenkinson M, Smith S.A global optimisation method for robust affine registration of brain images.Med Image Anal2001;5:143–56
CrossRef Medline
27. Jenkinson M, Bannister P, Brady M, et al.Improved optimization for the robust and accurate linear registration and motion
correction of brain images.Neuroimage2002;17:825– 41CrossRef Medline
28. Lansley J, Mataix-Cols D, Grau M, et al.Localized grey matter atro-phy in multiple sclerosis: a meta-analysis of voxel-based morphom-etry studies and associations with functional disability.Neurosci Biobehav Rev2013;37:819 –30CrossRef Medline
29. Filippi M, Horsfield MA, Campi A, et al.Resolution-dependent estimates of lesion volumes in magnetic resonance imaging studies of the brain in multiple sclerosis.Ann Neurol1995;38:749–54
CrossRef Medline
30. Iscan Z, Jin TB, Kendrick A, et al.Test-retest reliability of Free-surfer measurements within and between sites: effects of visual approval process. Hum Brain Mapp2015;36:3472– 85CrossRef Medline