warwick.ac.uk/lib-publications
A Thesis Submitted for the Degree of PhD at the University of Warwick
Permanent WRAP URL:
http://wrap.warwick.ac.uk/107840
Copyright and reuse:
This thesis is made available online and is protected by original copyright.
Please scroll down to view the document itself.
Please refer to the repository record for this item for information to help you to cite it.
Our policy information is available from the repository home page.
T H E B R IT IS H L IB R A R Y DOCUMENT
SUPPLY
CENTRE
t it l e
Low Energy He+ and Li+ Ion
Scattering from Surfaces
Attention is drawn to the fact that the copyright o f
this thesis rests with its author.
This copy of the thesis has been supplied on condition
that anyone w ho consults it is understood to recognise
that its copyright rests with its author and that n o
information derived from it may be published without
the author’s prior written consent.
A U T H O R
Mark John Ashwin
IN ST IT U T IO N
and DATE
University of Warwick
T H E B R IT IS H L IB R A R Y
D O C U M E N T SUPPLY CENTRE Boston Spa, Wetherby
20
West Yorkshire
United Kingdom R E D U C T IO N X
Low Energy He* and Li+ Ion
Scattering from Surfaces
by
Mark John Ashwin
A thesis submitted to the University of
Warwick for admission to the degree
of Doctor of Philosophy.
Department of Physics
T H E BR IT ISH LIBRARY
d o c u m e n tSUPPLY
c e n t r eB R IT IS H TH E SES
N O T I C E
The quality of this reproduction is heavily dependent upon the quality of the original thesis submitted for microfilming. Every effort has been made to ensure the highest quality of reproduction possible. If pages are missing, contact the university which granted the degree. Some pages may have indistinct print, especially if the original pages were poorly produced o r if the university sent us an inferior copy. Previously copyrighted materials (journal articles, published texts, etc.) are not filmed.
Reproduction of this thesis, other than as permitted under the United Kingdom Copyright Designs and Patents A ct 1988, o r under specific agreement with the copyright holder, is prohibited.
T H IS TH ESIS H A S B E E N M IC R O F IL M E D E X A C T L Y A S R E C E IV E D
T H E B R IT IS H LIBRARY
D O C U M E N T SUPPLY C E N T R E Boston Spa, Wetherby W e st Yorkshire, LS23 7 B Q
Contents
Acknowledgements iii
Declaration iv
Abstract v
Abbreviations vi
1. Introduction 1
1.1. References 6
2. Surface Science Techniques
2.1. Low Energy Electron Diffraction 7
2.2. Auger electron Spectroscopy 8
2.3. Introduction to Ion Scattering
2.3.1. Binary Collision Model 10
2.3.2. Shadow Cones and Potentials 16
2.3.3. Neutralization 21
2.3.4. Features o f Ion Scattering 24
2.4. References 27
3 . Apparatus
3.1. The Chamber 31
3.2. Manipulator 31
3.3. Analyser and Ion Gun 33
4. Impact Collision Ion Scattering Spectroscopy Investigation o f C u(l 10)
4.1. Introduction 36
4.2. Impact Collision Ion Scattering Spectroscopy 37
4.5. Description o f C u(l 10) Scattering D ata by Computer Simulation 45
4.6. Conclusions 48
4.7. References 51
5. Ion Scattering from Cu(l 10X2x1 ) - 0 and C u (l 10X2x3)-N
5.1. Introduction 52
5.2.1. C u (l 10X2xl)-O Results 53
5.2.2. Modelling o f the Cu( 110X2x 1 K > ICISS Data 56
5.2.3. Conclusions for Cu( 110)(2x 1 ) - 0 59
5.3.1. Introduction to Cu( 110X2x3)-N 60
5.3.2. Results for Cu( 110X2x3)-N 61
53 .3 . Structural models for Cu( 110X2x3)-N 63
5.3.4. Conclusions for Cu( 110X2x3)-N 65
5.4. References 67
6. Alkali Adsorption on Cu( 110)
6.1. Introduction 69
6.1.1. Results and Discussion o f Alkali Adsorption on Cu( 110) 71
6.1.2. Conclusions 76
6.1.3. References 77
7. Conclusions 78
7.1. References 80
8. Appendices 81
Acknowledgments
Many people have aided me throughout m y Ph.D. studies from its beginning to its fulfilment. In particular I would like to thank
• Professor D.P.Woodruff for his guidance and assistance throughout the Ph.D. and especially for his advice in the preparation of this text.
• Mr. R.IJohnston for his advice and invaluable technical assistance.
• Dr. M.D.Crapper for his guidance in the early years o f the Ph.D. studies.
• To members, past and present, of the Surface Science group and o f the Physics
Department and University for their assistance and also their friendship which helped to smooth the often rough passage through the P h D .
• The Physics Department and the Science and Engineering Research Council for the provision o f facilities and financial support to enable this Ph.D. course to
proceed.
• To PJ.T hom pson for his assistance in the preparation o f this thesis.
• and finally but not least, my parents and family for their support throughout my
Declaration
I declare that this thesis contains an account o f my research carried out in the
Department o f Physics a t the University o f Warwick between October 1985 and
December 1989 under the supervision o f Professor D.P.W oodruff. The computer
program used far data analysis was originally written by Professor D.P.Woodruff and subsequently revised by both o f us. The research described herein has not been
submitted either partly o r totally at this academic institution or any other for
admission to a higher degree. Some parts have been published
• M.J.Ashwin and D .P.W oodruff, Elastic Scattering and C harge Exchange in He+
Ion Scattering from A lkali Metal Overiayers, Vacuum 3 8 (1988) 291
• M J.A shwin and D.P.W oodruff, Low Energy Ion Scattering Study of the
C u(l 10)(2x3)-N Structure, Submitted to Surface Science fo r publication.
It is hoped that the w ork on alkali and oxygen adsorption o n to Cu(UO), chapters
5 and 6, will be published in the near future.
/}
¿T
fld w
i-M J.A shwin
Abstract
A 150° ion scattering spectrometer has been commissioned and utilized to investigate several adsorbate systems on C u (l 10). Firstly, the experimental parameters were determined by using 3keV Li* ions in th e ICISS mode to investigate the clean Cu(UO) surface. The inelastic background normally observed in Li* ion scattering energy distributions was found to be m ore sensitive to the sublayer shadowing conditions than was the substrate’s elastic scattering peak. M ost o f the observed lower layer scattering features corresponded to m ultiple scattering events. Using computer modelling it was deduced that for the clean C u (l 10) surface the 1st to 2nd layer spacing was compressed by (8±3)%, and the 2nd to 3rd was expanded by (1 1±8)% compared to the bulk values.
3keV Li* and 2keV He* ions were then used to study the C u(l 10)(2xl)-O and Cu( 110X2x3)-N adsorbate systems. In the form er case the Li* data exhibited a doubling o f the C u -C u distance in the < 1 10> an d the <211> azim uths and were found to favour a missing row type reconstruction, in which every other <100> row had been removed. In addition. He*—»O scattering indicated that the oxygen atoms resides in the <100> long bridge site (0.0±0.2)A above th e surface. Li* ion scattering from the C u (l 10)(2x3)-N indicated a substantial reconstruction o f the surface, with an apparent reduction in the C u -C u spacing in the < 1 10> azim uth and an increase in the < 2 1 1> azimuth. Many o f the observations are found to be quantitatively consistent, and all are qualitatively consistent, with a reconstruction in which a local Cu(100)c(2x2)-N structure is formed. Additionally, the He*—»N scattering results favour a N adsorption site slightly above the surface.
Adsorption o f Na, K and Cs onto C u(l 10) a t room temperature was studied using IkeV He* ions, IkeV Li* ions were used to investigate Cs adsorption. The intensity o f the alkali elastic scattering signal exhibited a ‘d ip ’ with increasing alkali coverage. For lithium this w as attributed to the change in the reionization probability with changes in the surface's work function. For helium this w a s thought to be due to changes in the neutralization mechanism within the alkali adlayer. Additionally, the alkali metal adsorbates induced an inelastic background in the He* ion energy distributions, and this is ascribed to changes in the neutralization probability as the ion returns through the alkali metal overlayer.
Abbreviations
AES Auger Electron Spectroscopy
ALCISS Alkali impact Collision Ion Scattering Spectroscopy
CAICiSS Coaxial Impact Collision Ion Scattering Spectroscopy
HEIS High Energy Ion Scattering
ICISS Impact Collision Ion Scattering Spectroscopy
ISS Ion Scattering Spectroscopy
LEED Low Energy Electron Diffraction
LE IS Low Energy Ion Scattering
MBE Molecular Beam Epitaxy
MEIS Medium Energy Ion Scattering
NEXAFS Near Edge X -R ay Absorption F in e Structure
RBS Rutherford Backscattering Spectroscopy
SEXAFS Surface Extended X -Ray A bsorption Fine Structure
SIMS Secondary Ion Mass Spectroscopy
UHV Ultra High Vacuum
UPS Ultraviolet Photoelectron Spectroscopy
VQ Vacuum Generators Ltd.
VSW Vacuum Science Workshop
Chapter 1.
Introduction
Theoretical and experimental analyses o f the bulk properties o f well ordered samples rely on the three dimensional symmetry of the bulk to describe its properties,
e.g. its lattice spacing or its electron density distribution. The surface represents a
departure from the three dimensional to the two dimensional regime for which the bulk
theory does not apply. In addition, there may be a region o f transitions between the bulk structure and the surface layer which will further complicate the situation. The
surface is where the sample interacts with its environment and in order to understand
these interactions we need to understand what is happening in the region o f the surface
and what is the role o f its properties, e.g. its atomic structure.
There are three main areas where interest in the surface is keenly focussed; they
are in catalysis, material degradation and semiconductors [3]. In the manufacture o f chemical products the processes go through many stages, each producing their own
intermediates by using different catalysts under many different reaction conditions
[2,5,6]. These catalysts are usually multicomponent particulate entities, with the active
element being a transition metal. In addition, reaction promoters are present to
enhance a particular facet o f the reaction. The complex formulations used have largely been arrived at by empirical methods. Bearing in mind the size o f the chemical
industry, any increase in efficiency produced by an improvement in the understanding o f the processes involved is o f immense importance. Usually the most expensive part
o f the catalyst is the transition metal, e.g. platinum or rhodium, therefore an
understanding o f its function may lead to a reduction in costs. Properties which could
be examined are whether there is a difference in the reactivity between crystal planes,
crystal samples. This may seem far removed from the situation in a practical catalyst,
but to reach the point where we can explain the reactions it is necessary to start with a
simpler system, i.e. a clean, stable and characterized environment. Additionally, it reduces the number o f variables involved. From this point the fundamentals of
molecular adsorption and the enhancement caused by promoters can be examined to
form a database from which to build.
Material degradation is a constant threat to the integrity o f materials, [3]. It can
take many forms such as the formation o f oxides, e.g. rust, or the diffusion o f alloy components to a fault plane or the surface. In this area the process maybe internal as
well as external to the material, but surface science can again help to pin point the
driving forces behind these processes, by for example, examining what effect the density o f steps on a surface has on the diffusion o f atoms or the reactivity o f a surface
to an oxidant. Perhaps, one o f the areas where surface studies are most important is in
the semiconductor industry, especially as the integrated devices are becoming thinner
and tending towards m onolayer thicknesses, [3,9,10.11]. Here, the quest to design ever
more novel devices and use o f higher component densities on semiconductor material has driven the need for better defined multilayer semiconductors using single crystal
substrates. Hence, there is a need to determine surface registry and the structure of
each new layer as it is formed into a multilayer sandwich. A vital feature controlling the operation o f a device is the electronic structure and how it varies with the layer
composition and dimension. In the future, devices will approach the dimensions where
quantum effects become significant, such as in the quantum transistor [4], and a
knowledge o f the electron density becomes critical in the design o f such devices. In addition there are many other areas o f interest, such as the magnetic properties o f thin
films, important for storage media, o r coatings to prevent corrosion.
For a long time the properties o f surfaces have been investigated, ever since
Benjamin Franklin poured oil on Clapham pond [1]. The effect o f the surface layer on observed properties has been postulated since the early 19th century [1]. The field
received a large impetus due to the pioneering research o f I. Langmuir who introduced
m any concepts required by later surface investigations. He is best known for his work
with K. Blogget on the two dimensional properties of monolayer films, [1]. For this
and other contributions he received the Nobel prize for Chemistry in 1932. Surface
studies continued through the 20th century, with discoveries such as Low Energy
Electron Diffraction by Davisson and Germer (1927), [17], or Auger electron transitions by P. Auger (1925), [8,16], bulk Extended X -ray Absorption Fine Structure
(EXAFS) leading to Surface-Extended X -ray Absorption Fine Structure (SEXAFS),
[12]. The pace o f investigation took a large up turn with the ability to obtain routinely ultra high vacuum, <10-9 mbar in the m id sixties.
The use o f ions as a surface probe is just one of the many available, but it
provides a wide range o f energies and the ability to perform compositional and
structural information from essentially the same equipment. The range o f energies used by ion scattering are usually divided into three parts. Low Energy Ion Scattering
(LEIS, energies 500eV-10keV), Medium Energy Ion Scattering (MEIS, 10-600keV)
and High Energy Ion Scattering (HEIS, >lM eV ); these definitions are by no means
rigid. One o f the earliest studies of ion surface interactions was performed by Grove in 1852 [13], who investigated the sputtering o f a surface by ions. Ion scattering studies
did not become prevalent until the early nineteen fifties and concentrated mainly in the
HEIS region o f energies. In these studies a two body collision model was tested and found to be applicable and eventually led to the development o f Rutherford
Backscattering (RBS). In addition, the sputter products o f the surface were mass
analysed to determine the surface elemental composition, which latter developed into
Secondary Ion Mass Spectrometry (SIMS). The extension o f the energy range towards
lower energies was performed in the late nineteen fifties by Brunnee [14], who found the maximum energy o f the scattered ions corresponded to the classical binary
collision model prediction (see chapter 2). This area o f study was further developed by
D.P. Smith [14] at the 3M company in the nineteen sixties, who applied the method to the analysis o f elemental composition in the outermost monolayer, this led to a rapid
increase in the number o f ion scattering investigations. At present there is active
research into many aspects o f ion scattering, such as the neutralization o f ions and the
effects o f different work functions [15], o r the determination o f the universal scattering
potential [20], as well as considerable interest in its application to the deduction of surface structures.
In this project ion scattering was used to try to determine the structure o f the clean
C u (l 10) surface and the reconstructions induced in it by various adsorbates, as well as
the effect o f changing work functions and of a molecular adsorbate. In this
investigation two ions were used, namely helium and lithium. The former suffers from
a high rate o f neutralization which is trajectory dependent, and is not usually
considered suitable for structural analysis, though Aono has been successful, [18,19].
Lithium, on the other hand does not suffer from trajectory dependent neutralization. A particular specialization o f ion scattering was used in this project, namely Impact
Collision Ion Scattering Spectroscopy (ICISS), first proposed by Aono in 1981 [18].
The first part o f the thesis describes the techniques that were utilized in this project. A t first the project concentrated on determining the structure o f the clean
C u(l 10) surface and understanding the scattering events taking place. Due to our
choice o f scattering angle, -1 5 0 °, there were many complications that had not been foreseen, which are discussed in chapter 4. The technique was then applied to an
extensively studied adsorbate structure, namely C u(l 10X2x1 )-0 . Here, the
reconstruction is widely believed to be a missing row type structure, with the oxygen
atoms occupying the <100> long bridge sites, but the O -C u top layer spacing has proved controversial, with a large spread o f values having been reported by other
groups. Helium ion scattering was also used to investigate the position o f the adsorbed
oxygen atoms, since lithium ion scattering proves insensitive to low atomic number
adsorbates. An element that is a neighbour o f oxygen in the periodic table is nitrogen,
but m olecular nitrogen does not react with copper. An atomic adsorption structure can
be formed, however, using an ion gun, and a (2x3) phase is produced, which has been studied by a few groups. Both the substrate structure and the nitrogen site have been
investigated, using both lithium and helium ions. Due to the limited amount o f prior
research that has been performed on this system, these aspects o f the system are still
the subject o f debate within surface science. The results presented indicate that a large
reconstruction has taken place within the surface layer. The final experimental chapter is an investigation o f the application o f ICISS to a very different adsorbate. It is known
that a small amount o f alkali metal adsorption produces large changes in the work
function o f surfaces (and indeed in some f.c.c. (110) surfaces causes a (1x2) surface
reconstruction). W e find that this appears to produce significant changes in the ion
1.1. R e f e re n c e s
1. A. Zangwill, Physics at a Surface. C ambridge University Press 1988
2. R.P.H. Gasser, A n Introduction to Chemisorption and C atalysis by
Metals. O xford Science Publications 1985
3. D.P. W oodruff and T.A. Delchar, M odem techniques o f Surface Science. Cambridge Solid State Series 1986
4. R.T. Bate, Scientific American 258 (1988) 78
5. M.Bowker and R J Joiner, Physics W orld M arch (1989) 35 6. M. Chesters, Physics World M arch (1989) 40
7. D.A. King , Physics W orld M arch (1989) 45
8. R.Sietmann, Physics Bulletin 39 No.8 (1988) 316
9. G.Davies, Physics Bulletin 39 No.9 (1988) 22
10. L. Eaves and G. Toombs, Physics Bulletin 3 9 No.9 (1988) 24
1 l.G . Rees, Physics Bulletin 3 9 No.9 (1988) 26
12. J. S to h r, X -R ay Adsorption: Principles, Techniques and Applications o f
EXAFS, SEXAFS and XANES. Eds R.Prins and D.C. Kronigsberger (Wiley. New York, 1988)
13. G.M. McCraken, RepC Prog. Phys. 3 8 (1975) 261
14. D.P. Smith, Joum . Appl. Phys. 38 (1967) 340
15. M. Aono, Nucl. Instr. and Meths. B27 (1987) 35 16. P. Auger. J. Phys. Radium. 6 (1925) 205
17. C J . Davisson and L.H. Germer Nature 1 1 9 (1927) 558
18. M. Aono, Jap. Jo u m . o f App. Phys. 2 0 (1981) L829
19. M. Aono. Nucl. Instr. and Meths. B2 (1984) 374 2 0 .0 .S . Oen, Surface Science Letts. 131 (1983) L I407
Chapter 2.
Surface Science Techniques
This chapter provides a brief introduction to the techniques used within this
project, with emphasis o n ion scattering.
2.1. Low Energy Electron Diffraction (LEED)
LEED has become one of the standard techniques in surface science, and has
been used to determine many structures, e.g. [1,2,3,12]. The first LEED experiment
was performed by D avisson and Germer [5], and this and work by Thompson and
Reid, [4], provided experimental evidence for wave particle duality. Until the early
sixties very little surface science was performed with LEED due to the inability to obtain UHV easily.
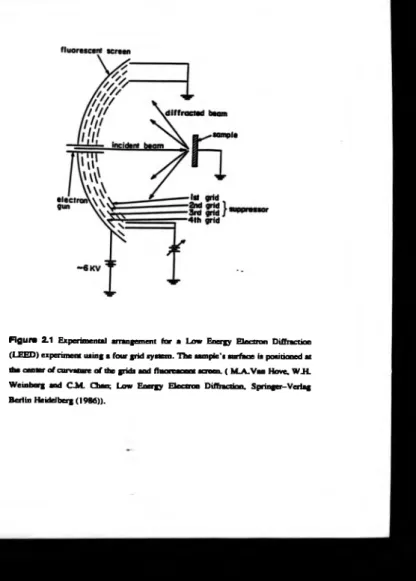
In LEED a m onoenergetic electron beam in the energy range 30-300eV is
incident onto a sample from which the electrons are then scattered. An instrumental schematic is presented in figure 2.1. A typical energy spectrum o f these scattered
electrons is outlined in figure 2.2. The major peak at the highest energies is due to the
elastically scattered electrons and these are the ones detected in LEED. A t lower electron energies there is a distribution o f inelastic and secondary electrons, and within
this region there are p eaks due to Auger electron transitions, see section 2.2. The
selection o f the elastically scattered electrons is accomplished by the use o f three or
four high transmission grid s to form a high pass-filter, and a fluorescent screen, figure
2.1. To provide a field free region the first grid is fixed at earth potential. The detection o f only the elastically scattered electrons is accomplished by setting the
centre grids at a potential ju st below the primary energy o f the electron beam. The
elastically scattered electrons penetrating beyond these grids will have a kinetic energy
o f a few eV, and are then excited to their original energy by the final grid, but this is
Figure 2.1 Experimental arrangement fo r a Low Energy E lectron Diffraction
(LEED ) experiment using a four grid system. T h e sample’s surface is positioned at the center o f curvature o f the grids and fluorescent screen. ( M A . Van Hove. W.H.
insufficient to excite the phosphor on the fluorescent screen. Hence, the screen is
raised to a potential o f several kV to accelerate these electrons. It can be shown that
the elastically scattered electrons are scattered in well defined directions depending on
the crystal structure o f the sample due to wave interference phenomenon as in x-ray
diffraction, [6,7,8,9]. T o determine the surface structure, the electrons detected need to
have originated only fro m the surface region. If the inelastic scattering mean flee path
o f the electrons is plotted as a function o f incident electron energy, figure 2.3, it can be
seen there exists a m inimum in the m ean flee path at an incident energy of approximately 60eV o f about 3A. This can be related to the depth o f penetration for
the detection o f elastically scattered electrons. Hence, to maximize surface sensitivity
the incident electron e n e rg y in a LEED experiment is usually operated in this region,
with energies ranging from 30eV to 300eV [7,10].
In a LEED experim ent a series o f diffracted beams may be observed on the
screen for a well o rd ered sample. The spacing o f these beams is proportional to the surface reciprocal n et vectors [6,7,11,40]. This means that one can define the
reciprocal lattice and hen ce deduce the real space lattice ( Pendry [6 ]). Usually LEED
is used as a routine test for well ordered samples, and in order to orientate the sample.
This latter use proved particularly valuable in this project.
2.2. Auger Electron Spectroscopy
The technique o f A uger Electron Spectroscopy provides information concerning
the elemental surface concentration. This information is obtained by monitoring a
particular electronic transition involving three electronic energy levels, figure 2.4,
discovered by P.A uger and co-worker [13] and is known as an Auger transition. Firstly, a vacancy is cre a ted in a core energy level by photon or electron ionization,
which is then filled by a m ore shallowly bound electron. This can result in one o f two
processes happening, resulting in either an electron or a photon being emitted. In an
Auger transition, one electron from a higher electron level fills the vacancy and at the
same time another electro n is emitted with the excess energy. This results in an
Me
an
fm
e p
a
th
(A
)
F ig u re 2 .3 A plot o f the inelastic scattering m ean free path o f electrons with incident kinetic energy. A minimum ex ists a t around a kinetic energy o f 60eV. (G.A.Somoijai, Principles o f Surface C hem istry. Prentice-Hall Inc. (1972))
EMITTED
.
ELECTRON ♦
0 C--- T
M i
B
K
v
/////jx
v
y
////sx
9
X
INITIAL
VACANCY
VAC
F
electron being emitted whose energy is characteristic o f the energy levels involved,
and leaves behind an ion with two electron vacancies. Since the energy levels are
characteristic o f the emitting atom the energy o f these A u g er electrons can be used to determine the elements that are present on the surface. T hese electron energies have
been tabulated for m ost elements [14]. Elements with less than four electrons cannot,
o f course, undergo an Auger transition. For elements up to an atomic number of 30 the
A uger process dominates over the radiative processes e v e n for the deepest energy
levels, figure 2.5, [ 9,16].
The labelling o f the individual Auger process is depicted in figure 2.6. The first
letter denotes the vacancy level, and the second and third letters denote the level from
which the electron which fills the vacancy originates an d the level horn which the A uger electron is emitted. With a knowledge of the en ergy levels involved in the
transition the kinetic energy o f the Auger electron can be calculated :
Ek=Ei -E2 - E 3 (1)
where
Ek = The final kinetic energy Ei = Initial vacancy energy level E2 = Energy level for vacancy filling electron
E3 = Emitted electron’s energy level
The kinetic energy deduced in this way will not be totally accurate if the neutral
ato m ’s binding energies are used, since the final state has tw o holes which will result in electronic rearrangement, [16,43]. In addition both the initial and the final state
energy are also sensitive to the chemical (electronic) environment, [16,17]. Consequently, there are small energy shifts associated w ith th e different environments.
The Auger transitions manifest themselves as p eaks in the electron energy distribution, see figure 2.2. These Auger features, in the electron energy distribution,
typically have a poor signal to background ratio, which m itigated against the use
Figure 1 5 An excited electron may lose energy by non radiative or radiative
processes. T he yield o f these tw o processes varies with atomic number, w ith the
form er being dominate upto an atomic num ber o f approximately 30 and is show n schematically in this diagram. ( G A Somorjai, Principles o f Surface Chemistry. Prentice-Hall Inc. (1972))
K l | l ] Li Ml Ml COSTUt K SONINS
Figur» 2.6 The labelling of Auger processes refers to the energy levels involved
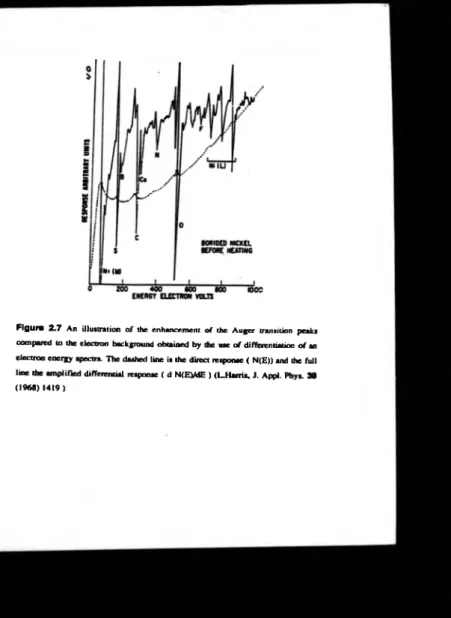
Auger spectroscopy for elemental analysis initially. The technique languished until
L.A. Harris [17] demonstrated that the peaks could be made more distinguishable by
differentiating the electron distribution spectrum, figure 2.7. The prominence o f the technique was further enhanced when it was shown that a normal l .F.F.H optics could
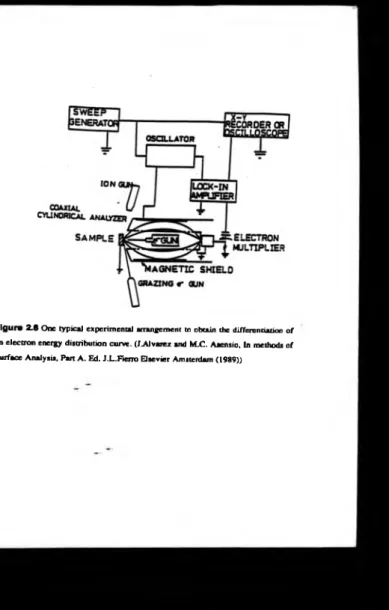
be used for Auger electron spectroscopy (AES) [18]. To obtain the best result from
Auger electron spectroscopy, however, it is better to ca n y it out with true dispersive
analysers, such as the Cylindrical M irror Analyser (CMA) [16,20], figure 2.8, or as in this project a Concentric Hemispherical Analyser.
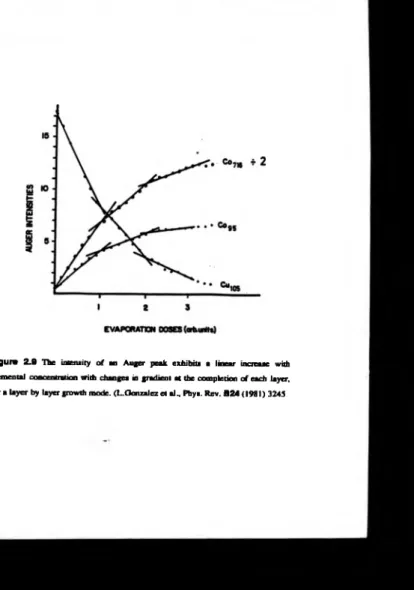
In addition to providing elemental identification, the concentration o f an element can be quantified [43]. In particular, if the growth mode o f an adsorbate is layer by
layer, the so called Frank-van der Merwe growth mode, the intensity o f the Auger
electron flux will exhibit a linear relationship with elemental concentration up to
monolayer coverage [12,16,19,43]. The linearity o f the signal may also exhibit
changes in gradient on completion o f a monolayer and still maintain a local linear
relationship [16,19,43], figure 2.9. Accurate determination o f the concentrations of the elements present can be determined provided the dependence of the Auger
electron intensities on elem ental concentration are calibrated. Hence, Auger electron
spectroscopy provides a m eans o f identifying and quantifying the elemental composition o f a surface.
2.3. Introduction to Ion Scattering
2.3.1. Binary Coflleion Modal
When a particle, such as an atom o r an ion, scatters o ff a crystal the resulting
backscattered flux is a m ixture o f particles in varying charge states and possessing a
variety o f kinetic energies. This backscattered flux contains information concerning
the type o f scattering events that have taken place. To extract the information carried in this flux a theoretical model to describe the situation is needed. One explanation o f
a particular scattering event can be obtained, by the application o f the classical binary
Figure 2 .7 An illustration o f the enhancement o f the A uger transition peaks
compared to the electron background obtained by the use o f differentiation o f an
Figure 2.8 One typical experimental arrangement to obtain the differentiation of
Figure 2.9 The intensity o f an Auger peak exhibits a linear increase with
collision model. The scattering conditions for which the binary collision model is obtained are depicted in figure 2.10. In this an atom o f mass m i is moving towards an
unbound isolated, stationary a to m o f mass m2; the incoming atom then scatters o ff the
stationary atom in a particular direction. The mathematical derivation is carried out in
appendix A, [84]. By applying energy and m omentum conservation, and ignoring
inelastic losses, the following equation can be obtained
» ( 1 + A H [ C o , 9 i ± ( AJ - Sin2 # i)in p (1)
where
Ei = Energy o f the backscattered atom
E2 = Energy o f the Incident Atom
A = Ratio o f the target mass to the incident atom m ass
01 = Total scattering angle
For this m odel to be a p p lied to ion scattering there are three assumptions being
made. The first is that the scattering atom in the crystal behaves as though it is
unbound, i.e. like a gas atom . This requires that the effects due to the lattice are
negligible during the scattering event; if they are not, the effective mass o f the scattering atom will be m odified since it is more strongly constrained than the free gas
atom. This increase in effective m ass would produce scattered ions with greater than expected kinetic energies. The second assumption is that the target atom is essentially
stationary; this is expected to be valid since the velocity o f the scattering atom is small
in comparison with the scattered incident particle [86]. Hence the incoming atom will
see a stationary lattice; also th e energy associated with the lattice vibration is
negligible compared to that o f th e scattering particle. The final assumption is that the
energy losses occurring during th e scattering events are entirely kinetic. This requires that the inelastic and electronic interaction energy losses are small compared to the elastic energy loss in the scattering event.
Figure 2.10 The scattering event utilized for determ ining theoretically the energy
transfers during a binary collision, is depicted here an d attributes the symbols used to the relevant particles.
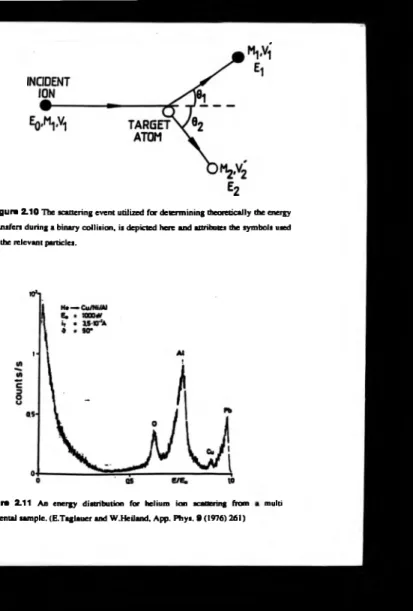
Figure 2.11 An energy distribution for helium ion scattering from
Historically, scattering reactions were first investigated using high energy
projectiles, for example Li*. H+ and He*-, with energies o f several MeV. It w as noticed by Rubin that peaks in his energy distribution spectra, a plot o f intensity versus ion
energy, could be explained by using the classical binary collision model [85]. Other
researchers observed that for H+ and He*, which have a large inelastically scattered
ion background, the maximum energy o f the backscattered ions could also be
explained with the same model. These peaks or maximum energy thresholds can be
related to a particular scattering element, and this then offered the possibility of precise elemental determination using well understood classical physics [87]. In
addition, the scattering cross-section o f any o f the ion atom combinations could be
calculated from first principles, and were found to be in good agreem ent with
experiment. At these energies the scattering cross-sections are small (» 0.1 À2 [22])
leading to substantial ion beam penetration. Hence this technique is insensitive to the surface, due to the surface information being obscured by the large bulk contribution to the data.
There are two different methods that can be employed to limit the contribution
o f scattering from the bulk. For HEIS one method is to choose a particular (crystallographic axis) incident direction, where the atoms align in parallel rows. In
this geometry the substrate atoms are shadowed by those close to the surface and the scattering signal becomes sensitive to any small atomic misalignment. T hese are
known to exist between the surface and the bulk, but the ability to detect these effects
relies on the small scattering cross-sections [15]. The choice o f the angle o f incidence
does rely, o f course, on a knowledge o f the bulk structure, but this is readily availible
from x-ray diffraction. Additionally, the enhanced surface sensitivity and well known
cross-sections allow the determination o f elemental concentrations. A disadvantage of this method is that specific crystallographic directions have to be used. Also, it is not
sensitive to low Z adsorbates on the surface, due to their relatively small scattering signals since the scattering signal is proportional to the scattering cross-section which
is proportional to Z2. A n alternative method o f improving the surface sensitivity o f the
incident particles is to reduce the kinetic energy o f the incident ions, thereby
increasing the scattering cross-sections, which then reduces the penetration o f the ion
beam. This decrease in the energy o f the ions then increases the time ions are in the
vicinity o f the surface. Since there is now an increase in the collision time, it was not known if the binary collision model predictions would correspond to the scattering
peaks at these lower energies. Research was carried out in this area by various
researchers, [87,89,90,91,92]. These experiments utilized ions with energies ranging
from 0.4 keV to 100 keV, and it w as found that the binary collision model was valid over this energy range.
The validity o f this model has been found to hold for ion energies greater than
400eV upwards. Below approximately 200eV Hulkpe [93] discovered deviations from the binary collision approximation. W hen examining equation 1, it can be seen that
there is the possibility for two values o f the energy ratio to be obtained for a particular
set of conditions, due to the ambiguity o f sign o f the square root. From the theory in
appendix A it can be deduced that fo r values o f the mass ratio. A, greater than 1 it is only a single valued function; for A less than 1, two values for the energy ratio will be
obtained. The prediction o f two values indicates that there would be tw o peaks in the
energy distribution due to scattering o ff the same atom. The validity o f the double
valued case has been established by experiment, for example [94]. The results o f the binary collision model suggest that by analysing the energies o f the backscattered ions
the identity o f the scattering atoms can be identified. Thus, in principle this provides a
method for mass analysing the sample without having to destroy i t There are however,
a few points to be considered before the technique can be applied. For instance, how w ell resolved are the peaks, what are their intensities, and what effect does the mass of
the incident ion have? These are important points if the elements within the sample are
to be accurately determined.
To identify the elements which are present in the sample the ions have to be
energy analysed and the result presented as an intensity versus energy diagram, an
should be chosen to be greater than one, which reduces th e number of peaks to one for
each elem ent, provided only singly charged ions are detected, as is found
experimentally. T o obtain a value for A of greater than one for the lightest adsorbate, it is necessary to use incident ions such as helium, hydrogen o r lithium; this reduces the
number o f peaks, but degrades the mass resolution o f the spectrum. The energy
resolution o f the spectrum is a function o f the analyser the incident ion beam energy
spread and the angular acceptance o f the analyser. Setting the energy resolving power
to fixed value and using the binary collision model an expression for the mass
resolving pow er can be determined to be (see appendix C a n d
[86]):-M 2 - £ , . 2A_ . A + S in ^ i- Cos 9 i( A 2-Sin2e ,)1'2 (2) AM2 AEi (A + l) ( A ^ S in ^ i+ C o s 0 i(A 2-Sin26 i ) 1'2) where
AM2= Mass resolution o f the spectrum for the target mass AEj = Energy resolution o f the instrument
The m ass resolving power o f the spectrum therefore depends on the scattering angle, mass ratio and the backscattered ion energy. It is linearly dependent on the
energy o f the backscattered ion energy, and therefore the mass resolving power increases with increasing ion energy for a fixed energy resolution. Hence, the peaks in
a given energy distributions should become sharper the larger their energy. The easiest
method to visualize the effect o f the other variables on the m ass resolving power is to
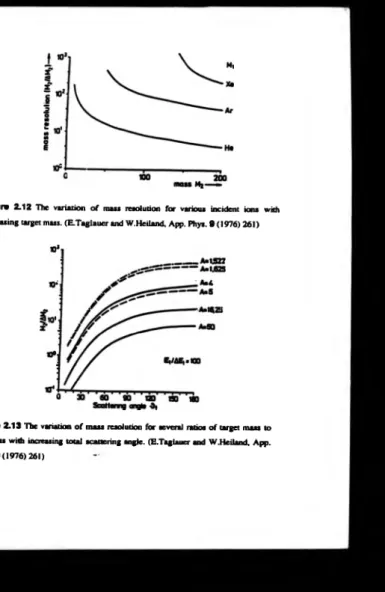
employ a graphical method. In figure 2.12 the mass resolving power is plotted as a function o f incident ion mass; a further point to note, is th at the mass resolving power
increases fo r a particular atom ’s mass with increasing incident ion mass. These facts
suggest that the method o f obtaining greater mass resolution is to employ larger
incident ion m asses. Also, to maintain the one peak per elem ent present m eans there is
an upper lim it placed on the -incident ion mass, im posed by this condition. The decrease in the gradient with increasing target mass indicates that the resolution o f the
peak for the larger masses is asymptotic. A variable related to these effects is the
Figure 2 .1 2 H ie variation o f m arl resolution for various incident ions with
increasing target mass. (E.Taglauer and W.Heiland, App. Phys. 9 (1976) 261)
Figure 2 .1 3 The variation o f m ass resolution for several ratios o f target mass to
variation in mass resolving power with the scattering angle for different mass ratios,
figure 2.13. If the mass ratio is decreased for a given scattering angle, the mass
resolving power increases, this implies that the closer the ion and atom are in mass the
better the m ass resolution. This set o f conditions also exhibits an asymptotic relationship, in this case the change in m ass resolving power is decreasing with
increasing scattering angle. We therefore have a choice as to whether to use a heavier
ion or a large scattering angle. The advantage o f using a large scattering angle is that
the change in mass resolving power is small as a function o f the scattering angle;
therefore the resolving power is constant for the whole o f the acceptance angle o f the
analyser, providing it is not too large.
Up to this point the discussion has concentrated on the scattered ion, the other
part of this interaction is the effect on the target atom . O f importance is the amount of energy the scattering atom receives and what happens to it after the collision. To
obtain a first approximation o f the event the binary collision model can be used, it will
only describe its initial reaction due to the effects o f atom ic bonding afterwards. The model is applied to the target atom; from this ratio o f the target atom energy (E2) to the
energy o f the incident ion (Eo) is given by
£2 = 4.A • COS2 02 (3)
Eo < 1 + A )2
See appendix B for the derivation.
This equation is a single valued function, in contrast to the scattered ion equation (1) and indicates the amount o f energy deposited in the sample. The strength
o f the atomic bonding has not been taken into account, and this will affect the final
trajectory that the target atom follows after the collision. The energy deposited will not
be entirely retained by the atom, it will be comm unicated to the other members o f the
lattice. As a result an atom m ay even escape the surface, i.e. sputtered. This requires at least two atoms to reverse the initial recoil direction, since the reaction provides
momentum directed into the sample. The sputtering has been investigated by several
researchers [88.94,93.96].
2.3.2. Shadow Cones and Potentials
Using the preceding theory it is clear that if the energy o f the scattered ion can
be determ ined for a particular set o f experimental conditions, the scattering atom ’s
identity can be established. However, this will not provide information on the spatial
distribution o f the atoms. This information is obtained as a result o f the phenomenon
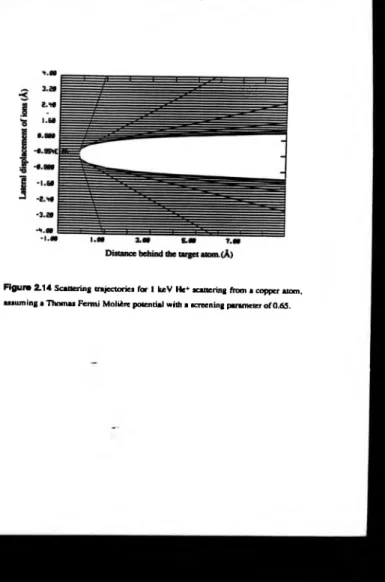
o f shadowing. If the trajectories o f all possible incident ions are examined it is found that there exsists a region behind the scattering atom into w hich no ions penetrate,
figure 2.14, [27,28,43]. If another atom is situated in this region it will not be ‘seen’
by the incom ing ion flux, i.e. it is shadowed. For low energy ion scattering the width
o f the shadow cones is o f the order o f A ’s, hence, it is comparable with the interatomic
spacings fo r crystals. The shadow cone then obscures a large proportion o f the lower atomic layers o f the crystal. Note that if the edge o f the shadow cone is examined, it
can be seen that there is an increased flux density compared w ith the incident density.
This “ focussing” at the edge o f the shadow cone is important in the determination o f
surface structure, and will be discussed later. In order to calculate the trajectories qualitatively an expression for the interaction potential is required.
T he interaction potential has to take account o f a large num ber o f variables. This is because the two interacting particles are not single entities, but they consist o f
nuclei and electrons. Therefore, the potential has to include contributions from the electron-electron, electron-nuclei and nuclei-nuclei interactions. To a good
obtained:-Figura 2 .1 4 Scattering trajectories for 1 keV He* scattering from a copper atom,
(4)
n n n
y _s l_ - Y - z ^ ♦ y -Z2-S? ♦ ZlZis?
; L u 4iteoTij i —t “ICuT, émà 4jteoTj 4weori2
Ki i j
electron/ electron / electron / nuclei 1/
electron nuclei 2 nuclei 1 nuclei 2
This is quite a complex equation, and requires many assumptions in order to utilize it. In high energy Rutherford B ackscattering the usual form o f the potential is
the Coulombic intem uclear potential only, the electronic contributions being
negligible. A n indication o f how close the ions approach the scattering atom can be
obtained by equating the potential energy to the kinetic energy, see L.C. Feldman
[42].
E = Z i Z z c l (5)
d(4K£o)
from w
hich:-d = Z i Z? c2 (6)
H(4KEo)
where
E ■ Kinetic Energy o f the Incident Ion Z i= Ion's atom ic number
Z2* Atom's atom ic number e = Electronic charge
d = Distance between the ion an d the atom
Therefore for a 1 M eV helium scattering o ff a copper target atom, has a distance o f closest approach o f »8.3x10⁻⁴A. In comparison the first Bohr radius is *0.53A,
electron cloud and sees an unscreened nucleus a t its closest approach. This then allows the use o f pu re nuclear coulombic repulsion for the potential. In comparison, taking
the energy as IkeV leads to a distance o f closest approach o f -0 .8 3 A . In this case the
ion perihelion is in amongst the orbital electrons, which indicates that the electronic
contribution will be more significant. The potential in equation 4 includes these
interactions, but this many electron potential cannot be evaluated.
In describing the scattering o f the low energy ions several appropriate
potentials have been developed and utilized. In this energy range there has to be an allowance fo r the screening of the nuclear charge by the electrons. The potentials are
semi-empirical in nature, with the initial theory being refined by comparison with
experimental data, due to the uncertainty concerning the description of the multi
component interactions which take place. Potentials that have been used are the
Morse, Bom -M ayer, Thomas-Fermi, Gibson, Bohr and others, [23,24,23,29,30,34,38, 40]. There h as been an attempt also to produce a universal potential to cover the low
and the high energy ranges ( O.lkeV - IM eV ) o f the incident ions, Oens [26]. In the
empirical derivations the simplest assumption is to consider the atom as a hard sphere
potential with infinite height within the defined radius. A more refined approach is to include a short range attractive force. This approach has been used in the Lennard-
Jones and the M orse potentials [38]. These potentials were used in the early days o f
ion and atom scattering and are applied at the present. Another potential that has been
used was the Bom -M ayer potential [25,34,38]. This is based on an exponential decay function o f the form
:-V(r) ■ A e -Br (7)
where A and B are the adjustable parameters, and were adjusted to agree with
experimental data. This was first proposed by B om and M ayer in 1932 to describe the
interatomic potentials in ionic crystals. The potential becomes less accurate for small
distances o f separation - values for the two constants have been tabulated for various
atom pairs by Abrahamson 1969 [97]. The virtue o f this potential is its simplicity and
that it is able to describe the scattering events particularly for low energies. It has been
revised by Huntingdon and Gibson to reduce its essentially infinite range to the order o f the lattice spacing o f crystals, [33]. W.l. Gray et al. [36], have studied its accuracy
over the energy range 25eV to lOkeV. They carried out the investigations on a
computer for various crystal structures, and it was found that the results obtained
agreed with the predictions o f the binary collision model for scattering events. However, the Bom-Mayer potential has largely been supplanted by the Thomas-Fermi
( I F) potential in recent years, [24,28]. This belongs to another group o f potentials
which are based on a screened Coulom b potential and are o f the
form:-V(r) - .Z u Z z s 2 X ( 0 (8)
4 n £ o r
where x(r) = The screening function
One o f the simplest screening functions was proposed by Bohr, and utilized an
exponential function for the screening function. The T F potential was proposed a t approximately the same time and was originally developed for the interatomic
potentials in crystals, was based on T F statistics [40], and was first developed for one atom. This potential has its lim itations, in that it was found to be too soft a t short
interatomic distance and too hard at large distances. These inaccuracies could be partly
attributed to the lack o f incorporation o f the influence o f electronic exchanges. This
was addressed in further developm ents, the two main variations are the Thomas- Fermi-Dirac (TFD) and the Thomas-Fermi-Firsov approximations. It is the latter
which forms the basis o f m ost low energy ion scattering calculations, including those
in this thesis. Firsov [24] derived the lim its o f accuracy o f his potential and concluded
(9)
U(r) = Z ,Z ie 2 .
x(l
Z^* + Z ^ ] M r/a ) 4 n Eo rwhere x(r) is a screening function
a = screening length
T h e form of the screening function used in this research is due to Moliere
[28,43] and is used in the m ajority of ion scattering sim ulations at the present. The potential then has the form
U(r) - Z . Z? e2 . X( r/a) (10)
4 x £ o r
and the screening function is given by
X(x) = 0.35 exp(-0.3x) + 0.55 exp(-l .2x) + 0.1 exp(-6.0x) (11)
where x = (r/a C)
For the Firsov approximation a * 0.4685 ( Z ^ + ) -2/3 (12)
C is an adjustable parameter, and is adjusted by comparison with experiments.
As has already been mentioned, there is a region o f space in which incident ions
do not enter, known as the shadow cone. A useful variable to deduce is the width o f the shadow cone for different distances behind the shadowing atom. This will also
provide an indication o f the area o f the crystal shadowed. T he behaviour o f the shadow cone can be derived numerically using a useful result from classical theory. I f the
potential is considered to be spherically symmetric, then an expression for the total
scattering angle o f the ion can be deduced
It - ____________2 b d r
rH 1 - (b 2 /r2 ) + (V(rVE)i/2
(13)
where
b = Impact parameter
E = Kinetic Energy o f the incident ion
9cm = Total scattering angle in the center o f mass ñam e.
T he total scattering angle obtain from this equation needs to be converted to the laboratory frame o f reference, before it can be used to plot trajectories. A shadow
cone is depicted for IkeV helium in figure 2.14. Using this equation a relationship for
the shadow cone w idth has been derived by Martynenko [98] and also by Oens [26].
2.3.3. Neutralization
W hen an ion approaches a surface electron exchange can occur between its
filled and partially filled and empty electron orbitals, and those o f the surface. T h e
complex interaction o f the orbitals will determine the final charge state of the ion. T h is interaction has been the subject o f intense investigation from the earliest days o f ion
scattering [45,46,47]. At present research is proceeding on experimental a n d
theoretical fronts. Experimental work is mainly concerned with the determination o f the em ergent charge fractions, and the effects o f the presence o f adsorbates [ 5 1 -
83.99].
A neutral atom can be produced by several different electronic interactions, e ach
having its own probability o f occurrence. Usually, there are considered to be only fo u r
types o f interaction and these are depicted in figure 2.15. In these diagrams the io n ’s
energy levels are depicted on the right and the surface’s conduction band on the left- in
(al
AUGER
NEUTRALIZATION
(U
RESONANT
CHARGE EXCHANGE
AUGER
OE-EX CITATION
US
QUASI -RESONANT
CHARGE EXCHANGE
R g u r t 2 .1 5 T he possible electron processes between the incoming ion and the target metal surface. The surface’s conduction band is situated on the left and the
figure 2 .IS this is assumed to be a metal. All o f these processes are still available to
semiconductors and insulators. In these schematic diagrams there is no explicit indication o f the distance between the ion and the atom. These charge exchange
processes have no definite range, but according to quantum mechanics the probability
o f electronic transitions decays exponentially with increasing distance. Evidently this means that a full analysis requires the neutralization process to be followed through
the entire trajectory. Note that if an electron can hop from the surface to the atom, it
may also be possible for the electron to hop back to the surface. The probabilities for these two processes are not necessarily the same. Hence, the ion maybe engaged in
both neutralization and ionization processes during its scattering trajectory. In addition, each part o f the trajectory will also have a different effect on the final charge
state of the ion. This has been investigated by Aono [49,50] for various helium
ion-atom combinations. The charge fraction o f the detected particles is a reflection of the average charge state o f the ions during the interaction.
Returning to Figure 2.15a the first mechanism illustrated is Auger neutralization. This is a two electron process resulting in a ground state neutral atom.
For this to proceed the incoming ion must have an unoccupied energy level of sufficient depth for the neutralizing electron. An electron from the solid first tunnels
into a hole state on the ion and the excess energy is then used to liberate an electron
from the conduction band. As in the case o f Auger Electron Spectroscopy the energy
o f the Auger electron released depends on which levels are involved. A theoretical study o f this process has been carried out by Cobas and Lamb and Hagstrum [45,46].
In figure 2.15b the one-electron process o f resonant neutralization/ionization is
depicted, in which an electron tunnels through the surface potential barrier into an
available ion level o f approximately the same energy, leading to a process which is non-radiative. If the io n 's energy level is situated below the Fermi level o f the metal,
the reverse process o f resonant ionization is unlikely. However, if the ion’s energy
level is broadened by reaction with the surface so that it straddles the Fermi level,
energy levels o f the ion shift as it approaches the surface, due to the image charge potential. As the ion approaches the surface the energy level decreases in negative
potential energy and broadens [45,46]. In figure 2.15c the process A uger de-excitation
depicted is a variation on 2.15a, though this time involves an excited atom rather than an ion. As before an electron from the solid tunnels into a deep ion energy level, but in
this case the available excess energy is taken away by the electron situated in the
excited energy state o f the ion and the neutral atom is therefore de-excited. The
emitted electron again carries information about the energy levels. In the final process
(figure 2.15d) quasi-re sonant charge exchange and depicts an electron tunnelling from
a deeper lying level in the solid into a deep level o f the incoming ion leaving it in the ground state. The reverse process o f the electron tunnelling from the now neutralized
ion into the valence band is likely and produces the oscillations in the elastic ion
scattering intensity detected, for ion-atom combinations with the relevant energy levels [101],
Because they are experimentally separable the trajectory is usually considered in
three sections; the incoming path phase, the collision and the returning path phase [48,52,53,54,55]. This has been investigated by Aono et al. [21] for He+ scattering o ff
a range o f materials. Their analysis demonstrates that for He* the m ain neutralization
path is via the Auger neutralization for m aterials with work functions greater than 4eV. Close to this energy there are two helium energy levels, 2>s a t 4.1 eV and the 23s
a t 4.7eV [45]; which can become involved in resonant neutralization and ionization.
According to Souda the resonant ionization has a probability o f one, thereby leaving
the helium atom in an ionized state [22]. For noble gas ions the dominant process is
usually considered to be the Auger process (except for materials for which the energy levels are well matched for q uasi-re sonant charge exchange) due to the availability o f
deep hole states on the ion and this accounts for their small charge fraction. For alkali
ions, the ionized energy level is close to the Fermi level [50] and the only available
process is the resonant charge exchange. This, according to current ideas, has a much higher probability o f occurrence, but the charge fraction is much larger, because the
equilibrium state is not neutral.
2.3.4. Features of Ion Scattering Spectroscopy (ISS)
The proceeding sections have dealt with the individual facets o f a scattering
experim ent In this section the various aspects are drawn together with relevant examples. Before performing an ISS experiment there are several details to consider,
such as which ion should be used. In studies o f elemental composition the important aspects are the surface sensitivity and specificity. These are linked to the neutralization
probability, scattering cross-sections and shadow cone widths, which are all related to
the depth o f ion penetration. The significance o f neutralization can be appreciated by
considering figure 2.16, which depicts energy distribution spectra for He* and Li+ ion scattering o ff Cu(110). The first thing to notice is the difference in the background.
The Li+ spectrum has a large inelastic background on which elastic peaks must sit,
whereas the helium spectra is entirely devoid o f an inelastic background. To the right
o f each spectrum is the copper binary collision peak. The backscattered flux is a mixture o f scattering events from several layers. For helium ions the probability of
neutralization for surface scattering is approximately 0.95, but this is greatly increased
for ions penetrating below the surface which then have a very high probability of
being neutralized [99]. Since the experiments usually detect ions the neutrals are ignored, hence the detected flux is only sensitive to the surface. In view o f the fact
that inelastically scattered ions, which could lead to a background, must penetrate
below the surface to undergo such inelastic collisions, the ion background is low
because these are precisely the trajectories most likely to be neutralized. The result is that there is no background below the elastic scattering peak in the energy distribution
spectrum. T h is poses the question, why does lithium have a background and helium
not? The answ er lies in the difference in the neutralization mechanisms. Since we are detecting ions only in the experiment, the ion has to travel to the atom, undergo a
collision and then return to the analyser in an ionized form. In lithium the ionized state
is much shallower than for helium. This has the effect of shifting the charge
will return with a wider range o f energies and this w ill manifest itself as a background.
In the discussion presented, the scattering has been dealt with in terms o f a
single collision, though the ion does not have to only scatter o ff a single atom.
However, multiple collision trajectories can be treated as a series o f binary collisions.
This then allows the determination o f the final e n e rg y o f the ion for a given number o f
collisions. LTerzic [100] produced a formula for n scattering events o f equal scattering
angle collisions, which has the formi
l i . 1 . [ Cos20 + ( A2 - Sin20) 1/2 ]2n (14)
E o (1 + A )2n
If this equation is applied to a two event scattering trajectory, it is discovered that the final ion energy is larger than for the sin g le atom scattering collision. This
leads to the possibility o f additional peaks in the e n erg y distribution spectrum due to
multiple scattering events. Thus the ions may return to the detector via a variety o f
scattering events, though for He* ion scattering the m o re tortuous trajectories will have
associated enlarged neutralization probabilities.
W hen studying the intensities o f the energ y distribution scattering peaks the
question arises; how is the elemental concentration related to this? The first problem
is the effect o f the neutralization which will vary depending on the ion used and the
element under investigation. In addition to this, the intensity is dependent on the
scattering cross-section o f the atom. Classically th is is defined as [42,84,86].
do(0). d ii. Ns * nos o f particles scattered in to solid angle di i /unit time (15)
d i i Incident intensity
where
0(0) = the differential cross-section N s» the number o f scatters
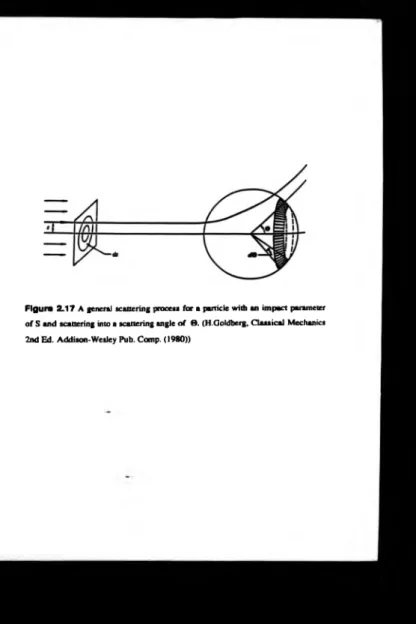
By considering a general scattering process, see figure 2.17, the differential
[84,86]:-Figure 2.17 A generai scattering process for a particle with an im pact parameter
o f S an d scattering into a scattering angle o f 8 . (H.Goldberg, C lassical Mechanics
where
0(6) _ S _ . dS
SIN 0 d0
(16)
S s the impact param eter
For this to be determined theoretically the form o f the potential needs to be
known. Accurate calculations are m ost reliable for high energy ion scattering where
the Coulomb potential is applicable. Alternatively, one can attempt to perform
calibration experiments. For noble gas ions this may not always be possible due to non-linearities in the scattering intensity versus concentration curve [90]. For a
calibration to be valid the neutralization rate must be constant, but it is known that the
neutralization depends upon the surface electronic structure. If the surface reconstructs
2.4. References
1. W. Heiland, F.Iberl, E.Taglauer and D.Menzel, Surface Science 53 (1975) 383
2. C J . Barnes, MXindroos, D J.H olm es and D.A.King, Surface Science 219 (1989) 143
3. D.L. Adams, H i . Nielsen an d J.N . Andersen, Surface Science 1 2 8 (1983) 294 4. O.P. Thompson and A. Reid, Nature 1 1 8 (1927) 890
5. C J . Davisson and L.H. G erm er, Nature 119 (1927) 558
6. J.B. Pendry, Low Energy E lectron Diffraction. Academic Press (1974) 7. M-A.Van Hove, W .H.W einberg and C.M. Chan, Low Energy Electron
Diffraction. Springer - V erlag Berlin Heidelberg (1986) 8. L J . Clarke, Surface Crystallography. John W iley and Sons (1985)
9. G.A. Somorjai, Principles o f Surface Chemistry. Prentice-Hall Inc. (1972) 10. M. Pnitton, Surface Science. Clarendon Press (1983)
11. D. McKie and C. McKie, Essentials o f Crystallography. Blackwell Scientific Publications (1986)
12. J.H. Onerferko and D.P. W oodruff, Surface Science 9 1 (1980) 400 13. P.Auger, J. Phys. Radium 6 (1925) 205
14. P.W. Palm berg, G.E. Riach, P.E. Weber and N.C. MacDonald, Handbook of Auger Electron Spectroscopy. Physical Electronics Industries Inc. (1972) 15. D.P. W oodruff and T.A. Delchar, Modem Techniques o f Surface Science.
Cambridge University Pree (1986)
16. J .Alvarez and M.C. Asensio, In Methods o f Surface Analysis, PartA. Ed. J.L. Fierro. Elsevier Amsterdam (1989)
17. L. Harris. J. Appl. Phys. 3 9 (1968) 1419 18. N J . Taylor. Rev. Sci. Instrum . 4 0 (1969) 792
19. L.Gonzalez, R. Miranda, M . Salmeron, J.A. Vaergas and F. Yndurain, Phys. Rev. B. 24 (1981) 3245
20. H.Siegbahn and L. Karlsson, Photoelectron Spectroscopy Handbuch D. Physik 31 Ed. W. Mehlhom
21. M. Aono and R. Souda, Surface Science 1 7 9 (1987) 199