ORIGINAL RESEARCH
Mild Hypoxic-Ischemic Injury in the Neonatal Rat
Brain: Longitudinal Evaluation of White Matter
Using Diffusion Tensor MR Imaging
S. Wang E.X. Wu K. Cai H.-F. Lau P.-T. Cheung P.-L. Khong
BACKGROUND AND PURPOSE: Selective white matter (WM) damage is a known sequela of mild
hypoxic-ischemic (HI) injury in the neonatal rat model. The aim of this study was to evaluate longitu-dinally mild HI-induced WM damage (represented by the external capsule [EC]) by diffusion tensor MR imaging (DTI) and to correlate the findings with histology.
MATERIALS AND METHODS: Seven-day-old Sprague-Dawley rats (n⫽19) underwent unilateral ligation of the left common carotid artery followed by hypoxia for 50 minutes to create mild HI injury. DTI was performed longitudinally at 5 time points from day 1 to day 90 postinjury (n⫽19, 16, 13, 11, 9, respectively), and fractional anisotropy (FA), trace, radial diffusivity (⬜), and axial diffusivity (//) of the injury and control contralateral ECs were quantified. Rats were randomly sacrificed (n⫽15, in total), and the corresponding ECs were stained with hematoxylin-eosin, Luxol fast blue (LFB), and neurofila-ment (NF) to evaluate morphologic changes, amount of myelin, and axonal count at every time point. A pairedttest was applied to evaluate statistical differences between both ECs, and the Pearson correlation test was used to evaluate the relationships between DTI indices and histologic evaluations. In addition, longitudinal changes in DTI indices and histologic evaluations were analyzed by a linear mixed model and an analysis of variance test, respectively.
RESULTS: We demonstrated significantly decreased FA, increased⬜, and similar //in the injury compared with the control EC, which was persistent through all time points. Histologic evaluation by LFB and NF staining showed reduced myelin stain intensity in the injury EC and similar axonal counts in both ECs. Longitudinally, there was an increase in FA, a decrease in⬜and trace, and stability in// in both ECs. Also, there was progressive reduction in the differences in FA, trace, and⬜between the injury and control EC, especially between day 1 and day 7 postinjury and in tandem with changes in myelin stain. FA was significantly correlated with myelin stain (r⫽0.681,P⬍.01) and axonal count (r⫽ 0.673,P⬍.01), whereas⬜was significantly correlated with myelin stain only (r⫽ ⫺0.528,P⬍.01), and//,with axonal count only (r⫽0.372,P⫽.043).
CONCLUSIONS:Diffusion indices can reflect dysmyelination in mild HI injury, continual myelination of both injury and control ECs with growth, and the partial recovery of myelin postinjury. We propose that diffusion indices may be used as biomarkers to monitor noninvasively the longitudinal changes of mild HI-induced WM damage.
I
t has been demonstrated in the neonatal rat model that hy-poxic-ischemic (HI)-induced brain damage can lead to mild or severe injury by varying the HI duration (ie, 50 minutes versus 90 minutes).1-3Although severe injury is characterizedby tissue loss and necrosis in both white matter (WM) and gray matter (GM),3mild injury leads predominantly to WM damage.4Such selective WM damage in mild
hypoxia-isch-emia may be due to apoptosis of immature oligodendrocyte progenitors and dysfunction of mature oligodendrocytes, which are susceptible to HI injury.5,6Histologic studies have demonstrated reduced myelination4but with normal axons.7
Understanding the evolution and outcome of WM damage after mild HI is important due to its close correlation with
prognosis.8Also, it has been demonstrated clinically that
ne-onates with mild HI encephalopathy (HIE) have the potential ability to recover with good clinical outcome after treatment by using selective head cooling and mild systemic hypother-mia9or whole-body hypothermia.10In an animal study, hypo-thermia was also demonstrated to have protective effects in mild but not in severe hypoxia-ischemia.11Therefore, it is also
useful to identify a noninvasive method to detect and monitor the evolution of HI-induced WM damage for treatment selec-tion and to determine the effectiveness of treatment.
Diffusion tensor MR imaging (DTI) allows the mapping and measurement in vivo of the 3D diffusion of water, which reflects the microstructure of WM such as the integrity of my-elin and axons. Quantitative analysis of diffusion indices of DTI in experimental models has demonstrated that increased radial diffusivity (⬜) is associated with demyelination12or
dysmyelination,13and reduced axial diffusivity (
//) reflects
axonal degeneration.14 In addition, DTI indices have been found to reflect normal development of neurologic tissue in vivo with increased fractional anisotropy (FA) and decreased
⬜with maturation of WM.15-17
In this study, we quantitatively evaluated the longitudinal changes of DTI indices at 5 time points from day 1 to day 90 in a mild-HI neonatal rat model, representing the neonate-to-Received March 25, 2009; accepted after revision April 30.
From the Department of Diagnostic Radiology (S.W., P.-L.K.); Laboratory of Biomedical Imaging and Signal Processing, Department of Electrical and Electronic Engineering (E.X.W., K.C., H.-F.L.); and Department of Pediatric and Adolescent Medicine (P.-T.C.), The University of Hong Kong, Hong Kong, P.R. China.
This work was supported by The University of Hong Kong Committee on Research and Conference grants (HKU7587/06M and HKU 7793/08M).
Please address correspondence to: Pek-Lan Khong, MD, Department of Diagnostic Radi-ology, Blk. K, Room 406, Queen Mary Hospital, The University of Hong Kong, 102 Pokfulam Rd, Hong Kong; e-mail: plkhong@hkucc.hku.hk
DOI 10.3174/ajnr.A1697
BRAIN
ORIGINAL
young adult period, and correlated the diffusion indices at every time point with histology. We aimed to evaluate the evolution of HI-induced WM damage, represented by an ex-ternal capsule (EC), the main region of insult in this mild HI model,1,4in particular to determine if there were continual
maturation and a component of recovery of WM damage and if this may be monitored by DTI indices.
Materials and Methods
Animal Model Preparation
According to the local government legislation, the experiment was approved by the University Animal Ethics Committee. Seven-day-old Sprague-Dawley rats (n⫽19) with a mean body weight of 18⫾2 g were obtained from the Laboratory Animal Unit of The University of Hong Kong. Briefly, the 7-day-old rats underwent unilateral ligation of the left common carotid artery via a midline neck incision after anesthesia with 0.2 mL of inhalational isoflurane in an airtight box for 2 minutes. After that, they were returned to their mother for nursing for 2 hours until they regained normal movement. These rats were subsequently placed in a hypoxic chamber of 8% O2/92% N2 main-tained at 37°C for 50 minutes to create mild HI injury.18
MR Imaging Data Acquisition
The rats underwent MR imaging at post-HI injury day 1 (n⫽19), day 7 (n⫽16), day 14 (n⫽13), day 30 (n⫽11), and day 90 (n⫽9) postsurgery. DTI and T2-weighted MR imaging were performed by using a 7T nuclear MR scanner with a maximum gradient of 360 mT/m (Version 70/16; PharmaScan, Bruker Biospin, Rheinstetten, Germany) with a microimaging mouse brain coil (for day 1 and day 7) or a rat brain coil (day 14, day 30, and day 90). During scanning, rats were prostrate on a custom-made holder with strapping to minimize head motion while respiration was monitored. Under inhaled isoflu-rane anesthesia (3% for induction and 1.5% for maintenance), scout images were first acquired in 3 planes with a T2-weighted sequence to position the subsequent DTI images along standard anatomic orien-tations. Coronal T2-weighted images were obtained to confirm the lack of cystic lesions from 2 mm anterior to the corpus callosum to the end of the cerebrum with the following parameters: TR⫽11,189 ms, TE⫽20 ms, FOV⫽2.5 cm2, acquisition matrix⫽128⫻128, section
thickness⫽1.0 mm. DTI images were acquired with a respiration-gated spin-echo 4-shot echo-planar imaging sequence and an encod-ing scheme of 35 gradient directions, which were uniformly distrib-uted on the unit sphere. We used the following imaging parameters: TR⫽3000 ms, TE⫽32 ms,⌬ ⫽20 ms,␦⫽4 ms, FOV⫽3.2 cm2(for
day 1 and day 7), 4.0 cm2(for day 14, day 30, and day 90), thickness⫽
0.5 mm (for day 1 and day 7), 0.7 mm (for day 14, day 30, and day 90), acquisition matrix⫽128⫻128 (zero-filled to 256⫻256), image resolution⫽250⫻250m2(for day 1 and day 7), and 313⫻313
m2(for day 14, day 30, and day 90), acquisition time⫽8 minutes,
b-value⫽0 and 1000 s/mm2.
All diffusion-weighted images were first coregistered by using AIR, Version 5.2.5 (http://bishopw.loni.ucla.edu/AIR5/index.html) to compensate for the eddy current⫺induced displacements that were dependent on the diffusion-gradient directions. DTI indices, including FA, trace, and eigenvalues (1,2, and3), were obtained by
using DTIStudio, Version 2.30 (Johns Hopkins University, Balti-more, Md). Then, FA, trace,//, and⬜maps were created for quan-titative analysis by the following equations:
1) FA⫽
冑
1 2冑
共1⫺2兲2⫹共
2⫺3兲
2⫹共
3⫺1兲 2
冑
12⫹
2
2⫹
3
2 ,
2) Trace⫽1⫹2⫹3,
3) //⫽1,
4) ⬜⫽0.5⫻共2⫹3兲.
Image Analysis
After the generation of FA, trace,//, and⬜maps, a region of interest was manually drawn over the EC of each hemisphere on the FA maps (Fig 1) on 5 consecutive sections.18The EC was used as a target area
for the following reasons: 1) The EC is an easily identified WM tract with a high visual resolution in the DTI maps. It is commonly used to evaluate the WM in rodent models.4,19,202) It has been reported that
the EC is a major WM damage region in the mild-HI-injury neonatal rat model,4,18whereas mild HI insult produces a relative sparing
in-jury of GM.1,4A region of interest was first defined in the FA map
because of its relatively clear WM/GM boundary. Then, the regions of interest were transferred to identical sites on the trace,//, and⬜ maps. ImageJ 1.36b (National Institutes of Health, Bethesda, Md) was used to evaluate the quantitative indices in all image maps. Images were excluded from analysis if the boundary of the EC could not be demonstrated due to motion artifact.
Histopathology Evaluation
Rats were randomly selected for histologic evaluation of WM damage (day 1,n⫽3; day 7,n⫽3; day 14,n⫽2; day 30,n⫽2; day 90,n⫽
5). Brain specimens were processed by using standard histologic pro-tocols. Briefly, rat brains were perfusion-fixed through the left cardiac ventricle with phosphate-buffered saline (PBS) followed by 4% para-formaldehyde (PFA) in PBS. The specimens were fixed in 4% PFA in PBS (pH 7.4) at 4°C overnight. The brains were put into a 30% su-crose solution in PBS for a few days. Coronal sections were obtained from each brain by frozen sectioning. Brain specimens were cut into 10-m-thick coronal sections between the locations corresponding to the most posterior and anterior MR imaging sections. Then the brain sections were stored at⫺70°C until immunochemical analysis. Hematoxylin-eosin (HE) stain was used to evaluate morphologic characteristics of WM. Luxol fast blue (LFB) staining was performed to evaluate the amount of myelin in WM. Tissue sections were pro-cessed as free-floating and were incubated in the monoclonal anti-body to panaxonal neurofilament marker (NF) (SMI-312, 1:1000) for
[image:2.594.304.535.43.183.2]immunohistochemistry staining of axons. Appropriate secondary an-tibodies were used at a dilution of 1:200 in 0.1 mol/L PBS and incu-bated in the secondary antibody goat antimouse immunoglobulin G fluorescein isothiocynate.
Histologic specimens were analyzed within the region of EC cor-responding to the quantitative MR imaging measurements. All sec-tions were examined by using a light microscope (Axioplan 2 imaging system; Carl Zeiss, Goettingen, Germany) under 10⫻ ⬃400⫻ mag-nification. Histologic images were acquired at the same exposure level by digital photomicrography (SPOT Advanced; Diagnostic Instru-ments, Farmington Hills, Mich) and quantitatively analyzed by using ImageJ software. To quantitatively evaluate the LFB stain, we mea-sured optical attenuation of LFB-stained sections in both symmetric ECs at 200⫻histologic digital images by using the automated soft-ware ImageJ.18Optical attenuation is a measurement of the degree of
staining intensity based on a gray-scale and calibrated to a standard-ized optical attenuation value. With a higher LFB staining intensity, the optical attenuation value is higher. For NF stain, the axonal count was automatically calculated by ImageJ at the symmetric EC at 200⫻ histologic digital images.21
Statistical Analysis
All results were expressed as mean⫾SD. Ratios of injury/control DTI indices (eg, FAI/FAC) and injury/control quantitative evaluations of LFB staining intensity and axonal count (LFBI/LFBC, NFI/NFC) were
calculated for statistical analysis. A pairedttest was used to detect statistical differences in the DTI indices and histologic evaluations between the injury and control ECs. After correction for multiple comparisons (5 times the repeated measurement of DTI indices),P⬍
.01 was regarded as a significant difference in the comparison of in-jury/control DTI indices. Because DTI indices are repeated-measures data, longitudinal changes of DTI indices were analyzed by using a linear mixed model, followed by a least significant difference post hoc pair-wise comparison test. The ratios and absolute values of DTI in-dices were the dependent variables, whereas the independent vari-ables were subjects (a random factor) and time points (a categoric variable). Because the histologic results are cross-sectional data, the changes of absolutes and ratios of injury/control histologic evalua-tions between different time points were evaluated by the 1-way anal-ysis of variance (ANOVA) test, followed by the Tukey test. The Pear-son correlation test was used to evaluate correlations between DTI indices and histologic staining intensity. To evaluate the intraobserver reliability of region-of-interest measurement of DTI indices, we ran-domly selected 4 rats in every time point (total of 20 rats) for remea-surement. To determine the consistency of DTI indices between dif-ferent FOVs, we repeated measurements of DTI indices in 3 randomly selected rats, which were scanned by using the 2 different FOVs (3.2 cm2and 4.0 cm2). Intraobserver reliability and consistency of
differ-ent FOVs were assessed by calculating the 1-way random intraclass correlation coefficients (ICC). All statistical analyses were performed by using the Statistical Package for the Social Sciences for Windows (Version 15, SPSS Inc, Chicago, Ill). APvalue of⬍0.05 was consid-ered to indicate statistical significance.
Results
General Results of DTI Scanning
Of all DTI sections, 98.1% (n⫽1334/1360) were satisfactory in image quality and were included in the region-of-interest analysis. Twenty-six sections belonging to 5 rats were excluded
due to motion artifacts, as determined visually. None of the rats were excluded from image analysis. Intraobserver reliabil-ity analysis of manual region-of-interest drawings showed good agreement (ICC ⫽0.94, 0.96, 0.96, and 0.91 for FA, trace,//, and⬜P⬍.01). An excellent consistency was also obtained in the measurement of DTI indices by different FOVs (ICC⫽0.991,P⬍.001).
Comparison of DTI Indices between Injury and Control ECs
DTI indices of FA, trace,//, and⬜in injury and control ECs
at every time point are shown in the Table 1.
FA.Significantly decreased FA was found in the injury EC compared with the control EC from day 1 to day 90 post-HI injury with a minimum FAI/FACof 0.922 on day 1 (P⬍.01)
and a maximum FAI/FACof 0.970 on day 90 (P⬍.01).
Trace.Apart from significantly increased trace in the in-jury EC compared with the control EC on day 1 (P⬍.01), similar trace values were found in all other time points.
⬜.Significantly elevated⬜was found in the injury EC compared with the control EC at every time point with a max-imum⬜I/⬜Cof 1.092 on day 1 (P⬍.01) and a minimum
⬜I/⬜Cof 1.043 on day 90 (P⬍.01).
//.No significant differences in//were found between
both sides of the EC at any time points.
Longitudinal Changes of DTI Indices
[image:3.594.300.534.66.323.2]Longitudinal changes of DTI indices from day 1 to day 90 are shown in the Table 1.
Table 1: FA, trace,//, and⬜in injury and control ECs from D1 to D90 in a mild-HI neonatal rat model*
Time Points Injury EC Control EC Ratio P FA
D1 0.240⫾0.051a 0.262⫾0.057a 0.922⫾0.091a ⬍.01
D7 0.307⫾0.056b 0.321⫾0.053b 0.962⫾0.132b ⬍.01
D14 0.320⫾0.040b 0.337⫾0.061b 0.967⫾0.138b ⬍.01
D30 0.377⫾0.043c 0.392⫾0.054c 0.968⫾0.147b ⬍.01
D90 0.416⫾0.037d 0.430⫾0.040d 0.970⫾0.086b ⬍.01
Trace (m2/ms)
D1 2.808⫾0.204a 2.683⫾0.351a 1.059⫾0.121a ⬍.01
D7 2.272⫾0.019b 2.273⫾0.016b 1.001⫾0.054b .97
D14 2.162⫾0.154b 2.145⫾0.130b 1.008⫾0.033b .08
D30 2.284⫾0.277b 2.260⫾0.125b 1.012⫾0.053b .13
D90 2.272⫾0.317b 2.247⫾0.303b 1.011⫾0.042b .09
//(m 2/ms)
D1 1.107⫾0.108 1.125⫾0.107 0.987⫾0.083 .10 D7 1.089⫾0.109 1.091⫾0.099 1.000⫾0.060 .86 D14 1.082⫾0.079 1.080⫾0.079 1.003⫾0.039 .73 D30 1.075⫾0.084 1.073⫾0.098 1.008⫾0.113 .93 D90 1.087⫾0.159 1.081⫾0.157 1.009⫾0.069 .56
⬜(m2/ms)
D1 0.835⫾0.083a 0.769⫾0.096a 1.092⫾0.079a ⬍.01
D7 0.645⫾0.060b 0.616⫾0.048b 1.050⫾0.100b ⬍.01
D14 0.621⫾0.061b 0.594⫾0.052b 1.049⫾0.093b ⬍.01
D30 0.617⫾0.043b 0.591⫾0.043b 1.046⫾0.073b ⬍.01
D90 0.593⫾0.076b 0.570⫾0.078b 1.043⫾0.060b ⬍.01
Note:—FA indicates fractional anisotropy; EC, external capsule;//, axial diffusivity;⬜,
radial diffusivity; Ratio, injury/control diffusion tensor imaging indices of EC; D1-D90, day 1-day 90 post HI; HI, hypoxic-ischemic.
There was a progressive increase in FA from day 1 to day 90, a decrease in trace from day 1 to day 14, and a decrease in⬜ from day 1 to day 90 in injury and control ECs.
FA. There were statistically significant differences in FA among the time points in both injury and control ECs (P⬍.01 for both). A subsequent post hoc pair-wise comparison test showed a significant increase in FA among the consecutive time points except between day 7 and day 14 on both sides of the EC (allP⬍.01, except between day 7 and day 14).
Trace.Statistically significant differences were found in trace among the time points on both sides of the EC (P⬍.01 for both). A post hoc pair-wise comparison test showed sig-nificantly decreased trace between day 1 and all the subsequent time points (allP⬍.01), but there was no significant differ-ence among the time points day 7, day 14, day 30, and day 90.
⬜. Statistically significant differences were found in⬜ among the time points on both sides of the EC (P⬍.01 for both). A post hoc pair-wise comparison test showed signifi-cantly decreased⬜between day 1 and all subsequent time points (allP⬍.01), but there were no significant differences among the time points day 7, day 14, day 30, and day 90.
//.There was no significant difference found in//among
all time points on both sides of the EC.
Evaluation of the ratios of the diffusion indices showed statistically significant differences in FAI/FAC, traceI/traceC,
and⬜I/⬜Camong the time points (P⫽.006,P⬍.001, and
P⫽.002, respectively) but not in//I///C(P⫽.328). A
sub-sequent post hoc pair-wise comparison test showed signifi-cantly increased FAI/FAC, decreased traceI/traceC, and
de-creased⬜I/⬜Cbetween day 1 and all the subsequent time
points (allP⬍.05), but there was no significant difference among the time points day 7, day 14, day 30, and day 90.
Histopathological Evaluation
HE Stain.With HE staining, on day 1 post-HI injury, all 3 rats were found to have mild vacuolation and a thinner EC in the injury EC compared with the control EC (Fig 2A, -B). Mild vacuolation change was observed in 1 rat in the injury EC on day 7 post-HI injury, but the other 2 rats had symmetric hemi-brains. No necrosis or infarct regions were observed in the injury EC at any time points.
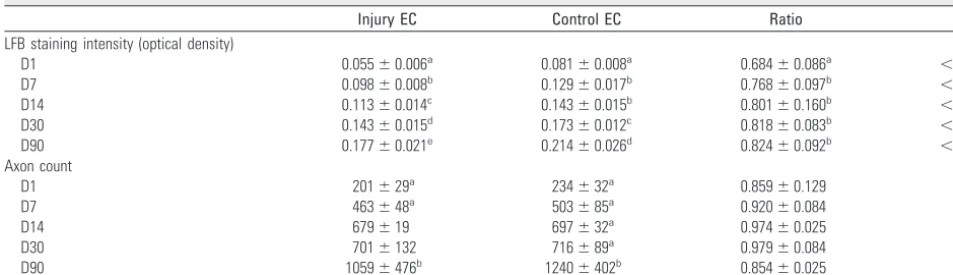
LFB Stain.LFB stain was observed on both sides of the EC, indicating the presence of myelin. Weaker LFB staining inten-sity was observed in the injury EC compared with the control EC in all rats from day 1 to day 90 post-HI injury (Fig 2C, -D). Quantitative analysis showed significantly decreased optical
[image:4.594.133.454.39.410.2]attenuation of LFB staining intensity in the injury EC com-pared with control EC in all time points (Table 2A). The ANOVA test showed significant differences in LFB staining intensity among different time points (P⬍.001 for both ECs). A subsequent post hoc Tukey test showed that the progressive increase in LFB staining intensity was statistically significant between all consecutive time points from day 1 to day 90 in both injury and control ECs, except between day 7 and day 14 in control ECs. For LFBI/LFBC, the ratio progressively
in-creased from day 1 (0.684) to day 90 (0.824). Similar to FAI/
FAC, traceI/traceC, and⬜I/⬜C, a statistically significant
in-crease in LFBI/LFBC was found between day 1 and all
subsequent time points, but there was no significant difference among the time points day 7, day 14, day 30, and day 90.
NF Stain.Distributions of axons were similar on both sides of the EC from day 1 to day 90 (Fig 2E, -F). A progressively increased axonal count was found between consecutive time points from day 1 to day 90 for both injury and control ECs, but this was statistically significant only at the last day 90 time point (Table 2). There were no significant differences in NFI/
NFCamong all time points.
Correlations between DTI Indices and Histologic Evaluations
FA was significantly correlated with both LFB staining inten-sity (r⫽0.681,P⬍.01) and axonal count (r⫽0.673,P⬍.01).
⬜was significantly correlated with LFB staining intensity only (r⫽ ⫺0.528,P⬍.01), and//was significantly correlated with
axonal count only (r⫽0.372,P⫽.043). No significant corre-lations were demonstrated between trace and histologic findings.
Discussion
In this longitudinal study, we demonstrated that changes in DTI indices could reflect the pathologic changes of reduced myelination in the injury EC by a reduction in FA, increase in
⬜, and a similar//; and this was persistent from day 1 to day
90. Moreover, the longitudinal changes in DTI indices with an increase in FA and a decrease in⬜and trace in both the injury and control EC, in parallel with histologic evidence of in-creased myelin, are in keeping with the pattern of normal de-velopment and continual maturation of WM. Finally, the gradual reduction in the differences in FA, trace, and⬜
be-tween injury and control ECs in tandem with LFB staining intensity suggests a partial recovery process in the injury EC, and this was most evident between day 1 and day 7. Indeed, LFB staining intensity was found to correlate significantly with FA and⬜.
Mild HI insult produces predominant injury in the WM in rats with a relative sparing of the GM.1,4,18In a similar rodent
model, Qiao et al1found that there were atrophy and vacuo-lation changes in the WM, whereas the GM appeared normal. In another study,4most examined ECs (8 of 14 brains) showed
spongiform and rarefied tracts. However, most of the cortex regions (11 of 14 brains) appeared normal. The other 3 brains had mild neuronal vacuolar changes in the cortex. Selective injury to the WM in mild hypoxia-ischemia is due to the high susceptibility of oligodendrocytes to HI injury.22,23 It was
found that immature oligodendrocyte progenitors were dying as early as 3 hours after HI insult,23 and at 24 – 48 hours
post-HI injury, there was dysfunction of maturating oligoden-drocytes, which resulted inⱕ50% decrease in myelin basic protein.24Thus, dysmyelination is a major pathologic process in mild HI-induced WM damage, and this is reflected by de-creased LFB staining intensity.4,8,25
Water diffusion in WM is highly sensitive to its microstruc-tural architecture (with components including the myelin sheath), axonal transportation, and direction of neural fi-bers,12,13and DTI indices are sensitive markers of diffusion of
water in tissue. The extent of directionality of water diffusion can be expressed as FA. As in our previous study, we found that a reduction of FA in the injury WM reflected the underdevel-opment of myelin,18and we found in this longitudinal study
that the reduction was persistent until day 90, corresponding to the young adult period. Similarly, reduction in WM FA has been found to persist in teenagers who had a history of mod-erate HIE at birth.26
Trace reflects the mean diffusivities in different directions. Dynamic change in trace reflects the water distribution be-tween extra- and intracellular space. Initial increase in trace post-HI injury as found in our study is commonly explained as water influx from vessels to brain tissue,27namely vasogenic
[image:5.594.52.529.56.193.2]edema. In the subsequent time points, similar trace was found between both sides of the EC. This is likely due to absorption of vasogenic edema and an additional component of restora-tion of myelin.
Table 2: Histologic evaluations of mild HI-induced WM damage in injury and control ECs from D1 to D90 post-HI*
Injury EC Control EC Ratio P
LFB staining intensity (optical density)
D1 0.055⫾0.006a 0.081⫾0.008a 0.684⫾0.086a ⬍.01
D7 0.098⫾0.008b 0.129⫾0.017b 0.768⫾0.097b ⬍.01
D14 0.113⫾0.014c 0.143⫾0.015b 0.801⫾0.160b ⬍.01
D30 0.143⫾0.015d 0.173⫾0.012c 0.818⫾0.083b ⬍.01
D90 0.177⫾0.021e 0.214⫾0.026d 0.824⫾0.092b ⬍.01
Axon count
D1 201⫾29a 234⫾32a 0.859⫾0.129 .074
D7 463⫾48a 503⫾85a 0.920⫾0.084 .254
D14 679⫾19 697⫾32a 0.974⫾0.025 .087
D30 701⫾132 716⫾89a 0.979⫾0.084 .724
D90 1059⫾476b 1240⫾402b 0.854⫾0.025 .335
Note:—WM indicates white matter; LFB, Luxol fast blue.
Studies have shown that directional diffusivities could pro-vide more specific information about the pathologic changes in WM such as myelin damage or axonal degeneration com-pared with FA and trace.12-14Because
⬜represents water dif-fusion perpendicular to the myelin sheaths, myelination causes⬜to reduce, and conversely, loss of myelin causes⬜ to increase. Significantly increased⬜has been demonstrated in a shiverer mouse model with dysmyelination.13
//
repre-sents the water diffusion parallel to the axonal fibers, and this has been found to reduce in a mouse model of retinal isch-emia, reflecting axonal degeneration in the optic nerves.14In
our experiment, reduced FA was driven by increased⬜with no significant change in//, and this correlated with reduction
of myelin and no change in the axons. Although FA correlated significantly with both reduced myelin stain and axonal count,
⬜correlated with myelin stain only, and//correlated with
axonal count only. Thus, our findings support the superior specificity of the directional diffusivities,⬜and//, for WM
pathologic processes.
DTI can be used to evaluate the maturation process of WM in vivo in both human and animal studies by the pattern of increase in FA, decrease in trace and⬜, and no change or slight decrease in//.15,17,28-30Dynamic changes of FA and
trace may be explained by concomitant maturation-induced changes in tissue microstructure, such as reduction in water content,31greater cohesiveness of fiber tracts or fiber
organi-zation,15maturation of axons, and myelination.15These
pro-cesses modify water diffusion during brain development and influence diffusivities. It has been proposed that during mat-uration, increase of longitudinally oriented neurofibrils and the elevation of fast axonal transport15increase water
diffu-sion along axons, which increases//. However, axonal
prun-ing reduces intermprun-inglprun-ing axon branches and shortens the length of axons,32,33which decreases
//. Therefore,
longitudi-nal changes of//may not be significant. Myelination is
an-other important maturation process that influences water dif-fusion in the WM.34It is suggested that increased FA and reduced⬜occur in parallel with and therefore reflect myelin concentration during the maturation process.35
We found similar longitudinal changes of DTI indices in both the injury and control sides of the EC corresponding to and consistent with the longitudinal findings of increase in myelin and axons during the maturation process. This finding demonstrated the ability of the injury EC to continue the mat-uration process and, thus, the potential to recover. It has been demonstrated in the mild-HI model that restoration of myelin occurs after the injury. Liu et al25demonstrated a recovery of
myelin at day 21 post-HI injury in rats after a shorter HI du-ration (60 minutes) but not in rats with a longer HI dudu-ration (150 minutes). This may be due to recovery of the function of the surviving oligodendrocytes25,36or proliferation and
mat-uration of oligodendrocyte precursors.25,37Indeed, the
im-provement in the diffusion indices as evidenced by reduction in the differences in FA, trace, and⬜between injury and control ECs suggests a component of “recovery,” though this was not complete, even at the final young adult time point. Furthermore, our results showed that this recovery process mainly occurred between day 1 and day 7 post-HI injury, which corresponds to the timing of rapid increase in myelina-tion during the normal maturamyelina-tion process34,38and is
consis-tent with a study by Liu et al,25who demonstrated recovery of myelin within the first 3 weeks after mild HI injury. Poten-tially, our results may reflect the therapeutic window for re-covery of myelination that is important in optimizing the tim-ing of treatment in mild hypoxia-ischemia.
Conclusions
In conclusion, our results support the use of DTI indices as biomarkers to monitor the longitudinal changes of mild HI-induced WM damage noninvasively. DTI indices are able to reflect dysmyelination, the process of continual myelination of both injury and control WM, and the partial recovery of myelin in post-HI injury WM.
Acknowledgments
We are grateful for the invaluable technical assistance from all staff at the Laboratory Animal Unit and the Department of Pediatric and Adolescent Medicine of The University of Hong Kong.
References
1. Qiao M, Meng S, Scobie K, et al.Magnetic resonance imaging of differential gray versus white matter injury following a mild or moderate hypoxic-isch-emic insult in neonatal rats.Neurosci Lett2004;368:332–36
2. Qiao M, Latta P, Meng S, et al.Development of acute edema following cerebral hypoxia-ischemia in neonatal compared with juvenile rats using magnetic resonance imaging.Pediatr Res2004;55:101– 06
3. Meng S, Qiao M, Foniok T, et al.White matter damage precedes that in gray matter despite similar magnetic resonance imaging changes following cere-bral hypoxia-ischemia in neonatal rats.Exp Brain Res2005;166:56 – 60 4. Meng S, Qiao M, Scobie K, et al.Evolution of magnetic resonance imaging
changes associated with cerebral hypoxia-ischemia and a relatively selective white matter injury in neonatal rats.Pediatr Res2006;59:554 –59
5. Follett PL, Rosenberg PA, Volpe JJ, et al.NBQX attenuates excitotoxic injury in developing white matter.J Neurosci2000;20:9235– 41
6. Ferriero DM.Neonatal brain injury.N Engl J Med2004;351:1985–95 7. Gressens P, Dingley J, Plaisant F, et al.Analysis of neuronal, glial, endothelial,
axonal and apoptotic markers following moderate therapeutic hypothermia and anesthesia in the developing piglet brain.Brain Pathol2008;18:10 –20 8. Woodward LJ, Anderson PJ, Austin NC, et al.Neonatal MRI to predict
neuro-developmental outcomes in preterm infants.N Engl J Med2006;355:685–94 9. Gluckman PD, Wyatt JS, Azzopardi D, et al.Selective head cooling with mild
systemic hypothermia after neonatal encephalopathy: multicentre random-ised trial.Lancet2005;365:663–70
10. Shankaran S, Laptook AR, Ehrenkranz RA, et al.Whole-body hypothermia for neonates with hypoxic-ischemic encephalopathy.N Engl J Med2005;353: 1574 – 84
11. Nedelcu J, Klein MA, Aguzzi A, et al.Resuscitative hypothermia protects the neonatal rat brain from hypoxic-ischemic injury.Brain Pathol2000;10:61–71 12. Song SK, Yoshino J, Le TQ, et al.Demyelination increases radial diffusivity in
corpus callosum of mouse brain.Neuroimage2005;26:132– 40
13. Song SK, Sun SW, Ramsbottom MJ, et al.Dysmyelination revealed through MRI as increased radial (but unchanged axial) diffusion of water.Neuroimage
2002;17:1429 –36
14. Song SK, Sun SW, Ju WK, et al.Diffusion tensor imaging detects and differen-tiates axon and myelin degeneration in mouse optic nerve after retinal isch-emia.Neuroimage2003;20:1714 –22
15. Larvaron P, Boespflug-Tanguy O, Renou JP, et al.In vivo analysis of the post-natal development of normal mouse brain by DTI.NMR Biomed2007;20: 413–21
16. Vorisek I, Sykova E.Evolution of anisotropic diffusion in the developing rat corpus callosum.J Neurophysiol1997;78:912–19
17. Chahboune H, Ment LR, Stewart WB, et al.Neurodevelopment of C57B/L6 mouse brain assessed by in vivo diffusion tensor imaging.NMR Biomed
2007;20:375– 82
18. Wang S, Wu EX, Tam CN, et al.Characterization of white matter injury in a hypoxic-ischemic neonatal rat model by diffusion tensor MRI. Stroke
2008;39:2348 –53
19. Wang S, Wu EX, Qiu D, et al.Longitudinal diffusion tensor magnetic reso-nance imaging study of radiation-induced white matter damage in a rat model.Cancer Res2009;69:1190 –98
injury with diffusion tensor imaging in a mouse model of traumatic brain injury.Exp Neurol2007;205:116 –31
21. Carty ML, Wixey JA, Colditz PB, et al.Post-insult minocycline treatment at-tenuates hypoxia-ischemia-induced neuroinflammation and white matter injury in the neonatal rat: a comparison of two different dose regimens.Int J Dev Neurosci2008;26:477– 85. Epub 2008 Mar 4
22. Fern R, Moller T.Rapid ischemic cell death in immature oligodendrocytes: a fatal glutamate release feedback loop.J Neurosci2000;20:34 – 42
23. Skoff RP, Bessert DA, Barks JD, et al.Hypoxic-ischemic injury results in acute disruption of myelin gene expression and death of oligodendroglial precur-sors in neonatal mice.Int J Dev Neurosci2001;19:197–208
24. Xu H, Barks JD, Liu YQ, et al.AMPA-induced suppression of oligodendroglial gene expression in neonatal rat brain.Brain Res Dev Brain Res2001;132:175–78 25. Liu Y, Silverstein FS, Skoff R, et al.Hypoxic-ischemic oligodendroglial injury
in neonatal rat brain.Pediatr Res2002;51:25–33
26. Nagy Z, Lindstrom K, Westerberg H, et al.Diffusion tensor imaging on teen-agers, born at term with moderate hypoxic-ischemic encephalopathy.Pediatr Res2005;58:936 – 40
27. Olah L, Wecker S, Hoehn M.Secondary deterioration of apparent diffusion coefficient after 1-hour transient focal cerebral ischemia in rats.J Cereb Blood Flow Metab2000;20:1474 – 82
28. Mukherjee P, Miller JH, Shimony JS, et al.Normal brain maturation during childhood: developmental trends characterized with diffusion-tensor MR im-aging.Radiology2001;221:349 –58
29. Dubois J, Haene-Lambertz G, Perrin M, et al.Asynchrony of the early matura-tion of white matter bundles in healthy infants: quantitative landmarks
re-vealed noninvasively by diffusion tensor imaging.Hum Brain Mapp2008;29: 14 –27
30. Huppi PS, Maier SE, Peled S, et al.Microstructural development of human newborn cerebral white matter assessed in vivo by diffusion tensor magnetic resonance imaging.Pediatr Res1998;44:584 –90
31. Neil JJ, Shiran SI, McKinstry RC, et al.Normal brain in human newborns: apparent diffusion coefficient and diffusion anisotropy measured by using diffusion tensor MR imaging.Radiology1998;209:57– 66
32. Richards LJ, Plachez C, Ren T.Mechanisms regulating the development of the corpus callosum and its agenesis in mouse and human. Clin Genet
2004;66:276 – 89
33. Ren T, Anderson A, Shen WB, et al.Imaging, anatomical, and molecular anal-ysis of callosal formation in the developing human fetal brain.Anat Rec A Discov Mol Cell Evol Biol2006;288:191–204
34. Wiggins RC.Myelination: a critical stage in development.Neurotoxicology
1986;7:103–20
35. Bockhorst KH, Narayana PA, Liu R, et al.Early postnatal development of rat brain: in vivo diffusion tensor imaging.J Neurosci Res2008;86:1520 –28 36. Cheepsunthorn P, Palmer C, Menzies S, et al.Hypoxic/ischemic insult alters
ferritin expression and myelination in neonatal rat brains.J Comp Neurol
2001;431:382–96
37. Mandai K, Matsumoto M, Kitagawa K, et al.Ischemic damage and subsequent proliferation of oligodendrocytes in focal cerebral ischemia.Neuroscience
1997;77:849 – 61