ORIGINAL RESEARCH
PEDIATRICS
Quantitative Folding Pattern Analysis of Early Primary Sulci in
Human Fetuses with Brain Abnormalities
X K. Im,XA. Guimaraes,XY. Kim,X E. Cottrill,X B. Gagoski,XC. Rollins,X C. Ortinau,XE. Yang, andXP.E. Grant
ABSTRACT
BACKGROUND AND PURPOSE: Aberrant gyral folding is a key feature in the diagnosis of many cerebral malformations. However, in fetal life, it is particularly challenging to confidently diagnose aberrant folding because of the rapid spatiotemporal changes of gyral develop-ment. Currently, there is no resource to measure how an individual fetal brain compares with normal spatiotemporal variations. In this study, we assessed the potential for automatic analysis of early sulcal patterns to detect individual fetal brains with cerebral abnormalities.
MATERIALS AND METHODS: Triplane MR images were aligned to create a motion-corrected volume for each individual fetal brain, and cortical plate surfaces were extracted. Sulcal basins were automatically identified on the cortical plate surface and compared with a combined set generated from 9 normal fetal brain templates. Sulcal pattern similarities to the templates were quantified by using multivariate geometric features and intersulcal relationships for 14 normal fetal brains and 5 fetal brains that were proved to be abnormal on postnatal MR imaging. Results were compared with the gyrification index.
RESULTS:Significantly reduced sulcal pattern similarities to normal templates were found in all abnormal individual fetuses compared with normal fetuses (mean similarity [normal, abnormal], left: 0.818, 0.752;P⬍.001; right: 0.810, 0.753;P⬍.01). Altered location and depth patterns of sulcal basins were the primary distinguishing features. The gyrification index was not significantly different between the normal and abnormal groups.
CONCLUSIONS: Automated analysis of interrelated patterning of early primary sulci could outperform the traditional gyrification index and has the potential to quantitatively detect individual fetuses with emerging abnormal sulcal patterns.
ABBREVIATIONS:GI⫽gyrification index; GW⫽gestational weeks
I
n the human cerebral cortex, primary sulci are important ana-tomic landmarks for predicting several primary, secondary, and higher order cortical areas.1 Their global patterning(arrange-ment, number, and size of primary sulcal folds) has been hypoth-esized to relate to the optimal organization of functional areas and
their white matter connections.2-4Interestingly, the primary
sul-cal pattern is prenatally determined and appears to show little individual variability in healthy patients in early fetal life before 30 gestational weeks (GW).5-8However, in many brain
malforma-tions and psychiatric/neurologic disorders, defects in the neuro-developmental process result in a disrupted primary sulcal pat-tern, which may appear in early fetal life.9-13Therefore, sulcal
folding analysis in the fetal brain may provide a useful tool for identifying the early signs of developmental brain disorders.
Previous studies using MR imaging have quantified cortical folding development in human fetal and preterm brains. The temporal changes of the gyrification index (GI) were observed during fetal life,14,15and cortical surface curvatures at the global
level have been measured to quantify the overall degree of cortical folding from 22–39 GW.15-20The curvature and depth changes of
cortical folding at the vertex level have also been observed for the
Received October 21, 2016; accepted after revision March 13, 2017.
From the Fetal Neonatal Neuroimaging and Developmental Science Center (K.I., A.G., Y.K., E.C., B.G., P.E.G.), Division of Newborn Medicine (K.I., P.E.G.) and the De-partments of Neurology (C.R.) and Radiology (B.G., E.Y., P.E.G.), Boston Children’s Hospital, Boston, Massachusetts; Harvard Medical School (K.I., B.G., C.R., C.O., E.Y., P.E.G.), Boston, Massachusetts; Department of Pediatrics Newborn Medicine (C.O.), Brigham and Women’s Hospital, Boston, Massachusetts; and Faculdade de Me-dicina da USP (A.G.), Sao Paulo, Brazil.
This work was supported by National Institutes of Health grants 1R21HD083956-01A1, 1R01EB017337-01, and 1U01 HD087211-01; a Boston Children’s Hospital Faculty Career Development Award; a Scholar Award from the Pediatric Heart Network supported by the National Heart, Lung, and Blood Institute of the National Insti-tutes of Health (U10HL068270); a Neurological Sciences Academic Developmental Award from the National Institutes of Neurological Disorders and Stroke; and the Mend a Heart Foundation.
Please address correspondence to Kiho Im, PhD, Boston Children’s Hospital, 1 Autumn St, Boston, MA 02115; e-mail: [email protected]
Indicates open access to non-subscribers at www.ajnr.org
Indicates article with supplemental on-line photos.
entire cortical area.18,21,22However, no quantitative analysis of
the interrelated arrangement and global patterning of primary sulci in the human fetal brain exists. We previously developed a comprehensive and quantitative analytical method for comparing primary sulcal patterns by using not only the regional features of sulci folds themselves, but also the intersulcal geometric and to-pologic relationships.23This method provided an effective means
for detecting genetically influenced abnormal sulcal patterns in pediatric patients with cerebral malformations10,12and
develop-mental dyslexia.13
We hypothesized that the global pattern of primary sulci may be disrupted early in fetal brain development in fetuses destined to have abnormal sulcation at birth. Therefore, by using normal fetal brain templates to define normal sulcal patterning, we set out to measure early differences of sulcal pattern in fetuses with brain abnormalities confirmed by MR imaging at birth. The biologic motivation behind this hypothesis is that cortical arealization and connectivity begin early in fetal brain development and, if defec-tive, might give rise to atypical sulcal topology. We also compared our method with an established metric, the GI, which has been used to quantify the development of human cortical folding.18,24
MATERIALS AND METHODS
PatientsFor this pilot feasibility study, fetuses with confirmed brain ab-normalities were identified retrospectively from the existing clin-ical MR imaging data at Boston Children’s Hospital. We searched for fetal MRIs performed between 18 and 30 GW with reports raising a concern for cerebral malformations and included only those fetuses who had the cerebral malformation confirmed by a follow-up postnatal brain MR imaging. The clinical imaging di-agnoses were confirmed by 2 pediatric neuroradiologists (E.Y. and P.E.G.). Among approximately 40 fetuses identified by using this process, most were excluded because of serious head motion in the fetal MRIs, which could not be sufficiently processed to yield accurate fetal brain surfaces. Thus, 5 fetuses with confirmed brain malformations were included in the final analysis (male/ female, 3/2; age [mean⫾SD], 20 –30 GW [25.3⫾3.8]; maternal age [mean⫾SD], 29 –37 years [33.8⫾2.7]) (1 Chiari II malfor-mation [subject ID: M1] with sacral myelomeningocele, 3 poly-microgyria [M2, M3, and M5], and 1 atypical gyral folding [M4]). Fetuses M1 and M2 were initially thought to have a normal sulcal folding, but neonatal MR imaging identified atypical sulcal fold-ing and polymicrogyria, respectively. One patient with polymi-crogyria was longitudinally scanned with fetal MR imaging at 22 and 29 GW [M5a and M5b].
Healthy control patients were recruited from mothers referred to the Advanced Fetal Care Center at Boston Children’s Hospital because of a family history of congenital heart disease, but for whom fetal echocardiogram was normal. Inclusion criteria were the following: maternal age of 18 – 45 years and gestational age of 18 –30 GW. We excluded multiple gestation pregnancies and fe-tuses with dysmorphic features on sonography, brain malforma-tions, other brain lesions, known chromosomal abnormalities, other identified organ anomalies, and known congenital infec-tions. We also excluded patients as healthy controls if the fetal MR imaging identified these conditions as being present. Using these
criteria, 21 healthy control fetuses were recruited and scanned, but 7 fetuses were excluded because of serious head motion. Four-teen healthy fetuses were finally included in this study (male/ female, 4/10; age [mean⫾SD], 21–30 GW [25.5⫾2.3]; maternal age [mean⫾SD], 25–39 years [29.9⫾4.0]).
This study was approved by the institutional review board committee of Boston Children’s Hospital.
MR Imaging Acquisition and Processing and Reconstruction of Cortical Plate Surface
Fetal brain MR imaging was performed by using a T2-weighted HASTE MR imaging sequence on a 3T scanner (Skyra; Siemens, Erlangen, Germany) equipped with the body matrix array (18 coil elements used) in combination with the spine array (12–18 coil elements) for a total of 30 –36 coil elements. The following se-quence was used for each patient: TR,⬃1.5 seconds; TE, 120 ms; FOV, 256 mm; in-plane resolution, 1 mm; section thickness, 2– 4 mm. The HASTE acquisition was performed at least 3 times in different orthogonal orientations with respect to the fetal brain for reliable image processing.
Fetal head motion was corrected, and 0.75 mm isotropic vol-ume images were reconstructed from the multiple scans.25The
volume images were manually aligned along the anterior/poste-rior commissure points by using AFNI (http://afni.nimh.nih. gov/afni),26and the cortical plate was semi-automatically
seg-mented by using FreeView (http://surfer.nmr.mgh.harvard.edu). The cortical plate was painted on each section by using intensity value ranges and corrected via examination on orthogonal views. To reconstruct smooth surface models, the inner volume of the cortical plate was binarized and smoothed by using a 3⫻3⫻3 mean filter. The 3D inner cortical plate surface was then recon-structed by using the isosurface function with the isovalue of 0.5 in Matlab software (MathWorks, Natick, Massachusetts) (Fig 1). Although small folds similar in size to a voxel might be eliminated, our smoothing was effective to avoid noisy features and voxelized representation of the surface.
We used 9 previously published fetal brain templates from 23–31 GW that were constructed from 80 normal fetuses (http:// brain-development.org/brain-atlases)27as a reference for our
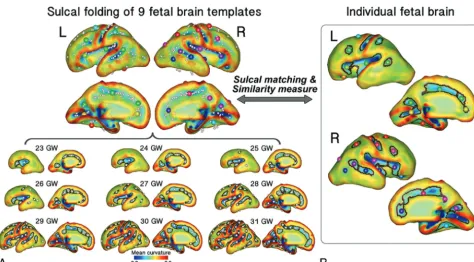
sul-cal pattern analysis. The cortisul-cal plate surfaces of the fetal tem-plates were reconstructed by using the same process (Fig 2).
Identification and Geometric Measurements of Sulcal Catchment Basins
Early sulcal catchment basins were used for sulcal pattern analysis because they are relatively invariant between patients and hypoth-esized to relate to functional areas and activations.28,29Sulcal
ba-sins are concave substructures decomposed from one large part of cortical folds.29Cortical mean curvature and depth on a surface
model were measured by using FreeSurfer (http://surfer.nmr. mgh.harvard.edu), and sulcal basins were automatically identi-fied by using a watershed algorithm based on the curvature map12,13,23,29(Fig 1). A minimum bounding box for a given
normalized surface area (s) and mean sulcal depth (d) for sul-cal geometry.
Sulcal Pattern Matching and Similarity to the Templates and Automatic Sulcal Labeling
Sulcal pattern was represented with a feature set of sulcal basins including not only the local sulcal features, but also the inter-sulcal geometric relationships in the left and right hemi-spheres.23To quantify the deviation from the normal pattern
of sulcal folding for each fetus, individual brains were matched and compared with the combined set of all 9 fetal brain tem-plates (Fig 2). Sulcal setsP(individual brain) andQ(9 template
brains) containing mand nsulcal basins, respectively, were represented as follows:
P⫽{p1,p2, . . .,pm} andQ⫽{q1,q2, . . .,qn}
For the comparison, we used a spectral matching technique to determine the optimal match having the minimum difference of the features between 2 sulcal sets.13,23,30We constructed a matrixMto
store the affinities of all candidate matches and chose a subset matrix
A, determining the optimal match and maximum affinity betweenP
andQby calculating the principal eigenvector ofM. For a more de-tailed explanation of the methodologic procedures, see Im et al.23
Through this process, each sulcal basin of an individual brain was FIG 1.Processing overview for the identification of sulcal basins on the cortical plate surface. A raw volume image of an individual fetal brain (26 GW) is reconstructed to a motion-corrected, high-resolution volume. The reconstructed volume image is aligned along the anterior/posterior commissure (AC–PC) points. The inner volume of the cortical plate is semi-automatically segmented, its 3D surface is reconstructed, and its mean curvature is represented by acolor map. Sulcal catchment basins are identified on the cortical plate surface based on the curvature and identified with different colors.
[image:3.594.56.529.49.198.2] [image:3.594.57.532.261.523.2]optimally matched with 1 of the sulcal basins of the 9 template brains (Fig 2), and the similarity to the templates was calculated, which ranged from 0 –123,30(On-line Fig 1). For the similarity measure, we
used variable weighting of features to assess their relative importance on sulcal pattern similarity. First, all 3 features were optimally weighted in the sulcal pattern matching and similarity measure (wx,y,z⫽3;ws⫽8;wd⫽0.8). Then, we evaluated the impact of each individual feature on similarity measures by setting all weights of the other features to 0.
Because the 3D position of the sulcal basin was required for optimal sulcal matching, we aligned the orientation of the cortical surface along the anterior/posterior commissure line. Although this is not a perfect spatial normalization, it was considered sufficient for measuring the scale-free value of relative position. Moreover, our method is insensitive to the spatial normalization because the intrinsic sulcal pattern charac-terized by intersulcal relationships is used for computing a large part of the sulcal pattern similarity and minimally affected by the spatial alignment.23
3D Global Gyrification Index
A GI is defined as the ratio between the whole areas of the cortical surface and its convex hull in 3D.14,31First, the inner volume of
the cortical plate surface was isolated and constructed, and the 3D morphologic closing operation was performed by using a sphere of 15 mm diameter as the structural element to close the sulcal folding.31The outer hull surface wrapping the cortical plate
sur-face was created from the binary closed volume by using the iso-surface function (On-line Fig 2). We then calculated the 3D global GI of the left and right whole cerebral hemispheres.
Statistical Group and Individual Analysis
Using the sulcal pattern matching and comparison method, the sulcal pattern similarities to the set of 9 normal templates were
computed with the 4 different feature sets for each fetus in the left and right hemispheres (whole feature, 3D posi-tion, sulcal area, and sulcal depth). The similarities to the templates were statisti-cally compared between normal fetuses and fetuses with brain abnormalities with an independent 2-samplettest. The Pear-son correlation and Mann-WhitneyUtest were used in normal fetuses to test the ef-fects of gestational age and sex, respec-tively, on the sulcal pattern similarity. The group difference in GI was statistically as-sessed by using linear regression analysis. The dependent variable was the GI, and the independent variable was the group. Age and sex were used as covariates to con-trol for their effects. Because 1 patient with an abormal brain had repeated longi-tudinal measurements (M5a and M5b), the group comparisons in the sulcal pat-tern similarity and GI were performed 2 times, including either M5a or M5b, to comply with the assumption of statisti-cal tests.
We examined if the similarity of each individual abnormal brain to the templates deviated from the normal range by mea-suring its relative position in the distribution of all 14 normal individual fetuses. We counted the number of normal patients who had a lower similarity and expressed that value as a ratio to the total number of normal individual patients (histogram rank-ing). If an individual abnormal fetus showed a ratio of 0, meaning none of the normal individual fetuses had a lower similarity to the normal template, that patient was tagged as presenting an “abnor-mal” pattern of sulcal folding. If the ratio value was smaller than 0.1, the sulcal folding was deemed “suspicious” for an abnormal sulcal pattern.
RESULTS
Sulcal Pattern Similarity to the Normal Templates
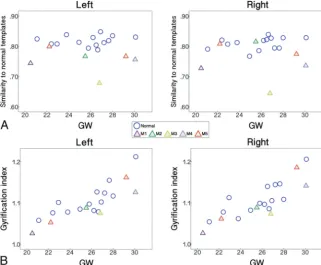
The fetuses with abnormal brains showed significantly lower sulcal pattern similarities to the templates compared with the normal fetuses in both hemispheres measured with the whole set of fea-tures (Fig 3A). In the statistical tests for each individual feature, significantly low similarities were observed in the abnormal group for the relative position, area, and depth of cortical folding in the left hemisphere. In the right hemisphere, sulcal position and depth pattern similarities were significantly lower in the abnormal fetal brains. All statistical results for the group comparisons with M5a or M5b are presented inTable 1. We confirmed that sulcal pattern similarities were not significantly associated with GW (left: correlation coefficientr⫽0.075,P⫽.80; right:r⫽0.334, P⫽.24) and not different between male and female patients (left: P⫽.37; right:P⫽.84).
Regression analysis showed that global GI of the fetal brains increased with GW (statistical results including M5a [a] and M5b [b], left and right:P⬍.001), but there was no significant
[image:4.594.56.378.48.313.2]sex effect ([a] left:P⫽.38, right:P⫽.67; [b] left:P⫽.45, right: P⫽ .78). The GI was not statistically different between the normal and abnormal fetal groups in either hemisphere ([a] left:P⫽.18, right:P⫽.22; [b] left:P⫽.33, right:P⫽.48) (Fig 3B).
Individual analysis based on the ratio quantifying the devia-tion from the normal showed that all abnormal fetal brains had an abnormal sulcal pattern with the ratio 0 in 1 or more feature sets in at least 1 hemisphere (left: M1, M2, M3, M4, and M5b mined as abnormal; right: M1, M3, M4, M5a, and M5b deter-mined as abnormal). The similarity measures for all individual hemispheres and the ratio values for each abnormal fetal brain hemisphere are shown, along with 5 normal fetal brains for exam-ple, in On-line Fig 3. Our quantitative assessment for each abnor-mal fetal brain was compared with the qualitative assessment of fetal MR imaging. An abnormal sulcal pattern was detected for individual fetal brains that were judged to have abnormal gyrifi-cation by qualitative assessment (M3, M4, and M5). Moreover, high deviation from the normal was also quantitatively observed for fetal brains that were judged to have normal gyrification by qualitative fetal MR imaging assessment (M1 and M2). Demo-graphic data and qualitative and quantitative assessments of fetal/ neonatal MRIs are shown inTable 2. Specifically, abnormal brain M2, initially misjudged to have normal sulcal folding in qual-itative fetal MR imaging but postnatally confirmed to have abnormal folding (false-negative), was assessed to be abnormal in left hemispheric sulcal pattern in our quantitative analysis (true-positive).
DISCUSSION
We used a novel automatic sulcal pattern comparison method to quantify sulcal pattern similarities of individual fetal brains
against normal fetal brain templates by using multivariate geometric sulcal fea-tures and detected not only group differ-ences between abnormal and normal fe-tal brains, but also individual differences in sulcal patterns in all abnormal fetuses. Although the entire set of features (3D position, area, and depth of sulcal basin) showed the highest statistical signifi-cance for the group comparison, the 3D position and depth of the sulcal basin were the major driving factors. The common cortical folding measurement GI was also used for the group analysis, but showed no significant difference be-tween the groups. In our pilot data, our approach, based on sulcal location and depth patterns, outperformed the more traditional GI, previously thought to be the most sensitive measure for evalua-tion of the developing human brain.24
This suggests that in brain abnormali-ties associated with abnormal sulcal folding, the relative sulcal locations and depths are altered more than the overall amount of cortical folding dur-ing early fetal brain development.
Atypical patterns of sulcal locations and folding depths in fetal brains may indicate defective regulation of spatiotemporal dy-namics of early cortical surface expansion and folding. Cortical areas do not develop independently, but in strong relation to other functional areas with optimized white matter connections, and accordingly show specific locations and size.3,32It has been
proposed that cortical functional arealization and organization may be related to the specific spatial pattern of early primary sulci in fetal brains.1,4Similarly, the gyrogenesis theory suggests that
areas of rapid growth form gyri at the center of a functional zone and underlie the formation of the first major folds during the early stage of cortical growth.33,34The areal expansion and folding of
the human cerebral cortex are precisely regulated processes in time during fetal life.5-8The normal stereotypical pattern of
gy-rogenesis likely results in regular intersulcal relationships and folding depth at each fetal stage. In fact, the positional identity of cortical functional regions is defined by the combinatorial expres-sion pattern of various genes, with their areal expanexpres-sion also un-der tight genetic control with distinct spatiotemporal character-istics.32,35-37Therefore, atypical patterns of sulcal locations and
folding depths in fetal brains before 30 GW likely are associated with defects in genetic control of cortical arealization and expansion.
[image:5.594.54.377.63.179.2] [image:5.594.53.374.236.319.2]In 2 cases (M1 and M2), our individual quantitative analysis detected an abnormal sulcal pattern not detected on qualitative fetal MR imaging assessment yet confirmed postnatally. Thus, our quantitative analysis shows the feasibility and potential for detect-ing emergdetect-ing subtle abnormalities in sulcal patterns that are dif-ficult to perceive visually. Future studies will be aimed at obtain-ing true sensitivity and specificity data in a larger cohort that
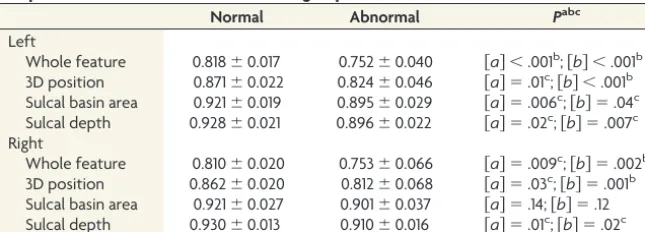
Table 1: Statistical results for the comparisons of the sulcal pattern similarity with the templates between normal and abnormal groups with different feature sets
Normal Abnormal Pabc
Left
Whole feature 0.818⫾0.017 0.752⫾0.040 关a兴 ⬍.001b;关b兴 ⬍.001b 3D position 0.871⫾0.022 0.824⫾0.046 关a兴 ⫽.01c;关b兴 ⬍.001b Sulcal basin area 0.921⫾0.019 0.895⫾0.029 关a兴 ⫽.006c;关b兴 ⫽.04c Sulcal depth 0.928⫾0.021 0.896⫾0.022 关a兴 ⫽.02c;关b兴 ⫽.007c Right
Whole feature 0.810⫾0.020 0.753⫾0.066 关a兴 ⫽.009c;关b兴 ⫽.002b 3D position 0.862⫾0.020 0.812⫾0.068 关a兴 ⫽.03c;关b兴 ⫽.001b Sulcal basin area 0.921⫾0.027 0.901⫾0.037 关a兴 ⫽.14;关b兴 ⫽.12 Sulcal depth 0.930⫾0.013 0.910⫾0.016 关a兴 ⫽.01c;关b兴 ⫽.02c a关
a兴, statistical analysis with M5a;关b兴, statistical analysis with M5b.
b P⬍.005.
c P⬍.05.
Table 2: Demographic data, qualitative assessments of fetal and neonatal MRIs, and quantitative assessments of fetal MRIs for fetuses with brain abnormalities
ID Age (GW) Sex
Qualitative Fetal MRI Assessment
Qualitative Neonatal MRI Assessment
Quantitative Fetal MRI Assessment
M1 20 F N A (Chiari II) A (L, R)
M2 25 F N A (Polymicrogyria) A (L)
M3 26 M A A (Polymicrogyria) A (L, R)
M4 30 M A A (Atypical gyral folding) A (L, R)
M5a 22 M A A (Polymicrogyria) S (L), A (R)
M5b 29 A A (L, R)
includes postnatal imaging of normal fetuses because this pilot study could not show the full distribution of typical sulcal patterns because of the small number of normal fetuses. In addition, we will explore the ability of such quantitative anal-yses to decrease variation in clinical interpretations. Finally, comparison of quantitative assessments with genetic studies and follow-up clinical/behavioral outcomes is needed to fur-ther evaluate the potential applicability of our method in un-derstanding the ability to detect and distinguish different ge-netic disorders and predict outcomes.
Limitations of MR imaging– based sulcal analysis on fetal brains include the low success rate (5/40 [12.5%]) for triplane reconstruction in clinically acquired fetal datasets and the current need for manual segmentations. However, because healthy con-trol fetuses were scanned with a research MR imaging protocol that acquired more sets of triplane images, the success rate for our healthy fetal MR imaging processing was higher (14/21 [66.7%]). Future accelerations in image acquisition and improvements in postprocessing techniques are likely to increase success rates mov-ing forward. Another limitation is the delay in the detection of cerebral sulci in MR imaging studies compared with histopathol-ogy. At least 1-week discrepancy has been reported between ana-tomic and qualitative MR imaging studies because of limitations in the resolution and contrast of in utero fetal MR imaging.38,39If
cerebral sulci are identified by using automatic and quantitative image processing techniques, sulcal detection is more delayed. For example, 1 small sulcus, the olfactory sulcus, was reported to appear before 20 weeks,7,8but here it was not identified at such an
early stage not only on the templates, but also on individual fetal brains. Delayed sulcal detection on fetal MR imaging has also been shown in previous quantitative studies.21,40Ongoing innovations
in this area as mentioned above are also likely to improve early sulcal detection.
CONCLUSIONS
Our quantitative sulcal pattern analysis with a focus on relative spatial location and depth of sulci has the potential to detect not only group differences in cortical folding, but also individual dif-ferences in fetuses destined to develop cortical malformations. Our method outperformed GI, which was dominated by gesta-tional age. In addition, our method outperformed blinded expert qualitative fetal MR imaging assessments.
Disclosures: Kiho Im—RELATED:Grant: National Institutes of Health, Boston Chil-dren’s Hospital. Caitlin Rollins—RELATED:Grant: National Institutes of Health, Com-ments: Scholar Award from the Pediatric Heart Network and K12 training award*; UNRELATED:Stock/Stock Options: Biogen. Cynthia Ortinau—RELATED: Mend A Heart Foundation;UNRELATED:Payment for Lectures (including service on Speak-ers Bureaus): Academy of Neonatal Nursing. Edward Yang—RELATED:Grant: National Institutes of Health,Comments: principal investigator for National In-stitutes of Health grant 1R21HD083956 – 01A1*;UNRELATED:Consultancy: Corti-cometrics LLC;Grants/Grants Pending: National Institutes of Health*. *Money paid to the institution.
REFERENCES
1. Fischl B, Rajendran N, Busa E, et al.Cortical folding patterns and pre-dicting cytoarchitecture. Cereb Cortex 2008;18:1973– 80 CrossRef Medline
2. Van Essen DC.A tension-based theory of morphogenesis and
com-pact wiring in the central nervous system.Nature1997;385:313–18
CrossRef Medline
3. Klyachko VA, Stevens CF.Connectivity optimization and the posi-tioning of cortical areas.Proc Natl Acad Sci U S A2003;100:7937– 41
CrossRef Medline
4. Sun T, Hevner RF.Growth and folding of the mammalian cerebral cortex: from molecules to malformations.Nat Rev Neurosci2014;15: 217–32CrossRef Medline
5. Kostovic I, Vasung L.Insights from in vitro fetal magnetic reso-nance imaging of cerebral development.Semin Perinatol2009;33: 220 –33CrossRef Medline
6. Garel C, Chantrel E, Brisse H, et al.Fetal cerebral cortex: normal gestational landmarks identified using prenatal MR imaging.AJNR Am J Neuroradiol2001;22:184 – 89CrossRef Medline
7. Chi JG, Dooling EC, Gilles FH.Gyral development of the human brain.Ann Neurol1977;1:86 –93CrossRef Medline
8. White T, Su S, Schmidt M, et al.The development of gyrification in childhood and adolescence.Brain Cogn2010;72:36 – 45CrossRef Medline
9. Nakamura M, Nestor PG, McCarley RW, et al.Altered orbito-frontal sulcogyral pattern in schizophrenia.Brain2007;130:693– 707CrossRef Medline
10. Bae BI, Tietjen I, Atabay KD, et al.Evolutionarily dynamic alterna-tive splicing of GPR56 regulates regional cerebral cortical pattern-ing.Science2014;343:764 – 68CrossRef Medline
11. Barkovich AJ, Guerrini R, Kuzniecky RI, et al.A developmental and genetic classification for malformations of cortical development: update 2012.Brain2012;135:1348 – 69CrossRef Medline
12. Im K, Pienaar R, Paldino MJ, et al.Quantification and discrimina-tion of abnormal sulcal patterns in polymicrogyria.Cereb Cortex
2013;23:3007–15CrossRef Medline
13. Im K, Raschle NM, Smith SA, et al.Atypical sulcal pattern in chil-dren with developmental dyslexia and at-risk kindergarteners.
Cereb Cortex2016;26:1138 – 48CrossRef Medline
14. Zilles K, Armstrong E, Schleicher A, et al.The human pattern of gyrification in the cerebral cortex.Anat Embryol (Berl)1988;179: 173–79CrossRef Medline
15. Lefevre J, Germanaud D, Dubois J, et al.Are developmental trajec-tories of cortical folding comparable between cross-sectional data-sets of fetuses and preterm newborns? Cereb Cortex 2016;26: 3023–35CrossRef Medline
16. Wright R, Kyriakopoulou V, Ledig C, et al.Automatic quantification of normal cortical folding patterns from fetal brain MRI. Neuroim-age2014;91:21–32CrossRef Medline
17. Hu HH, Chen HY, Hung CI, et al.Shape and curvedness analysis of brain morphology using human fetal magnetic resonance images in utero.Brain Struct Funct2013;218:1451– 62CrossRef Medline
18. Clouchoux C, du Plessis AJ, Bouyssi-Kobar M, et al.Delayed cortical development in fetuses with complex congenital heart disease.
Cereb Cortex2013;23:2932– 43CrossRef Medline
19. Clouchoux C, Kudelski D, Gholipour A, et al.Quantitative in vivo MRI measurement of cortical development in the fetus.Brain Struct Funct2012;217:127–39CrossRef Medline
20. Dubois J, Benders M, Cachia A, et al.Mapping the early cortical folding process in the preterm newborn brain.Cereb Cortex2008; 18:1444 –54CrossRef Medline
21. Habas PA, Scott JA, Roosta A, et al.Early folding patterns and asym-metries of the normal human brain detected from in utero MRI.
Cereb Cortex2012;22:13–25CrossRef Medline
22. Scott JA, Habas PA, Rajagopalan V, et al.Volumetric and surface-based 3D MRI analyses of fetal isolated mild ventriculomegaly: brain morphometry in ventriculomegaly.Brain Struct Funct2013; 218:645–55CrossRef Medline
23. Im K, Pienaar R, Lee JM, et al.Quantitative comparison and analysis of sulcal patterns using sulcal graph matching: a twin study. Neuro-image2011;57:1077– 86CrossRef Medline
folding measures for evaluation of developing human brain. Neu-roimage2016;125:780 –90CrossRef Medline
25. Kuklisova-Murgasova M, Quaghebeur G, Rutherford MA, et al. Re-construction of fetal brain MRI with intensity matching and com-plete outlier removal.Med Image Anal2012;16:1550 – 64CrossRef Medline
26. Cox RW.AFNI: what a long strange trip it’s been.Neuroimage2012; 62:743– 47CrossRef Medline
27. Serag A, Aljabar P, Ball G, et al.Construction of a consistent high-definition spatio-temporal atlas of the developing brain using adaptive kernel regression.Neuroimage2012;59:2255– 65CrossRef Medline
28. Derrfuss J, Brass M, von Cramon DY, et al.Neural activations at the junction of the inferior frontal sulcus and the inferior precentral sulcus: interindividual variability, reliability, and association with sulcal morphology.Hum Brain Mapp2009;30:299 –311CrossRef Medline
29. Im K, Jo HJ, Mangin JF, et al.Spatial distribution of deep sulcal landmarks and hemispherical asymmetry on the cortical surface.
Cereb Cortex2010;20:602–11CrossRef Medline
30. Leordeanu M, Hebert M.A spectral technique for correspondence problems using pairwise constraints.In:ICCV ’05 Proceedings of the Tenth IEEE International Conference on Computer Vision, Washing-ton, DC. October 17–21, 2005CrossRef
31. Schaer M, Cuadra MB, Tamarit L, et al.A surface-based approach to quantify local cortical gyrification.IEEE Trans Med Imaging2008; 27:161–70CrossRef Medline
32. O’Leary DD, Chou SJ, Sahara S.Area patterning of the mammalian cortex.Neuron2007;56:252– 69CrossRef Medline
33. Hasnain MK, Fox PT, Woldorff MG.Structure–function spatial co-variance in the human visual cortex.Cereb Cortex2001;11:702–16
CrossRef Medline
34. Welker W.Why does cerebral cortex fissure and fold? A review of determinants of gyri and sulci.In: Jones EG, Pertes A, eds.Cerebral Cortexvol. 8B. New York: Plenum; 1990:3–136CrossRef
35. Chen CH, Gutierrez ED, Thompson W, et al.Hierarchical genetic organization of human cortical surface area. Science 2012;335: 1634 –36CrossRef Medline
36. Stahl R, Walcher T, De Juan Romero C, et al.Trnp1 regulates expan-sion and folding of the mammalian cerebral cortex by control of radial glial fate.Cell2013;153:535– 49CrossRef Medline
37. Miller JA, Ding SL, Sunkin SM, et al.Transcriptional landscape of the prenatal human brain. Nature 2014;508:199 –206 CrossRef Medline
38. Nishikuni K, Ribas GC.Study of fetal and postnatal morphological development of the brain sulci.J Neurosurg Pediatr2013;11:1–11
CrossRef Medline
39. Garel C, Chantrel E, Elmaleh M, et al.Fetal MRI: normal gestational landmarks for cerebral biometry, gyration and myelination.Childs Nerv Syst2003;19:422–25CrossRef Medline