Effects of Household Storage and Plumbing Systems on the
Levels of Trace Elements in Desalinated Drinking Water
in Kuwait
Humood F. Al-Mudhaf1, Nabeel M. Al-Khulaifi2, Mohammad N. Al-Hayan1, Abdel-Sattar I. Abu-Shady1*
1Chemical Engineering Technology Department, College of Technological Studies, Public Authority for Applied Education and Training, Adailiyah, Kuwait; 2Environmental Health Department, College of Health Sciences, Public Authority for Applied Educa-tion and Training, Adailiyah, Kuwait.
Email: *[email protected]
Received June 9th, 2012; revised August 1st, 2012; accepted September 2nd, 2012
ABSTRACT
Household desalinated drinking water samples collected from outdoor points and from indoor consumption points at 99 locations representing more than 95% of the residential areas in Kuwait were analyzed for 25 trace elements and water quality parameters. Only Al, Cr, Co, Cu, Fe, Pb, Ni, and Zn were found to be over-represented at the consumption point compared with the outdoor point, with wide variations among the sampling locations and elements. The highest in- creases were observed for Fe (135%) and Zn (123%), followed by Pb (69%), Co (58%), Cu (42%), Cr (31%), and Al (30%), and the lowest increase was observed for Ni (19%). In most cases, the increases in Cu, Fe, and Zn were in- versely proportional to the conductivity and directly proportional to the Cl− concentration. In the outdoor samples, only
Fe exceeded the US-EPA guideline (in 3% of the outdoor samples taken), whereas Fe, Pb, and Ni exceeded the US-EPA and WHO guidelines in 8.5%, 0.3%, and 1% of the indoor consumption point samples, respectively. Thus, leaching from household utilities may cause health concerns for consumers of drinking water in Kuwait. The increases in Fe were the highest in the summer (240%), and in this regard, Fe exhibited the greatest difference between summer and winter (the increase was 139% higher in the summer). The results of the present study may be useful for water pro- duction authorities and consumers in Kuwait and suggest the use of alternative new pipes with more resistant internal coatings and connecting techniques.
Keywords: Desalinated Water; Kuwait; Corrosion; Leaching; Trace Elements
1. Introduction
Of all of the countries of the world, particularly the Arab Gulf countries, Kuwait has the most limited fresh-water resources and the lowest levels of renewable fresh water [1]. The desalination of sea water provides the only source of drinking water in Kuwait, and the amount of desalination required increases as the demand for potable water increases. To produce distilled water, multi-stage flash (MSF) distillation is used by desalination plants in Kuwait. The distilled water produced is saturated with calcium carbonate and remineralized by blending it with 5% - 10% brackish water to make it potable. Finally, the remineralized water is chlorinated and pumped to a dis- tribution network. The remineralization process prevents or limits corrosion within the distribution network’s pipes and alters the trace elements (TEs) present and the
mineral composition in the desalinated drinking water relative to that produced from surface and ground fresh- water sources. In addition, the saturation of the remine- ralized water with calcium carbonate provides a stable passivation layer that further prevents the corrosion of transfer pipes [2-4]. However, the World Health Organi- zation (WHO) has reported that cardiovascular disease can develop when remineralized desalinated drinking water is consumed [5].
A literature survey indicated that numerous studies have been performed worldwide to evaluate the TEs in drinking water produced from ground or surface water [4, 6-9] or through the thermal desalination of seawater [10- 14]. Desalinated household drinking water (HW) in Ku-wait has been extensively studied to evaluate the levels of TEs [12,15], minerals [16], disinfection byproducts (DBPs) known as haloacetic acids [17,18] and halo- methanes [19,21-23], and organic contaminants [24].
Moreover, Al-Fraij et al. reviewed the various sources of
contamination of drinking water in Kuwait during the transportation to consumers [25] and concluded that the monitoring process is inadequate. Al-Mudahf and Abu- Shady [15] reported an increase in the levels of some TEs in HW at the consumption point compared with the results of a previous study by Al-Fraij et al. [12] on sam-
ples collected at the reservoirs at desalination plants be- fore pumping to the distribution network. There is a worldwide interest in studying the effects of the types and compositions of distribution systems and household utilities on the contamination of drinking water by TEs through the leaching and migration of corrosion products [26-34]. The major sources of indoor TE pollution in- cludebrass faucets and fixtures and household plumbing lines and their solders [28,30,32]. Viraraghavan et al. [32]
reviewed the impact of the migration of some metals from household plumbing systems on the quality of drinking water. Alam and Sadiq [33] reported an increase in the levels of copper, iron, and zinc in desalinated drinking water in Dhahran, Saudi Arabia, mediated by the transportation to the consumers. Recently, Veschetti
et al. [26] studied the migration of trace metals from dis-
tribution networks into Italian drinking water and related the high levels of Ni outliers to tap materials, Fe to cor- rosion processes, and Pb to lead pipes that still existed in old buildings.
In Kuwait, consumers drink water that has passed from the outdoor point of the public distribution system to their taps via their private household plumbing, piping, and storage utilities. The TE content and quality of this water may have changed during its residence and trans- port through these utilities. The main objectives of this study were 1) to determine the contamination of HW at indoor consumption points by TEs as a result of leaching from the metallic materials of household utilities; 2) to explore the impacts of various household storage and plumbing systems on the levels of TEs and the quality of HW at consumption points; 3) to correlate the variation in TE content to water composition; and 4) to study sea- sonal variations in TE levels.
2. Materials and Methods
2.1. Reagents and Reference Materials
For all of the required preparations, we used ultra-pure Type I ICP/MS-grade inorganic-free water obtained from a Millipore Ultrapure Water Purification System equipped with a Milli-Q element, a Q-Guard II pack, a Quantum VX cartridge, a 0.22-µm Millipak filter, and a <0.1-µm optimizer filter at the point of use (Millipore, Bedford, MA, USA). Certified high-purity chemical reagents, in- dividual and calibration standard mixes, and quality con-
trol and reference materials were obtained from Agilent Technologies (Santa Clara, CA, USA), AccuStandard (New Haven, CT, USA), SPEX CertiPrep, Inc. (Metuchen, NJ, USA), Alfa Aesar (Ward Hill, MA, USA), and Merck (Nottingham, UK).
2.2. Desalination Plants and Sampling
According to official information from the Ministry of Electricity and Water in Kuwait (MEW), five dual-pur- pose power and desalination plants located along the Kuwaiti coast used MSF distillation to produce a total of ~310 million imperial gallons per day (MIGD) of distil- late (yielding 331.5 MIGD of potable water) during the course of this study. To prevent marine fouling inside the distillers, the seawater supply at each plant (a total of ~18.7 mm3·d−1 for the five plants) was chlorinated (~6.0
mg·L-1 total residual chlorine); this seawater was used to
cool and feed the MSF distillation units. The pH of the distilled water that was produced was adjusted to 8.3 by carbonation, and the water was blended with 5% - 10% brackish water followed by chlorination to a total resid- ual chlorine value of ~1.2 mg·L−1. The chlorinated water
was pumped first to storage facilities (towers and con- crete underground reservoirs) and then to the distribution system network and ultimately to consumer storage fa- cilities. The Az-Zoor plant (with a mean capacity of 115.2 MIGD) completely supplies the Umm Al-Haiman (DUH) location. Together with the Shuaiba plant (36 MIGD), the Az-Zoor plant supplies all of the locations in the Ahmadi Governorate (GAH) and the Mubarak Al-Kabeer Gover-norate (GMK) with various capacity ratios. The Doha West (110.4 MIGD) and Doha East (50.4 MIGD) plants primarily supply the Shuwaikh Education (CSE) location and all of the residential areas of the Jahra Governorate (GJA). The Shuwaikh (19.5 MIGD) plant primarily sup-plies the Shuwaikh Sakani (CSW) location. All of the other individual locations in the residential areas of the Capital (GCA), Farwaniya (GFA), and Hawalli (GHA) governorates are supplied by all of the plants at varying ratios depending on temporal demand. The main distri-bution piping network was constructed from asbestos/ cement or from galvanized iron pipes, and most of this piping was recently replaced with ductile iron pipes.
Figure 1 shows both the locations of the desalination
plants and the distribution of the sampling points within the locations in the various governorates. Three repli- cates of each sample were collected and preserved ac- cording to US-EPA Methods 300.1 and 200.8 [35]. The samples were delivered to the laboratory in boxes that were cooled with dry ice and were refrigerated at 4˚C until analysis. All of the water samples were analyzed
Figure 1. Locations of the desalination plants and the distributions of sampling points within the different neighborhoods of the governorates of Kuwait.
2.3. Determination of Analyte Concentrations (K), antimony (Sb), selenium (Se), sodium (Na), stron-
tium (Sr), titanium (Ti), vanadium (V), and zinc (Zn), were measured according to US-EPA Method 200.8 [35] with an Agilent ICP/MS 7500ce (Agilent, Palo Alto, CA, USA) that was equipped with an octopole reaction sys- tem, a micromist nebulizer, a bonnet and shield, and an integrated autosampler. Details regarding the analytical procedures, quality control (QC), quality assurance (QA), and detection limits (DLs) have been reported elsewhere [15,16].
The temperature, pH, electrical conductivity (EC), total dissolved solids (TDS), and residual chlorine (Cl) were measured on-site at the time of collection. Inorganic anion concentrations were determined according to US- EPA 300.1 method [35] using a Waters gradient HPLC system (Waters, Milford, MA, USA) equipped with a Waters 432 conductivity detector, an Altech 1000 HP Autosuppressor, and a Waters 2690 Separations Module. The levels of 25 TEs, i.e., aluminum (Al), arsenic (As),
boron (B), barium (Ba), beryllium (Be), cadmium (Cd), calcium (Ca), chromium (Cr), cobalt (Co), copper(Cu), iron (Fe), lead (Pb), magnesium (Mg), manganese (Mn), mercury(Hg), molybdinum (Mo), nickel (Ni), potassium
3. Results and Discussion
buildings after flushing for five minutes. Ninety-nine locations were sampled in 69 neighborhoods in the six governorates of Kuwait. Together, these locations cover more than 95% of the residential areas in Kuwait. At each sampling collection, two samples were collected from two points in each selected building on each occa- sion: one from the water connection at the point of the distribution network just outside the building (outdoor- HW; designated as O-HW) and the second from an inside faucet (tap) after the drinking water had passed through the storage and plumbing facilities as well as the house- hold piping system of the building (indoor-HW; desig- nated as I-HW). At residential or public properties, the storage tanks are mainly roof-top tanks (6 - 12 m3) that
are constructed of galvanized iron. These iron tanks are generally being replaced with fiberglass, although ground reservoirs constructed from the same materials (20 - 100 m3) are also used for large buildings. All of the available
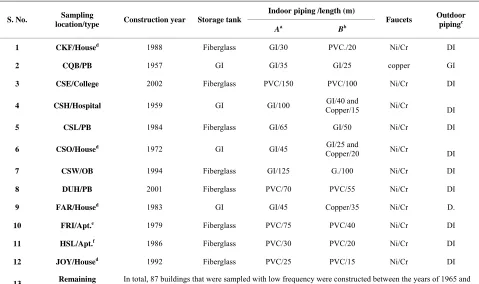
information on the household storage, piping, and other utilities in the studied premises is given in Table 1, as
are the types of outdoor distribution network piping in each area.
Three hundred and twenty-one I-HWsamples and the
same number of O-HW samples were collected simulta- neously between December 2003 and May 2005 with different sampling frequencies (ranging from 1 to 20 sampling events) from 16, 38, 19, 11, 9, and 6 different sampling locations within the residential areas of the GAH, GCA, GFA, GHA, GJA, and GMK governorates, respectively (Figure 1). To achieve the objectives of the
study, 12 subareas of higher population density within the 99 sampling locations in the 69 neighborhoods of the governorates were identified and investigated using a higher sampling frequency. Accordingly, 6 - 20 samples were periodically collected from each of the Kifan (CKF), Qibla (CQB), Shuwaikh education (CSE), Shuwaikh Health (CSH), Sulaibekhat (CSL), Sorra (CSO), CSW, DUH, Ardiya (FAR), Riggae (FRI), Salmiya (HSL), and Oyoon (JOY) locations, as indicated in Figure 1. At each
of the remaining 87 locations, 1 - 3 samples were col- lected.
[image:4.595.59.538.399.683.2]The corrosion of construction products that contain metallic materials and contact drinking water (CP-DW) during its production and transportation via the general distribution network and through private household utili- ties represents a major health concern because of the
Table 1. Types of household storage, piping, and other utilities at various sampling points.
Indoor piping /length (m)
S. No. Sampling
location/type Construction year Storage tank
Aa Bb
Faucets Outdoor
pipingc
1 CKF/Housed 1988 Fiberglass GI/30 PVC./20 Ni/Cr DI
2 CQB/PB 1957 GI GI/35 GI/25 copper GI
3 CSE/College 2002 Fiberglass PVC/150 PVC/100 Ni/Cr DI
4 CSH/Hospital 1959 GI GI/100 Copper/15 GI/40 and Ni/Cr DI
5 CSL/PB 1984 Fiberglass GI/65 GI/50 Ni/Cr DI
6 CSO/Housed 1972 GI GI/45 GI/25 and
Copper/20 Ni/Cr DI
7 CSW/OB 1994 Fiberglass GI/125 G./100 Ni/Cr DI
8 DUH/PB 2001 Fiberglass PVC/70 PVC/55 Ni/Cr DI
9 FAR/Housed 1983 GI GI/45 Copper/35 Ni/Cr D.
10 FRI/Apt.e 1979 Fiberglass PVC/75 PVC/40 Ni/Cr DI
11 HSL/Apt.f 1986 Fiberglass PVC/30 PVC/20 Ni/Cr DI
12 JOY/Housed 1992 Fiberglass PVC/25 PVC/15 Ni/Cr DI
13 Remaining
locationsg
In total, 87 buildings that were sampled with low frequency were constructed between the years of 1965 and 2001 and contain various types of household storage tanks, piping, faucets, and outdoor piping.
aLength from the outdoor point to the roof storage tank; bLength from roof storage tank to the indoor sampling faucet; cPiping type outside the building; dSingle
family home (6 - 15 residents); eApartment on the fifth floor of a nine-story residential building complex (64 apartments); fApartment on the second floor of a three-story residential building (6 apartments); gIncludes 10 PBs, 65 houses, and 12 apartments; hPB: public building; OB: office building; GI: galvanized iron;
I: ductile iron. D
leaching of the contaminants Cd, Cr, Pb, and Ni, which pose serious health threats to the consumers of drinking water [36]. Additionally, as a consequence of corrosion, other elements, including Al, Cu, Fe, and Zn, may leach into the drinking water. To protect the health of consum- ers of drinking water, the European Directive 98/83 on drinking water quality [37] established rules for moni- toring these elements in CP-DW in the European Union. The interactions between the metallic materials of the CP-DW and water may be influenced by several factors that include the surface properties, metallic compositions, and lengths of the pipes as well as their surface/volume ratios, hydraulic conditions, network configurations, wa- ter residence times, and the physico-chemical character- istics of the bulk water [38,39]. The most corrosive wa- ters are characterized by low pH levels, high carbon di- oxide content, and low mineral content [40]. Each of
these factors may affect the leaching of metals differently. In addition, the levels of TEs in the O-HW samples may be influenced, as previously desrcibed [16,17,22,24], by the operational processes that are used at the desalination plants, the nature of the intake seawater, the positions of the plants on the coast of Kuwait, and the nature and type of the distribution networks. In addition to these factors, the type of household storage and piping and plumbing facilities greatly affects the levels of some TEs at the consumer point (I-HW) [26,32,33]. It is also important to note that the sole source of HW in Kuwait is distilled water blended with brackish water. Thus, the differences found in the levels of TEs between O-HW and I-HW samples in various locations and governorates were also likely related to subtle variations in the characteristics of the brackish waters and the blend ratios used during the production process.
The 25 TEs analyzed in the 321 samples of O-HW collected in this study were Al, As, B, Ba, Be, Ca, Cd, Cr, Co, Cu, Fe, Pb, Mg, Mn, Hg, Mo, Ni, K Sb, Se, Na, Sr, Ti, V, and Zn. In addition, we measured the water quality parameters (WQPs) pH, conductivity, TDS, and residual Cl as well as the concentrations of the anions Cl− and
. The levels of these TEs and the WQPs of the I- HW as well as their variations among sampling locations and governorates have been presented and discussed pre- viously [15,16]. Table 2 depicts the mean values of the
TEs in the O-HW samples from various sampling loca- tions and governorates of Kuwait, and the values of the I-HW samples are included for comparison.
2 4
SO
The mean concentrations of Al, Cr, Co, Cu, Fe, Pb, Ni, and Zn (designated as the 8-TE group) were higher in the I-HW samples than in the O-HW samples collected at all sampling locations. However, Be was not detected in any of the samples, and there were no significant differences among the mean values of the remaining 16 TEs in the
I-HW samples and those in the O-HW samples at various sampling locations (Table 2). The increases in the mean
values of the concentrations of the elements in the 8-TE group in the I-HW samples compared with those in the O-HW samples were attributed mainly to leaching from household utilities and showed significant variations among sampling locations and among elements. Figure 2
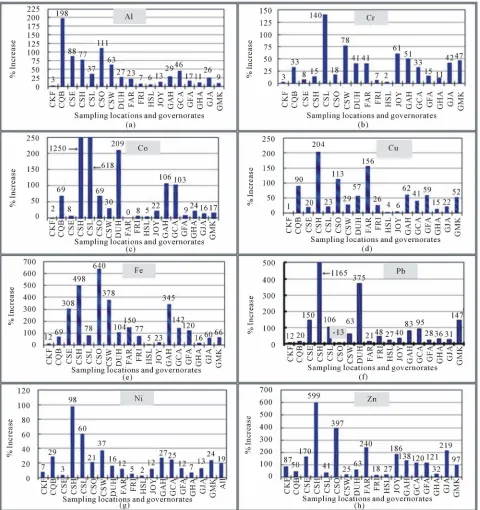
illustrates the variations in the increases of the elements in the 8-TE group in all of the I-HW samples (321) col- lected from the 99 sampling locations in the six gover- norates in relation to those in the O-HW samples. The highest increases were found for Fe (135%) and Zn (123%), followed by Pb (69%), Co (58%), Cu (42%), Cr (31%), and Al (30%), and Ni exhibited the lowest in- crease (19%). There were wide variations in the increases for each of these TEs among the sampling locations and among the governorates, as shown in Figure 3.
Figure 3(a) shows that the highest and lowest in-
creases of Al occurred in the I-HW samples of CQB (198%) and CKF (3%) among the locations and in the GCA (46%) and GMK (9%) samples, respectively, among the governorates. Table 2 shows that the highest
mean Al values in the I-HW and O-HW samples (34.4 µg·L−1 and 33.5 µg·L−1, with ranges of 21.2 - 53.0 and
18.0 - 53.3 µg·L−1, respectively) occurred at the CKF lo-
cation, which had the lowest increase of Al (3%). By contrast, the CQB location, which had the highest in- crease of Al (198%), had significantly lower levels in the I-HW and O-HW samples (mean values of 13.4 and 4.5 µg·L−1 and ranges of 1.0 - 54.4 and 0.3 - 10.0 µg·L−1,
[image:5.595.310.534.554.695.2]respectively). Thus, the migration of Al from household utilities and piping was the only source of Al increase in the I-HW samples collected at the CQB location, which was the location with the highest Al increase. In contrast, no Al leaching from household utilities and piping oc- curred at the CKF location, despite its high mean I-HW value (34.4 µg·L−1), which was slightly higher than the
Figure 2. Variations in the increases of various trace ele- ments in indoor household drinking water (I-HW) for all of
he samples collected from the 99 sampling locations. t
Table 2. Mean values of the concentrations of trace elements in the indoor (I-HW) and outdoor (O-HW) household drinking water at various locations in different governoratesa.
(a)
Sampling locations Element-I/Ob
CKF CQB CSE CSH CSL CSO
Al-I 34.4 ± 10.7 13.4 ± 18.2 3.17 ± 2.39 9.94 ± 3.59 5.55 ± 4.89 22.4 ± 21.6
Al-O 33.5 ± 11.7 4.50 ± 3.21 1.69 ± 0.99 5.60 ± 2.39 4.07 ± 3.17 10.6 ± 2.00
As-I 0.43 ± 0.07 0.12 ± 0.06 0.32 ± 0.09 0.36 ± 0.10 0.45 ± 0.06 0.13 ± 0.05
As-O 0.43 ± 0.07 0.24 ± 0.15 0.32 ± 0.13 0.22 ± 0.05 0.47 ± 0.08 0.11 ± 0.03
B-I 127 ± 15.2 164 ± 39.5 120 ± 11.2 211 ± 55.7 128 ± 16.7 67.8 ± 11.6
B-O 128 ± 15.3 153 ± 30.4 120 ± 12.4 209 ± 184 130 ± 13.5 65.6 ± 12.1
Ba-I 3.39 ± 0.36 6.99 ± 9.75 2.29 ± 0.30 2.49 ± 0.33 2.57 ± 0.40 4.41 ± 0.48
Ba-O 3.37 ± 0.36 2.54 ± 0.29 2.27 ± 0.03 2.43 ± 0.35 2.55 ± 0.37 4.14 ± 0.48
Ba-I 3.39 ± 0.36 6.99 ± 9.75 2.29 ± 0.30 2.49 ± 0.33 2.57 ± 0.40 4.41 ± 0.48
Ba-O 3.37 ± 0.36 2.54 ± 0.29 2.27 ± 0.03 2.43 ± 0.35 2.55 ± 0.37 4.14 ± 0.48
Ca-I 53.0 ± 4.31 43.1 ± 4.43 51.0 ± 3.01 47.4 ± 5.70 51.7 ± 4.32 32.4 ± 3.71
Ca-O 52.4 ± 4.93 43.2 ± 6.42 51.2 ± 3.33 47.5 ± 6.10 52.2 ± 3.94 29.9 ± 7.42
Cd-I 0.11 ± 0.00 0.07 ± 0.00 0.10 ± 0.00 0.16 ± 0.00 0.07 ± 0.00 0.13 ± 0.04
Cd-O 0.11 ± 0.00 0.08 ± 0.00 0.10 ± 0.01 1.58 ± 0.00 0.07 ± 0.00 0.11 ± 0.00
Co-I 0.59 ± 0.66 0.51 ± 0.70 0.39 ± 0.50 8.14 ± 14.0 4.06 ± 8.52 0.16 ± 0.16
Co-O 0.58 ± 0.63 0.30 ± 0.60 0.36 ± 0.47 0.60 ± 0.92 0.57 ± 0.79 0.10 ± 0.08
Cr-I 0.63 ± 0.31 0.23 ± 0.08 0.60 ± 0.16 0.61 ± 0.18 1.33 ± 1.72 0.21 ± 0.03
Cr-O 0.61 ± 0.30 0.17 ± 0.09 0.55 ± 0.18 0.53 ± 0.25 0.55 ± 0.30 0.17 ± 0.04
Cu-I 31.8 ± 6.72 54.4 ± 57.0 50.0 ± 23.4 52.7 ± 16.4 59.6 ± 7.5 60.8 ± 29.2
Cu-O 31.4 ± 6.79 26.7 ± 16.2 41.8 ± 12.4 17.3 ± 6.78 48.5 ± 13.0 28.5 ± 7.86
Fe-I 9.54 ± 2.51 576 ± 534 92.4 ± 104 98.0 ± 22.8 15.5 ± 8.6 167 ± 128
Fe-O 8.48 ± 2.67 340 ± 336 22.6 ± 23.1 16.4 ± 4.47 8.73 ± 1.65 22.6 ± 20.6
Pb-I 0.55 ± 0.50 0.61 ± 1.08 0.65 ± 0.34 6.26 ± 10.7 0.40 ± 0.45 0.17 ± 0.14
Pb-O 0.49 ± 0.43 0.51 ± 0.94 0.26 ± 0.27 0.50 ± 0.63 0.19 ± 0.29 0.19 ± 0.15
Mg-I 13.5 ± 1.82 12.9 ± 0.92 12.7 ± 1.41 13.2 ± 1.52 13.5 ± 1.82 6.08 ± 1.44
Mg-O 13.5 ± 1.94 12.7 ± 1.34 12.7 ± 1.43 13.2 ± 1.61 13.7 ± 1.64 6.08 ± 1.68
Mn-I 0.99 ± 0.47 9.46 ± 2.96 0.82 ± 0.87 2.15 ± 2.98 1.13 ± 0.41 1.85 ± 1.06
Mn-O 0.92 ± 0.38 10.2 ± 6.13 1.14 ± 2.05 2.71 ± 2.04 3.66 ± 6.48 1.39 ± 1.25
Hg-I 0.76 ± 0.00 0.42 ± 0.00 0.80 ± 0.00 0.53 ± 0.00 0.90 ± 0.00 0.12 ± 0.00
Hg-O 0.62 ± 0.00 0.32 ± 0.00 0.80 ± 0.00 0.79 ± 0.00 0.40 ± 0.00 0.08 ± 0.04
Mo-I 8.97 ± 2.92 5.38 ± 2.14 8.31 ± 2.50 8.21 ± 2.53 9.37 ± 3.51 3.32 ± 1.17
Mo-O 8.73 ± 3.23 5.57 ± 2.76 8.65 ± 2.01 14.7 ± 15.1 15.5 ± 16.6 3.22 ± 1.02
Ni-I 5.98 ± 1.43 10.2 ± 3.04 7.63 ± 1.52 9.94 ± 10.6 9.29 ± 7.89 3.65 ± 1.34
Ni-O 5.57 ± 1.13 7.90 ± 1.55 7.38 ± 1.73 5.03 ± 0.82 5.80 ± 0.61 3.02 ± 1.17
K-I 1.54 ± 0.19 1.53 ± 0.13 1.50 ± 0.16 1.68 ± 0.20 1.55 ± 0.19 1.74 ± 0.25
K-O 1.55 ± 0.20 1.52 ± 0.13 1.49 ± 0.17 1.66 ± 0.26 1.57 ± 0.19 1.73 ± 0.26
Sb-I 1.04 ± 0.00 0.25 ± 0.15 0.98 ± 0.53 2.15 ± 0.00 1.71 ± 0.37 1.70 ± 0.00
Sb-O 0.39 ± 0.50 0.50 ± 0.40 0.57 ± 0.45 2.79 ± 0.00 2.66 ± 0.08 0.93 ± 0.39
Se-I 0.95 ± 0.15 0.53 ± 0.21 0.79 ± 0.14 0.81 ± 0.05 0.81 ± 0.27 0.22 ± 0.04
Se-O 1.03 ± 0.29 0.55 ± 0.29 0.79 ± 0.14 0.81 ± 0.15 0.93 ± 0.17 0.22 ± 0.05
Na-I 52.9 ± 7.10 52.3 ± 3.86 52.0 ± 4.42 56.7 ± 6.71 53.0 ± 6.70 36.7 ± 4.82
Na-O 52.8 ± 7.90 51.0 ± 5.04 51.8 ± 4.54 57.4 ± 10.1 53.7 ± 6.54 36.6 ± 5.53
Sr-I 1.27 ± 0.15 1.19 ± 0.08 1.18 ± 0.12 1.27 ± 0.13 1.28 ± 0.17 0.60 ± 0.16
Sr-O 1.27 ± 0.14 1.16 ± 0.14 1.18 ± 0.12 1.23 ± 0.11 1.30 ± 0.16 0.59 ± 0.17
Ti-I 0.20 ± 0.05 0.16 ± 0.04 0.13 ± 0.04 0.23 ± 0.07 0.25 ± 0.14 0.23 ± 0.06
Ti-O 0.19 ± 0.05 0.14 ± 0.03 0.14 ± 0.04 0.15 ± 0.05 0.20 ± 0.09 0.24 ± 0.12
V-I 2.87 ± 0.23 0.93 ± 0.43 2.15 ± 0.42 2.58 ± 0.11 2.71 ± 0.24 0.78 ± 0.08
V-O 2.86 ± 0.21 1.63 ± 0.93 2.15 ± 0.73 1.53 ± 0.22 2.81 ± 0.36 0.82 ± 0.01
Zn-I 16.3 ± 4.13 231 ± 140 74.6 ± 91.3 194 ± 105 52.3 ± 14.3 78.8 ± 42.8
Zn-O 8.70 ± 0.55 154 ± 105 27.7 ± 12.3 27.7 ± 4.63 37.1 ± 14.0 15.9 ± 4.88
(b)
Sampling locations, contd. Element-I/Ob
CSW DUH FAR FRI HSL JOY
Al-I 6.19 ± 3.50 10.4 ± 4.83 6.25 ± 10.8 8.98 ± 4.03 5.55 ± 2.38 6.76 ± 3.86
Al-O 3.79 ± 3.12 8.16 ± 3.04 5.09 ± 8.56 8.35 ± 4.15 5.23 ± 2.30 5.96 ± 3.50
As-I 0.26 ± 0.10 0.05 ± 0.01 0.47 ± 0.08 0.41 ± 0.08 0.28 ± 0.07 0.38 ± 0.09
As-O 0.30 ± 0.13 0.07 ± 0.03 0.52 ± 0.10 0.41 ± 0.08 0.28 ± 0.07 0.39 ± 0.09
B-I 110 ± 13.0 45.8 ± 7.7 127 ± 11.6 123 ± 13.4 94.6 ± 16.4 132 ± 11.3
B-O 111 ± 20.5 45.9 ± 7.4 129 ± 16.0 124 ± 15.3 94.1 ± 15.9 130 ± 9.6
Ba-I 2.37 ± 0.31 1.50 ± 0.22 2.29 ± 0.35 2.20 ± 0.33 5.10 ± 0.65 2.89 ± 0.22
Ba-O 2.27 ± 0.30 1.55 ± 0.29 2.19 ± 0.30 2.21 ± 0.42 5.10 ± 0.65 2.88 ± 0.19
Ba-I 2.37 ± 0.31 1.50 ± 0.22 2.29 ± 0.35 2.20 ± 0.33 5.10 ± 0.65 2.89 ± 0.22
Ba-O 2.27 ± 0.30 1.55 ± 0.29 2.19 ± 0.30 2.21 ± 0.42 5.10 ± 0.65 2.88 ± 0.19
Ca-I 45.5 ± 3.9 26.1 ± 5.1 52.0 ± 3.9 51.8 ± 3.3 38.3 ± 5.0 49.4 ± 4.0
Ca-O 44.2 ± 10.2 26.4 ± 5.0 51.9 ± 4.5 53.0 ± 4.3 37.9 ± 5.2 49.4 ± 3.6
Cd-I 0.24 ± 0.00 0.08 ± 0.00 0.18 ± 0.00 0.10 ± 0.02 0.07 ± 0.00 0.07 ± 0.00
Cd-O 0.16 ± 0.00 0.07 ± 0.00 0.15 ± 0.00 0.11 ± 0.04 0.07 ± 0.00 0.10 ± 0.00
Co-I 0.41 ± 0.65 0.64 ± 0.74 0.28 ± 0.27 0.34 ± 0.52 0.48 ± 0.51 0.39 ± 0.64
Co-O 0.31 ± 0.49 0.21 ± 0.20 0.29 ± 0.29 0.40 ± 0.49 0.45 ± 0.39 0.32 ± 0.62
Cr-I 0.73 ± 0.25 0.13 ± 0.13 0.86 ± 0.52 0.66 ± 0.16 0.60 ± 10 1.47 ± 0.69
Cr-O 0.41 ± 0.24 0.09 ± 0.03 0.61 ± 0.18 0.61 ± 0.15 0.58 ± 0.10 0.92 ± 0.26
Cu-I 71.4 ± 15.3 51.9 ± 13.8 129 ± 45.6 58.5 ± 9.2 46.1 ± 10.4 35.4 ± 7.2
Cu-O 55.2 ± 16.3 33.0 ± 9.27 50.4 ± 9.66 46.3 ± 8.1 44.3 ± 10.1 33.3 ± 6.64
Fe-I 50.9 ± 9.74 16.7 ± 13.7 18.4 ± 6.10 26.7 ± 9.6 31.1 ± 38.4 20.4 ± 11.2
Fe-O 10.7 ± 6.81 8.18 ± 2.09 7.36 ± 2.74 15.1 ± 6.4 29.7 ± 37.3 16.6 ± 7.19
Pb-I 1.03 ± 1.43 0.85 ± 1.30 0.32 ± 0.45 0.36 ± 0.38 0.23 ± 0.28 0.33 ± 0.45
Pb-O 0.63 ± 0.70 0.18 ± 0.14 0.27 ± 0.42 0.24 ± 0.32 0.18 ± 0.24 0.24 ± 0.37
Mg-I 13.2 ± 0.9 3.68 ± 0.85 13.5 ± 1.9 12.1 ± 3.4 9.44 ± 1.81 13.8 ± 1.3
Mg-O 12.4 ± 3.5 3.73 ± 0.84 13.7 ± 2.0 12.2 ± 3.5 9.43 ± 1.76 13.6 ± 1.24
Mn-I 1.70 ± 0.8 0.90 ± 0.22 1.08 ± 0.33 1.53 ± 0.47 1.72 ± 0.99 1.51 ± 0.88
Mn-O 1.31 ± 0.87 1.61 ± 1.45 0.90 ± 0.39 1.33 ± 0.52 1.71 ± 1.03 1.12 ± 0.43
Hg-I 0.12 ± 0.00 ND 0.15 ± 0.00 0.11 ± 0.00 0.18 ± 0.00 ND
Hg-O 0.10 ± 0.02 ND 0.13 ± 0.00 0.11 ± 0.00 0.13 ± 0.02 ND
Mo-I 6.32 ± 1.98 2.42 ± 0.73 7.86 ± 4.53 8.49 ± 1.98 6.19 ± 1.65 11.04 ± 1.98
Mo-O 6.01 ± 3.12 2.46 ± 0.76 8.24 ± 4.74 8.75 ± 2.02 6.18 ± 1.72 10.89 ± 1.54
Ni-I 12.8 ± 4.09 2.09 ± 0.55 7.44 ± 3.24 6.29 ± 1.62 7.04 ± 1.25 7.45 ± 1.51
Ni-O 9.34 ± 3.55 1.80 ± 0.47 6.63 ± 2.78 5.97 ± 1.55 6.88 ± 1.27 6.54 ± 1.46
K-I 1.77 ± 0.16 1.43 ± 0.35 1.57 ± 0.21 1.49 ± 0.15 1.50 ± 0.23 1.72 ± 0.16
K-O 1.48 ± 0.21 1.46 ± 0.35 1.57 ± 0.23 1.50 ± 0.18 1.50 ± 0.22 1.71 ± 0.13
Sb-I 0.55 ± 0.45 0.61 ± 0.34 0.80 ± 0.98 0.47 ± 0.31 0.34 ± 0.08 1.11 ± 0.81
Sb-O 0.61 ± 0.19 0.70 ± 0.46 0.97 ± 1.29 0.34 ± 0.37 0.45 ± 0.20 1.49 ± 1.08
Se-I 0.72 ± 0.59 0.16 ± 0.11 0.91 ± 0.12 0.82 ± 0.18 0.55 ± 0.19 0.89 ± 0.16
Se-O 0.59 ± 0.38 0.16 ± 0.10 0.94 ± 0.16 0.91 ± 0.33 0.65 ± 0.36 0.90 ± 0.14
Na-I 54.4 ± 3.8 28.6 ± 5.5 53.4 ± 5.6 53.5 ± 5.6 44.4 ± 5.3 56.6 ± 3.9
Na-O 50.9 ± 10.3 28.9 ± 5.2 53.1 ± 7.8 54.1 ± 6.2 43.9 ± 5.6 56.6 ± 3.7
Sr-I 1.16 ± 0.09 0.37 ± 0.10 1.28 ± 0.11 1.20 ± 0.13 0.90 ± 0.17 1.29 ± 0.14
Sr-O 1.18 ± 0.13 0.38 ± 0.10 1.30 ± 0.15 1.22 ± 0.16 0.90 ± 0.17 1.28 ± 0.13
Ti-I 0.14 ± 0.04 0.14 ± 0.08 0.23 ± 0.06 0.16 ± 0.06 0.21 ± 0.09 0.19 ± 0.09
Ti-O 0.13 ± 0.04 0.51 ± 0.55 0.18 ± 0.04 0.19 ± 0.07 0.21 ± 0.10 0.16 ± 0.05
V-I 1.62 ± 0.53 0.50 ± 0.13 2.95 ± 0.21 2.64 ± 0.33 1.85 ± 0.35 2.44 ± 0.48
V-O 1.84 ± 0.82 0.58 ± 0.15 3.10 ± 0.24 2.70 ± 0.33 1.86 ± 0.35 2.54 ± 0.43
Zn-I 27.6 ± 7.13 31.7 ± 8.87 67.5 ± 31.2 40.7 ± 11.6 28.7 ± 6.4 31.5 ± 17.0
Zn-O 22.0 ± 6.16 19.4 ± 4.80 19.8 ± 5.25 34.6 ± 6.90 22.6 ± 6.87 11.0 ± 2.90
(c)
Governoratesd
Element-I/Ob
GAH GCA GFA GHA GJA GMK Alle
Al-I 14.6 ± 7.63 12.4 ± 13.1 8.35 ± 5.96 8.09 ± 4.95 7.74 ± 4.64 20.5 ± 6.61 11.7 ± 10.1
Al-O 11.1 ± 5.47 8.51 ± 9.04 7.14 ± 4.95 7.28 ± 4.68 6.13 ± 3.71 18.8 ± 6.97 8.71 ± 7.37
As-I 0.08 ± 0.07 0.28 ± 0.13 0.43 ± 0.08 0.28 ± 0.07 0.35 ± 0.10 0.06 ± 0.00 0.29 ± 0.14
As-O 0.07 ± 0.03 0.29 ± 0.14 0.44 ± 0.10 0.28 ± 0.07 0.39 ± 0.07 0.14 ± 0.13 0.30 ± 0.15
B-I 46.2 ± 7.3 129 ± 43.7 125 ± 12.5 94.6 ± 16.4 125 ± 16.5 NA 116 ± 40.0
B-O 45.9 ± 7.0 128 ± 68.0 126 ± 15.1 94.1 ± 15.9 121 ± 15.3 NA 115 ± 53.6
Ba-I 1.91 ± 1.26 3.19 ± 3.31 2.23 ± 0.33 5.10 ± 0.65 2.68 ± 0.49 NA 3.03 ± 2.45
Ba-O 1.88 ± 1.07 2.63 ± 0.67 2.20 ± 0.37 5.10 ± 0.65 2.63 ± 0.48 NA 2.74 ± 1.06
Ca-I 27.1 ± 3.9 46.4 ± 6.9 51.9 ± 3.4 38.3 ± 5.0 47.3 ± 4.2 28.4 ± 0.3 43.3 ± 9.6
Ca-O 27.3 ± 3.9 45.6 ± 8.9 52.6 ± 4.3 37.9 ± 5.2 47.3 ± 4.1 28.5 ± 0.5 42.9 ± 10.4
Cd-I 0.07 ± 0.01 0.12 ± 0.06 0.13 ± 0.04 0.07 ± 0.01 0.12 ± 0.04 0.07 ± 0.01 0.11 ± 0.05
Cd-O 0.07 ± 0.01 0.15 ± 0.25 0.12 ± 0.04 0.08 ± 0.01 0.13 ± 0.05 0.07 ± 0.01 0.12 ± 0.17
Co-I 0.53 ± 0.72 1.20 ± 3.34 0.66 ± 0.52 0.67 ± 0.53 0.59 ± 0.64 0.47 ± 0.32 0.82 ± 2.10
Co-O 0.26 ± 0.22 0.59 ± 0.57 0.61 ± 0.47 0.54 ± 0.45 0.51 ± 0.59 0.40 ± 0.27 0.52 ± 0.50
Cr-I 0.37 ± 0.32 0.63 ± 0.53 0.77 ± 0.30 0.55 ± 0.20 1.12 ± 0.58 0.43 ± 0.23 0.68 ± 0.49
Cr-O 0.25 ± 0.21 0.48 ± 0.29 0.66 ± 0.26 0.49 ± 0.21 0.79 ± 0.28 0.29 ± 0.13 0.52 ± 0.31
Cu-I 44.7 ± 39.5 54.1 ± 26.2 69.8 ± 39.3 41.2 ± 12.5 43.0 ± 10.9 39.7 ± 25.7 51.9 ± 30.1
Cu-O 27.6 ± 18.9 38.3 ± 15.8 43.8 ± 10.5 35.8 ± 14.1 35.1 ± 10.3 26.1 ± 11.8 36.4 ± 15.4
Fe-I 64.5 ± 215 103 ± 209 35.0 ± 50.0 31.6 ± 31.1 42.1 ± 36.7 19.3 ± 9.72 68.4 ± 164
Fe-O 14.5 ± 10.6 42.6 ± 124 15.9 ± 8.88 27.2 ± 30.5 26.4 ± 29.9 11.6 ± 9.96 29.1 ± 82.3
Pb-I 0.58 ± 0.76 1.12 ± 2.30 0.87 ± 0.53 0.49 ± 0.32 0.76 ± 0.68 0.92 ± 1.21 0.86 ± 1.52
Pb-O 0.32 ± 0.19 0.57 ± 0.49 0.68 ± 0.51 0.36 ± 0.28 0.58 ± 0.56 0.37 ± 0.19 0.51 ± 0.45
Mg-I 3.80 ± 0.96 12.4 ± 2.50 12.5 ± 3.0 9.44 ± 1.81 12.9 ± 1.6 3.45 ± 0.34 10.8 ± 3.9
Mg-O 3.71 ± 0.87 12.2 ± 2.90 12.6 ± 3.1 9.43 ± 1.76 12.9 ± 1.5 3.42 ± 0.34 10.7 ± 4.0
Mn-I 1.66 ± 2.83 2.30 ± 2.77 1.84 ± 2.08 1.55 ± 0.86 1.65 ± 0.92 1.48 ± 1.59 1.93 ± 2.30
Mn-O 1.97 ± 3.18 2.45 ± 3.32 1.71 ± 1.63 1.58 ± 0.87 1.71 ± 1.01 1.42 ± 0.89 2.02 ± 2.59
Hg-I 0.63 ± 0.46 0.36 ± 0.34 0.29 ± 0.29 0.39 ± 0.33 0.84 ± 1.10 0.24 ± 0.26 0.42 ± 0.45
Hg-O 0.62 ± 0.48 0.36 ± 0.34 0.25 ± 0.23 0.40 ± 0.39 1.06 ± 1.07 0.25 ± 0.20 0.43 ± 0.46
Mo-I 2.59 ± 0.84 6.24 ± 2.92 7.31 ± 2.79 5.27 ± 2.50 8.44 ± 3.63 2.99 ± 1.54 5.98 ± 3.23
Mo-O 2.56 ± 0.93 7.04 ± 6.56 7.63 ± 2.80 5.21 ± 2.44 8.46 ± 3.37 3.02 ± 1.55 6.33 ± 4.96
Ni-I 2.95 ± 1.90 8.33 ± 4.75 6.63 ± 1.83 5.61 ± 2.02 6.72 ± 1.48 3.16 ± 2.25 6.56 ± 3.83
Ni-O 2.32 ± 1.26 6.67 ± 2.91 5.90 ± 1.75 5.25 ± 2.10 5.95 ± 1.59 2.56 ± 2.12 5.50 ± 2.74
K-I 1.36 ± 0.26 1.62 ± 0.19 1.51 ± 0.17 1.50 ± 0.23 1.61 ± 0.23 1.30 ± 0.02 1.55 ± 0.23
K-O 1.38 ± 0.27 1.55 ± 0.20 1.52 ± 0.19 1.50 ± 0.22 1.61 ± 0.22 1.30 ± 0.02 1.52 ± 0.22
Sb-I 0.78 ± 0.42 1.30 ± 0.92 0.69 ± 0.64 0.54 ± 0.51 1.35 ± 1.11 1.06 ± 0.59 0.98 ± 0.79
Sb-O 0.91 ± 0.46 1.24 ± 1.17 0.70 ± 0.80 0.55 ± 0.44 1.50 ± 0.98 0.97 ± 0.57 1.00 ± 0.91
Se-I 0.44 ± 0.38 0.82 ± 0.48 1.05 ± 1.40 1.08 ± 1.21 0.78 ± 0.38 1.08 ± 0.95 0.86 ± 0.84
Se-O 0.35 ± 0.31 0.79 ± 0.39 1.08 ± 0.91 1.28 ± 1.45 0.86 ± 0.49 1.72 ± 0.88 0.89 ± 0.77
Na-I 28.5 ± 5.1 52.0 ± 7.6 50.4 ± 13.8 44.4 ± 5.3 53.6 ± 6.1 25.9 ± 1.2 47.3 ± 12.0
Na-O 28.6 ± 5.0 51.3 ± 9.0 50.7 ± 14.3 43.9 ± 5.6 53.4 ± 6.2 26.2 ± 1.2 46.8 ± 12.4
Sr-I 0.36 ± 0.09 1.15 ± 0.22 1.23 ± 0.13 0.90 ± 0.17 1.20 ± 0.18 NA 1.07 ± 0.31
Sr-O 0.37 ± 0.09 1.15 ± 0.23 1.25 ± 0.16 0.90 ± 0.17 1.19 ± 0.17 NA 1.07 ± 0.32
Ti-I 0.16 ± 0.10 0.18 ± 0.08 0.19 ± 0.06 0.21 ± 0.09 0.16 ± 0.08 NA 0.18 ± 0.08
Ti-O 0.48 ± 0.51 0.16 ± 0.06 0.19 ± 0.06 0.21 ± 0.10 0.15 ± 0.06 NA 0.19 ± 0.17
V-I 0.49 ± 0.12 1.94 ± 0.79 2.75 ± 0.32 1.85 ± 0.35 2.25 ± 0.58 NA 1.97 ± 0.83 V-O 0.57 ± 0.14 1.98 ± 0.83 2.83 ± 0.35 1.86 ± 0.35 2.46 ± 0.37 NA 2.04 ± 0.89
Zn-I 44.1 ± 55.2 70.5 ± 91.0 48.9 ± 42.9 30.7 ± 17.4 42.4 ± 59.5 26.1 ± 11.5 53.5 ± 69.7
Zn-O 18.6 ± 16.0 32.0 ± 48.7 22.2 ± 11.4 23.3 ± 19.8 13.3 ± 5.96 13.3 ± 7.76 24.1 ± 33.2
No. samplesc 46 128 56 37 42 12 321
No. locations 16 38 19 11 9 6 99
aConcentrations of elements are in µg·L−1, except for Ca, Mg, Na, and Sr, which are in mg·L−1; bI: indoor samples (I-HW); O: outdoor samples (O-HW); cSame
Figure 3. Variations in the increases of various trace elements in indoor household drinking water (I-HW) among sampling locations and governorates.
mean O-HW value (33.5 µg·L−1), with a difference of
only 3%. The higher mean values of I-HW and O-HW samples may be attributed to the source water and the piping network in the area. Additionally, we can con- clude that the increase of Al in the I-HW samples of the GCA governorate was the result of leaching from house- hold utilities and piping at the 38 sampling locations,
(37%), DUH (27%), and FAR (23%) locations and much lower increases at the JOY (13%), FRI (7%), and HSL (6%) locations.
The highest values of Cr (2.0 µg·L−1), Co (2.2 µg·L−1),
and Pb (2.2 µg·L−1) were found in the O-HW samples.
The mean values of Cr, Co, and Pb in the I-HW and the O-HW did not exceed 1.0 µg·L−1, which is a fairly low
level, at any location or governorate, with the following exceptions for the I-HW samples: 1) Cr in CSL (1.3 µg·L−1), JOY (1.5 µg·L−1), and GJA (1.1 µg·L−1); 2) Co
in CSH (8.1 µg·L−1), CSL (4.1 µg·L−1), and GCA (1.2
µg·L−1); and 3) Pb in CSH (6.3 µg·L−1) and GCA (1.1
µg·L−1). The lowest increase of Cr (2%) was found in
HSL, whereas the highest increases were found in CSL and CSW (140% and 78%, respectively) (Figure 3(b)).
The maximum Cr values in the I-HW and O-HW sam- ples were 5.2 and 2.5 µg·L−1, respectively, which is well
below the WHO guideline of 50 µg·L−1 [40]. The in-
crease in the Cr between the O-HW and I-HW samples may be the result of leaching from faucets and/or the metallic parts of household utilities [41]. There was no increase of Co in FAR, and the highest increases were found in CSH and CSL (1250% and 618%, respectively) (Figure 3(c)). There was a 13% decrease in the level of
Pb from the O-HW samples to the I-HW samples in CSO (Figure 3(f)), which is likely spurious because of the low
levels of Pb detected. The highest Pb increases were found in CSH and DUH (1165% and 375%, respectively). The Pb in CSH exceeded the WHO guideline of 10 µg·L−1 [40]. The Co levels in the I-HW samples of CSH
and CSL did not pose any health concerns, despite the large increases in both. The highest recorded value was 24.3 µg·L−1, and no guideline values for Co have been re-
commended by the WHO [40] or the US-EPA [42]. The leaching of Cu is strongly related to alkalinity and pH. Decreasing pH and increasing alkalinity results in increased Cu leaching [43]. The highest and lowest in- creases in Cu were found at CSH and CKF (204% and 1%, respectively) among the locations and in GAH and GHA (62% and 15%, respectively) among the gover- norates (Figure 3(d)). The ranges of the mean values of
Cu for the I-HW and O-HW samples were 32 - 129 µg·L−1
and 17 - 55 µg·L−1, respectively, within the locations and
40 - 70 µg·L−1 and 26 - 44 µg·L−1, respectively, within
the governorates (Table 2). The highest mean value of
Cu (129 µg·L−1, found in the I-HW sample collected at
the FAR location) was probably the result of leaching from the household metallic utilities, specifically from Cu piping (Table 1). The solubility of Cu piping depends
on the level of dissolved organics and on the aggressivity of the water [44,45].
Galvanized iron, ductile iron, cast iron, and steel are iron-based materials that constitute the main sources of
iron in the CP-DW in production and transportation equipment and piping or in household utilities. It has been reported that the leaching of Fe usually decreases with increasing pH and that corrosion rates decrease with increasing alkalinity at a fixed pH [46]. Among the ele-ments in the 8-TE group, Fe had the highest increase (135%) from the I-HW samples to the O-HW samples out of the 321 samples collected (Figure 2). This value
represents the mean of the increases in all locations and governorates and ranges from 5% in HSL to 640% in CSO (Figure 3(e)). The HSL sampling location, which
was one of the six apartments in a 3-story building with nonmetal utilities and a high rate of water consumption caused by a high population of residents, had the lowest Fe increase. The CSO location, which was a moderately old house with six occupants and galvanized iron utilities, had the highest increase of Fe. The CQB location had a much lower Fe increase (69%) than the CSO (640%), CSH (498%), CSW (378%), and CSE (308%) locations but exhibited the highest mean I-HW and O-HW values (576 µg·L−1, with a maximum of 1589 µg·L−1, 340 µg·L−1,
with a maximum of 987 µg·L−1, respectively). The CSO,
CSH, CSW, and CSE locations had mean I-HW and O-HW Fe values of 167 and 23 µg·L−1, 98 and 16 µg·L−1,
51 and 11 µg·L−1, and 92 and 23 µg·L−1, respectively,
with maximum values of 388 and 59 µg·L−1, 134 and 21
µg·L−1, 72 and 24 µg·L−1, and 351 and 93 µg·L−1, respec-
tively. The CKF location had the lowest mean value for Fe, with 9.5 µg·L−1 in the I-HW samples and an increase
of 12%, which was slightly higher than that of the HSL location (5% increase and 31 µg·L−1 mean value) (
Figure 3(e), Table 2). Among the governorates, GAH (with 16
sampling locations) had the highest increase in Fe be-tween the O-HW and I-HW samples (345%), with a mean I-HW value of 65 µg·L−1, followed by GCA (with
38 sampling locations), with an increase of 142% and the highest mean value of 103 µg·L−1. Again, the higher val-
ues in CQB compared with the other locations were caused by the corrosion of indoor piping and utilities (for I-HW samples) and the outdoor piping of the distribution network (for O-HW samples) (Table 1).
The most important source of Ni in drinking water is generally the passive leaching of ions from the surfaces of metallic piping, nickel-plated taps, tap valves, and metallic connectors for polypropylene piping rather than corrosion [41,47]. Because of the lower Ni content in the equipment used for water production and distribution as well as in household utilities compared with other metals, the mean level of Ni and the leaching from household utilities in all locations were significantly lower than those of Al, Cu, Fe, and Zn. The ranges of the mean val- ues of Ni were 1.8 - 9.3 µg·L−1 and 2.1 - 12.8 µg·L−1 for
shows that the Ni increase ranged from 2% for HSL to 98% for CHS. The lowest mean values of Ni were found at DUH (1.8 and 2.1 µg·L−1 for I-HW and O-HW, re-
spectively), whereas the highest values were found at the CSW location (9.3 and 12.8 µg·L−1 for I-HW and O-HW,
respectively). These results illustrate the role of water production equipment and the distribution network in the leaching of Ni in the O-HW, as DUH and CSW were completely fed by the Az-Zoor and Shuwaikh plants, respectively. The lowest mean values of Ni in the O-HW samples among governorates were found in GAH and GMK (2.3 µg·L−1 and 2.6 µg·L−1, respectively), which
are fed by the Az-Zoor plant, whereas the highest mean value was found in GCA (6.7 µg·L−1), in which most of
the 38 sampling locations are fed by the Shuaikh and Doha plants.
Zn is widely used for galvanizing steel and iron prod- ucts as well as the production of corrosion-resistant al- loys. These products are widely used in drinking water production utilities, distribution systems, and storage facilities. In this study, the average increase of 123% for Zn between the O-HW and I-HW samples from various locations and governorates was the second highest in- crease, after the increase in Fe. The increase in Zn varied between 18% (in FRI) and 599% (in CSH), as illustrated in Figure 3(h). The increase of Zn in the CHS samples
was 12 times higher than the increase in the CQB sam- ples, even though the mean values of Zn in the I-HW samples of CQB and CSH were the highest out of all of the locations and were similar (231 and 194 µg·L−1, re-
spectively) (Table 2). This large difference in the in-
crease of Zn between the two locations (CQB and CHS) was caused by higher leaching from the outdoor piping in CQB compared with CHS. The O-HW mean values were 154 and 28 µg L−1 for CQB and CHS, respectively (
Ta- ble 2). CKF had the lowest mean values for the I-HW
and O-HW samples (16.3 and 8.7 µg·L−1, respectively)
with a fairly low increase of Zn (87%). Among the gov- ernorates, the highest and lowest increases of Zn were found in GJA (219%, with nine locations) and GHA (32%, with 11 locations). These variations among the locations and governorates were related to the degree of leaching from indoor utilities and outdoor piping (Table 1). Galvanized iron releases high levels of Zn, with a
small contribution from taps and other metallic parts [41].
Al-Mudhaf and Abu-Shady [15] reported that Fe, Pb, and Ni exceeded the US-EPA [42] and WHO [40] guide- lines in 8.5%, 0.3%, and 1% of the I-HW samples, re- spectively. In this study, only Fe was found to exceed the US-EPA guidelines, in 3% of the O-HW samples. This finding indicates that household utilities may cause health concerns for the consumers of drinking water in
Kuwait. The I-HW samples of the earlier study [15] and the O-HW samples in this study were collected at the same time and analyzed on the same day.
The water characteristics have been found to deter- mine the types and amounts of TEs leached from piping and utilities [48]. Wagner [49] reported that the free CO2
content and pH of the water were primarily responsible for the corrosion of the piping. Ruckert and Sturzbecher [50] found that the lifetime of the pipe inner surface coating was pH-dependent. In this study, no correlations were found between the variations of the mean pH levels at various sampling locations and governorates and the corresponding increases in any of the elements in the 8-TE group. This lack of correlation may be the result of a convergence among the mean pH values, with ranges of 7.53 - 7.71 and 7.51 - 7.70 for the I-HW and O-HW samples, respectively.
Maessen et al. [51] reported that the degree of
leach-ing of some of the TEs was strongly related to some of the variable WQPs, such as conductivity, TDS, Cl−,
2 4
SO, and NO3
. In this study, no correlations were
observed among increases in Al, Co, Cr, Pb, and Ni and conductivity, Cl−, or 2
4
SO . The variations in the in-
creases of Cu, Fe, and Zn with conductivity, residual Cl, and Cl− are illustrated in
Figure 4. The increases in Cu,
Fe, and Zn were inversely proportional to the conductiv- ity in most cases (Figures 4(a1), (b1) and (c1), respec-
tively) and directly proportional to the values of Cl−
(Figures 4(a2), (b2) and (c2), respectively). The same
pattern was observed for TDS, which is often positively correlated with the conductivity of water. The TDS (ppm) usually ranges from 0.5 to 1.0 times the conductivity [18]. It has been reported that the degree of corrosion of some TEs increases with an increase in residual chlorine Cl [52, 53]. Viraraghavan et al. [32] and Reiber [53] reported
that the residual Cl levels strongly affect the degree of leaching of Cu, even at levels lower than 0.1 mg·L−1. In
this study, no definite correlations were observed be- tween the mean values of residual Cl and the increases in Cu (Figure 4(a3)), Fe (Figure 4(b3)), or Zn (Figure 4(c3).
El Hosary and Gawish [54] reported that the corrosion rate of water piping was higher during the summer months than the winter months. Table 3 illustrates the
mean values of various trace elements in the indoor (I-HW) and outdoor (O-HW) drinking water samples collected in the summer and in the winter from all sam- pling locations. In agreement with the finding of El Hosary and Gawish [54], Figure 5 shows that the in-
Figure 4. Variations in the increases of trace elements in indoor household drinking water (I-HW) with water quality pa-rameters.
Table 3. Mean values of various trace elements of the in-door (I-HW) and outin-door (O-HW) drinking water samples collected in the summer and in the winter from all sampling locations.
Summer Winter Element
I-HW O-HW I-HW O-HW
Al 13.0 10.8 10.9 8.10
Cr 0.70 0.53 0.66 0.52
Co 0.75 0.46 0.87 0.57
Cu 59.6 39.3 49.5 35.7
Fe 101 29.7 58.7 28.9
Pb 0.51 0.21 1.01 0.66
Ni 5.80 4.94 7.12 5.92
Ti 0.22 0.26 0.16 0.16
V 2.07 2.09 1.94 2.02
Zn 67.1 28.1 48.9 22.7
Figure 5. Variations in the increases of various trace ele-ments in indoor household drinking water (I-HW) in the summer and in the winter.
increase in the summer relative to winter was observed for Pb (155%), followed by Fe (133%), and Zn exhibited the lowest increase (20%). The increase of Co, Cu, and Cr in the I-HW samples were 64%, 52%, and 31%, re-and the I-HW samples in the summer re-and winter.
[image:12.595.310.534.432.633.2]spectively in the summer and 54%, 39%, and 27%, re- spectively, in the winter, with 19%, 33%, and 15% in- creases, respectively, in the summer relative to the winter.
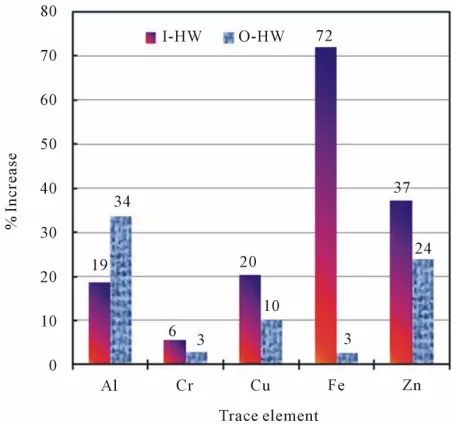
Figure 6 shows the increases of the mean values of Al,
Cr, Cu, Fe, and Zn in the summer relative to the winter for the I-HW and O-HW samples. The increases of Cr, Cu, Fe, and Zn were higher in the I-HW samples than in the O-HW samples, whereas the increases in Al were lower in the I-HW samples than in the O-HW samples. The highest increase was found in the I-HW samples of Fe (72%); this increase was significantly higher than that of the O-HW samples (3%). The increases of Co, Pb, and Ni were slightly higher in the winter than in the summer for the I-HW and the O-HW samples. These observations indicate that household storage and plumbing utilities contribute to the increases in Fe through corrosion.
4. Conclusions
The corrosion of the metallic materials that come into contact with drinking water during its production and transportation via the general distribution network and through private household utilities was studied. House- hold desalinated drinking water samples collected from 99 locations and representing more than 95% of the resi- dential areas in Kuwait were analyzed for 25 trace ele- ments and water quality parameters. A comparison of household tap water at the consumption points (I-HW) with water in distribution networks just outside of build- ings (O-HW) indicated that, 1) because of leaching from the household utilities, the mean concentrations of the elements in the 8-TE group (Al, Cr, Co, Cu, Fe, Pb, Ni,
Figure 6. The increases of various trace elements in the summer relative to the winter for indoor (I-HW) and the outdoor (O-HW) household drinking water.
and Zn) were higher in the I-HW samples than in the O-HW samples at all sampling locations and in all gov- ernorates. Be was not detected in any of the samples, and there were no significant differences among the mean values of the remaining 16 TEs in the O-HW and I-HW samples. Additionally, 2) the highest increases were ob- served for Fe (135%) and Zn (123%), followed by Pb (69%), Co (58%), Cu (42%), Cr (31%), and Al (30%); the lowest increase was observed for Ni (19%). More- over, we found that 3) in most cases, the increases in Cu, Fe, and Zn were inversely proportional to the conducti- vity of the water and directly proportional to the concen- tration of Cl−. 4) Fe exceeded the US-EPA guideline in
3% of the O-HW samples and was the only element to exceed the guidelines in the O-HW samples, whereas Fe, Pb, and Ni exceeded the US-EPA and WHOguidelines in 8.5%, 0.3%, and 1% of the I-HW samples, respec- tively. Thus, leaching from household utilities may cause health concerns for the consumers of drinking water in Kuwait. Furthermore, 5) the mean values of all of the elements in the 8-TE group, with the exception of Al, were higher in the I-HW samples in the summer than in the winter. The increase in Fe was the highest in the summer (240%), and the largest difference (139%) was observed between the summer and winter increases. 6) The complementary information regarding installed pip- ing and utilities, premises, and desalination plants col- lected in this study reveal the current complexity of household systems and public water distribution net- works operating in Kuwait.
The results of this study may prove useful for water production authorities and consumers in Kuwait and suggest the use of alternative new pipes with more resis- tant internal coatings and connecting techniques. Metallic materials that exhibit corrosion will be progressively replaced with new drinking-water-compatible polymeric and multilayer materials that have appeared in the market. In addition, new alloys will replace some materials cur- rently used in the manufacturing of taps, valves, fittings, and connections to minimize the leaching of hazardous metals into household drinking water.
5. Acknowledgements
The authors acknowledge their gratitude for and appre- ciation of the Kuwait Foundation for the Advancement of Sciences (KFAS) for financial support for this study (grant # 2001-1505-03) and the Public Authority for Ap- plied Education and Training (PAAET) for partial finan- cial support and guidance.
REFERENCES
Freshwater Resources,” Island Press, Washington DC, 2009, p. 195.
http://www.worldwater.org/data20082009/Table1.pdf [2] S. A. Imran, J. D. Dietz, G. Mutoti, W. Z. Xiao, J. S.
Taylor and V. Desai, “Optimizing Source Water Blends for Corrosion and Residual Control in Distribution Sys- tems,” Journal of the American Water Works Association, Vol. 98, 2006, pp. 107-115.
[3] O. Lahav and L. Birnhack, “Quality Criteria for Desali- nated Water Following Post Treatment,” Desalination,
Vol. 207, No. 1-3, 2007,pp. 286-303. doi:10.1016/j.desal.2006.05.022
[4] M. Rygaard, E. Arvin and P. J. Binning, “The Valuation of Water Quality: Effects of Mixing Different Drinking Water Qualities,” Water Research,Vol. 43, No. 5, 2009, pp. 1207-1218. doi:10.1016/j.watres.2008.12.014 [5] World Health Organization (WHO), “Nutrients in
Drink-ing Water. Water, Sanitation and Health Protection and the Human Environment,” WHO, Geneva, 2005.
[6] O. A. Al-Khashman, “Study of Water Quality of Springs in Petra Region, Jordan: A Three-Year Follow-Up,”
Wa-ter Resource Management, Vol. 21, No. 7, 2007, pp.
1145-1163. doi:10.1007/s11269-006-9073-8
[7] S. I. Korfali and M. Jurdi, “Assessment of Domestic Wa- ter Quality: Case Study, Beirut, Lebanon,” Environmental
Monitoring and Assessment, Vol. 135, No. 1-3, 2007,pp.
241-251. doi:10.1007/s10661-007-9646-x
[8] S. Karavoltsosa, A. Sakellaria, N. Mihopoulosb, M. Das- senakisa and M. J. Scoullos, “Evaluation of the Quality of Drinking Water in Regions of Greece,” Desalination,Vol.
224, No. 1-3, 2008,pp. 317-329. doi:10.1016/j.desal.2007.06.013
[9] J. Virkutyte and M. Sillanpää, “Chemical Evaluation of Potable Water in Eastern Qinghai Province, China, Hu- man Health Aspects,” Environment International, Vol. 32,
No. 1, 2006,pp. 80-86. doi:10.1016/j.envint.2005.05.022 [10] U. I. Al-Saleh and I. Al-Doush, “Survey of Trace Ele-
ments in Household and Bottled Drinking Water Samples Collected in Riyadh, Saudi Arabia,” Science of the Total
Environment,Vol. 216, No. 3, 1998,pp. 181-192.
doi:10.1016/S0048-9697(98)00137-5
[11] M. Ahmad and A. S. Bajahlan, “Quality Comparison of Tap Water vs. Bottled Water in the Industrial City of Yanbu (Saudi Arabia),” Environmental Monitoring and
Assessment,Vol. 159, No. 1-4, 2009,pp. 1-14.
doi:10.1007/s10661-008-0608-8
[12] K. M. Al-Fraij, M. K. Abd-El-Aleem and H. Al-Ajmy, “Comparative Study of Potable and Mineral Waters Available in the State of Kuwait,” Desalination,Vol. 123, No. 2-3, 1999,pp. 253-264.
doi:10.1016/S0011-9164(99)00081-8
[13] Z. S. Rizk, “Inorganic Chemicals in Domestic Water of the United Arab Emirates,” Environmental Geochemistry
and Health,Vol. 31, No. 1,2009,pp. 27-45.
doi:10.1007/s10653-008-9153-1
[14] A. O. Musaiger and Z. A. Khunji, “Chemical Quality of Drinking Water in Bahrain,” Journal of the Royal Society
of Health,Vol. 110, No. 3, 1990,pp. 104-105.
doi:10.1177/146642409011000312
[15] H. F. Al-Mudhaf and A. I. Abu-Shady, “Comparison of the Trace Element Contents in Bottled and Desalinated Household Drinking Water in Kuwait,” CLEAN—Soil,
Air, Water, Vol. 40, No. 9, 2012, pp. 986-1000.
doi:10.1002/clen.201100618
[16] H. F. Al-Mudhaf, M. N. Al-Hayan and A. I. Abu-Shady, “Mineral Content of Bottled and Desalinated Household Drinking Water in Kuwait,” CLEAN—Soil, Air, Water,
Vol. 39, No. 12, 2011,pp. 1068-1080. doi:10.1002/clen.201100257
[17] H. F. Al-Mudhaf, A. I. Abu-Shady, M. I. Selim and F. A. Alsharifi, “Survey of Haloacetic Acids in Bottled and Household Drinking Water Produced from Thermal De-salination in Kuwait,” Open Environmental Sciences, Vol.
3, 2009,pp. 66-78.
http://bentham.org/open/toenvirsj/openaccess2.htm [18] H. F. Al-Mudhaf, M. I. Selim, A. M. Astel and A. I. Abu-
Shady, “Spatial Variation of Haloacetic Acids in Indoor and Outdoor Desalinated Household Drinking Water in Kuwait,” CLEAN—Soil, Air, Water, Vol. 39, No. 9, 2011, pp. 833-843. doi:10.1002/clen.201000459
[19] M. Y. Ali and J. P. Riley, “The Production of Brominated Methanes in Desalination Plants in Kuwait,” Water
Re-search, Vol. 23, No. 9, 1989, pp. 1099-1106.
doi:10.1016/0043-1354(89)90153-X
[20] M.Y. Ali and J. P. Riley, “Distribution of Halomethanes in Potable Waters of Kuwait,” Water Research, Vol. 24,
No. 4, 1990,pp. 533-538. doi:10.1016/0043-1354(90)90240-7
[21] N. A. Latif, F. M. Al-Awadi and B. A. Colenutt, “Triha-lomethanes (THMs) Formation in Multi-Stage Flash (MSF) Desalination Plants,” Desalination, Vol. 74, 1990,
pp. 205-226. doi:10.1016/0011-9164(89)85052-0 [22] H. F. Al-Mudhaf and A. I. Abu-Shady, “Trihalomethane
Levels and Their Seasonal Variation in Drinking Water Produced from Thermal Desalination in Kuwait,” Open
Environmental Sciences, Vol. 2, 2008,pp. 88-100.
http://bentham.org/open/toenvirsj/openaccess2.htm [23] H. F. Al-Mudhaf, A. M. Astel, M. I. Selim and A. I. Abu-
Shady, “Self-Organizing Map Approach in Assessment Spatiotemporal Variations of Trihalomethanes in Desali-nated Drinking Water in Kuwait,” Desalination, Vol. 252,
No. 1-3, 2010,pp. 97-105. doi:10.1016/j.desal.2009.10.017
[24] H. F. Al-Mudhaf, F. A. Alsharifi and A. I. Abu-Shady, “Survey of Organic Contaminants in Household and Bot-tled Drinking Waters in Kuwait,” Science of the Total
Environment,Vol. 407, No. 5, 2009,pp. 1658-1668.
doi:10.1016/j.scitotenv.2008.10.057
[25] K. M. Al-Fraij, A. Al-Odwani and M. K. Abd-El-Aleem, “Pollution of Drinking Water by Means of Transporta-tions and Storage and the Proposed Strategies,” WSTA,
5th Gulf Water Conference, Doha, Vol. 1, 24-28 March
2001, pp. 219-241.
logical and Environmental Chemistry, Vol. 92, No. 3, 2010, pp. 521-535. doi:10.1080/02772240903036139 [27] J. Taylor, Z. Tang, W. Xiao and S. Hong, “Monitoring of
Distribution Water Qualities under Various Source Water Blending,” Environmental Monitoring and Assessment,
Vol. 117, No. 1-3, 2006, pp. 59-71. doi:10.1007/s10661-006-7672-8
[28] T. Viraraghavan, K. S. Subramanian and B. V. Rao, “Drinking Water at the Tap: Impact of Plumbing Materi- als on Water Quality,” Journal of Environmental Science
and Health, Part A, Vol. 31, No. 8, 1996, pp. 2005-2016.
doi:10.1080/10934529609376470
[29] M. R. Sha Mansouri, H. P. Moghadas and G. Sahmsk- horraabadi, “A Study of Leakage of Trace Metals from Corrosion of the Municipal Drinking Water Distribution System,” Journal of Research in Medical Sciences, Vol. 8, No. 3, 2003, pp. 1-6.
[30] Y. S. Tam and P. Elefsiniotis, “Corrosion Control in Wa- ter Supply Systems: Effect of pH, Alkalinity, and Ortho-phosphate on Lead and Copper Leaching from Brass Plumbing,” Journal of Environmental Science and Health,
Part A,Vol. 44, No. 12, 2009,pp. 1251-1260.
doi:10.1080/10934520903140009
[31] A. S. Hill, M. J. Friedman, S. H. Reiber, G. V. Korshin and R. L. Valentine, “Behavior of Trace Inorganic Con- taminants in Drinking Water Distribution System,”
Jour-nal of the American Water Works Association,Vol. 102,
2010, pp.107-118.
[32] T. Viraraghavan, K. S. Subramanian and B. Venkata Rao, “Impact of Household Plumbing Fixtures on Drinking Water Quality—A Review,” International Journal of
En-vironmental Studies, Vol. 56, No. 5, 1999, pp. 717-743.
doi:10.1080/00207239908711234
[33] I. A. Alam and M. Sadiq, “Metal Contamination of Drinking Water from Corrosion of Distribution Pipes,”
Environmental Pollution, Vol. 57, No. 2, 1989,pp.
167-178. doi:10.1016/0269-7491(89)90008-0
[34] M. Payne, “Lead in Drinking Water,” Canadian Medical
AssociatonJournal, Vol. 179, No. 3, 2008, pp. 253-254.
doi:10.1503/cmaj.071483
[35] US-EPA, “Methods and Guidance for Analysis of Water, Office of Water,” Washington DC, 20460, EPA 821-C-99- 004, 1999.
[36] WHO, “Nickel in Drinking Water,” Geneva, 2005. WHO/SDE/WSH/05.08/55
[37] “European Union (EU) Directive Related with Quality of Water Intended for Human Consumption. 98/83/EC,”
Of-ficial Journal of the European Communities, Vol. L330,
1998, pp. 32-54.
[38] H. Baribeau, M. Prevost, R. Desjardins and P. Lafrance, “Changes in Chlorine and DOX Concentrations in Dis-tribution Systems,” Journal of the American Water Works
Association, Vol. 93, 2001, pp. 18-32.
[39] American Water Works Association (AWWA), “Water Quality and Treatment,” AWWA, USA, 1990.
[40] WHO, “Guidelines for Drinking-Water Quality, 3rd Edi-tion, Recommendations,” Incorporating 1st and 2nd
Ad-denda, Vol. 1, WHO, Geneva, 2008.
[41] E. J. Hoekstra, V. Pedroni, R. Passarella, P. R. Trin- cherini and S. J. Eisenreich, “Elements in Tap Water, Part 3, Effect of Sample Volume and Stagnation Time on the Concentration of the Element,” EUR 20672 EN/3, Euro-pean Communities, 2004.
[42] US-EPA, “Drinking Water Standards and Health Adviso- ries,” EPA 822-R-04-005, Office of Water, US Environ- mental Protection Agency, Washington DC, 2004. [43] J. Taylor, Z. Tang, W. Xiao and S. Hong, “Monitoring of
Distribution Water Qualities under Various Source Water Blending,” Environmental Monitoring and Assessment,
Vol. 117, No. 1-3, 2006, pp. 59-71. doi:10.1007/s10661-006-7672-8
[44] M. Groenendijk and E. Coppens, “The Consequences of the New Parametric Value for Copper in Drinking Wa-ter,” H2O, Vol. 19, 2002, pp. 92-95.
[45] P. G. G. Slaats, E. J. M. Blokker and J. F. M. Versteegh, “Sampling Metals at the Tap: Analyses of Dutch Data over the Period 2004-2006,” Proceedings of Cost Action
637 METEAU—Metals and Related Substances in
Drink-ing Water, Antalya, Turkey, 2007, pp. 61-69.
[46] P. Sarin, J. A. Clement, V. L. Snoeyink and W. M. Kriven, “Iron Release from Corroded, Unlined Cast-Iron Pipe,” Journal of the American Water Works Association, Vol. 95, 2003, pp. 85-96.
[47] W. Schwenk, “Nickel Transfer from Cr-Ni Stainless Steel Pipework into Potable Water,” GWF Wasser Abwasser,
Vol. 133, 1992, pp. 281-286.
[48] M. R. Schock and C. H. Neff, “Trace Metal Contamina- tion from Brass Fittings,” Journal of the American Water
Works Association, Vol. 80, 1988, pp. 47-56.
[49] I. Wagner, “Internal Corrosion in Domestic Drinking Water Installations,” Journal of Water Supply: Research
and Technology—Aqua, Vol. 41, 1992, pp. 219-223.
[50] J. Ruckert and D. Sturzbecher, “Long Term Performance of Galvanized Steel Tubes in Drinking Water with Dif-ferent pH-Value and Flow Velocity,” Werkstoffe und
Korrosion, Vol. 39, 1988, pp. 7-17.
[51] O. Maessen, B. Freedman and R. McCurdy, “Metal Mo- bilization in Home Well Water Systems in Nova Scotia,”
Journal of the American Water Works Association,Vol.
77, 1985, pp. 73-80.
[52] S. Reiber, “Galvanic Stimulation of Corrosion on Lead- Tin Solder-Sweated Joints,” Journal of the American
Water Works Association,Vol. 83, 1991, pp. 83-91.
[53] S. Reiber, “Copper Plumbing Surfaces: An Electro- chemical Study,” Journal of the American Water Works
Association, Vol. 81, 1989, pp. 114-122.
[54] A. A. El Hosary and M. M. Gawish, “Corrosion and Cor-rosion Inhibition of Steel in Tap Water,” Egyptian