ORIGINAL RESEARCH
MR Imaging of Brain Volumes: Evaluation of a
Fully Automatic Software
K. Ambarki A. Wåhlin R. Birgander A. Eklund J. Malm
BACKGROUND AND PURPOSE: Automatic assessment of brain volumes is needed in research and clinical practice. Manual tracing is still the criterion standard but is time-consuming. It is important to validate the automatic tools to avoid the problems of clinical studies drawing conclusions on the basis of brain volumes estimated with methodologic errors. The objective of this study was to evaluate a new commercially available fully automatic software for MR imaging of brain volume assessment. Automatic and expert manual brain volumes were compared.
MATERIALS AND METHODS:MR imaging (3T, axial T2 and FLAIR) was performed in 41 healthy elderly volunteers (mean age, 70⫾6 years) and 20 patients with hydrocephalus (mean age, 73⫾7 years). The software QBrainwas used to manually and automatically measure the following brain volumes: ICV, BTV, VV, and WMHV. The manual method has been previously validated and was used as the reference. Agreement between the manual and automatic methods was evaluated by using linear regression and Bland-Altman plots.
RESULTS: There were significant differences between the automatic and manual methods regarding all volumes. The mean differences were ICV⫽49⫾93 mL (mean⫾2SD,n⫽61), BTV⫽11⫾70 mL, VV⫽ ⫺6⫾10 mL, and WMHV⫽2.4⫾9 mL. The automatic calculations of brain volumes took approximately 2 minutes per investigation.
CONCLUSIONS:The automatic tool is promising and provides rapid assessment of brain volumes. However, the software needs improvement before it is incorporated into research or daily use. Manual segmentation remains the reference method.
ABBREVIATIONS:A⫽automatic, BTV⫽brain tissue volume; FLAIR⫽fluid-attenuated inversion recovery; ICV⫽intracranial volume; M⫽manual; MD⫽mean difference; MRD⫽mean relative difference; Obs1⫽observer 1; Obs2⫽observer 2; 2SD⫽limits of agreement; SNIPER⫽Software for Neuro-Image Processing in Experimental Research; VV⫽ventricular volume; WMHV⫽white matter hyperintensity volume
V
olume quantification of the intracranial compartments is important in several neurologic diseases. For example, hy-drocephalus is defined according to the size of the ventricles.1The degree and longitudinal evolution of white matter lesions reveal the clinical course of multiple sclerosis and vascular dementia.2,3Brain atrophy is used for the diagnosis of Alzhei-mer disease, and volume changes of brain tumors may be used as markers of prognosis or treatment.4-7
Volumetric MR imaging was the first noninvasive in vivo technique to assess the volume of the intracranial compart-ments accurately.8,9Today, the techniques of MR imaging
vol-ume quantification are mainly manual or semiautomatic. Manual segmentation is performed by an observer tracing the
outer contour of a region of interest on each section. The semi-automatic techniques also require input and feedback from the observer. Both manual and semiautomatic techniques are time-consuming and thus expensive; therefore, volumetric es-timations are seldom used in clinical routine.
It is important to develop tools to measure volumes fast and reliably. Different kinds of software have been developed to segment the brain volumes in a fully automatic way.10-13
These types of software are not commercially available and have only been validated and evaluated by the developers. FreeSurfer (http://surfer.nmr.mgh.harvard.edu/fswiki), a freely available software, has been evaluated against manual segmentation in a recent study, but the time needed for auto-matic computing of the brain volumes is too long for clinical use.14
A new automatic software, QBrain (Medis, Leiden, the
Netherlands), has been developed to quantify BTV, ICV, brain VV, and WMHV. Using this software, the observer can per-form the manual or the fully automatic segmentation of these brain volumes.
The fully automatic segmentation of QBrainis based on axial
MR imaging sequences (FLAIR and T2-weighted); and by us-ing a standard computer, the software automatically calculates the different volumes within a few minutes. This automatic software is promising, but it has not been validated yet.
In this study, we have selected the thorough manual seg-mentation of an experienced observer as the reference method. We believe that the manual method is the best possi Received May 19, 2010; accepted after revision July 2.
From the Department of Biomedical Engineering and Informatics (K.A., A.W., A.E.), De-partment of Radiation Sciences (K.A., A.W., R.B., A.E.), Centre for Biomedical Engineering and Physics (A.E.), and Department of Clinical Neuroscience (J.M.), Umeå University, Umeå, Sweden.
The study was supported by the Swedish Foundation for Strategic Research, Swedish Research Council and Swedish Governmental Agency for Innovation Systems.
A free license for QBrainsoftware was obtained from the manufacturer (Medis Medical Imaging Systems, Leiden, the Netherlands).
Please address correspondence to Khalid Ambarki, PhD, Department of Radiation Sciences, Umeå University, SE-901 87 Umeå, Sweden; e-mail: [email protected]
Indicates open access to non-subscribers at www.ajnr.org
Indicates article with supplemental on-line figures at www.ajnr.org
ble estimate of the volumes, and this belief was also supported in a previous study using MR imaging volume phantoms, which showed that the manual segmentation tool of QBrain
produces accurate and reproducible volume estimates.1The
aim of this study was to evaluate this new automatic software. In a group of 61 individuals, the QBrainmanual protocol was
used as the criterion standard and was compared with the QBrainautomatic protocol.
Materials and Methods
MR Imaging Investigation
Subjects were studied with a 3T Achieva MR imaging scanner (Philips Healthcare, Best, the Netherlands) with an 8-channel head coil. Axial T2-weighted turbo spin-echo (TE⫽80, TR⫽3000 ms) and FLAIR (TE⫽140, TR⫽12000, and TI⫽2850 ms) sequences were obtained. The section thickness was 3 mm, the intersection gap was 0.3 mm, and the matrix was 512⫻512 in both T2-weighted and FLAIR sequences. The voxel volume was 0.72 mm3(0.4687⫻0.4687⫻3.3) in
T2-weighted and 0.67 mm3(0.4492⫻0.4492⫻3.3) in FLAIR sequences.
Subjects
Sixty-one subjects were included. To obtain a large span of brain volumes, we chose 41 healthy elderly volunteers (mean age, 70⫾6 years; 24 women) and 20 patients with ventriculomegaly due to pos-sible or probable idiopathic normal pressure hydrocephalus (mean age, 73⫾7 years; 9 women).15,16The study was approved by the
university ethics board.
Volumetry
Volumetric MR imaging measurements were performed by using the image analysis software QBrain(Version 2.0). Volumes were calculated
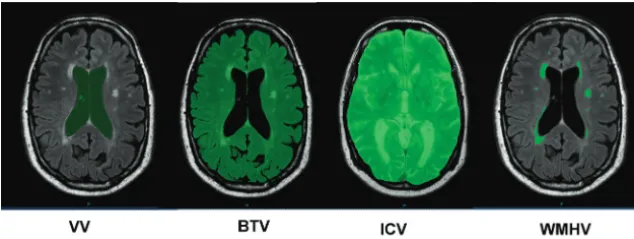
by using a standard computer (2.19 GHz, 1.96 GB of RAM). The volume quantifications were first performed with the manual seg-mentation and second with the fully automatic segseg-mentation algo-rithms. Using the manual protocol, the observer segmented an area in each section by manually tracing the borders of the region of interest. The software estimates the volume in milliliters. ICV, BTV, VV, and WMHV were assessed. ICV was measured on T2 images; and BTV, VV, and WMH were measured on FLAIR images (Fig 1). The same brain volumes were measured by using automatic segmentation. The methodology of automatic segmentation was based on SNIPER (Lei-den University Medical Center) and has been described previously.12
Manual Segmentation as the Reference Method
The manual method, used as the reference in this study, has been previously validated by using phantom models with well-defined
vol-umes.1,17The main observer in both studies (observer 1) was trained
by a neuroradiologist and had 3 years’ experience in brain volume segmentation. We further investigated the variability of the manual method by letting an additional observer measure brain volumes in 5 patients with hydrocephalus and in 5 healthy controls. The intraob-server variability was assessed by measuring the brain volumes twice by the same observer (observer 1). The time between the first and the second segmentation was always⬎1 month. For the interobserver variability, a second observer (observer 2) measured the brain vol-umes in the same 10 subjects and was blinded to the results of the first observer. Inter- and intraobserver variability was expressed as the MD between repeated brain volume measurements with the limits of agreement defined as 2 SD. MRD was also calculated.
Statistics
The statistical analysis was performed with the Statistical Package for the Social Sciences software, Version 12.0 (SPSS, Chicago, Illinois). Correlations between the automatic and the manual brain volumes were investigated by using linear regression analysis. Bland-Altman plots were used. The Shapiro-Wilk test was used to test the normality. Differences between the means of repeated brain volume measure-ments were analyzed by using the pairedttest or the Mann-Whitney test when appropriate. The duration to assess all volumes by using the fully automatic protocol was measured by using a stopwatch.P val-ues⬍.05 were considered statistically significant.
Results
The average brain volumes of the 61 subjects assessed by the manual and automatic methods are shown in Table 1. Comparisons between manual and automatic volume mea-surements are shown in Figs 2 and 3. The meamea-surements were highly correlated (VV:R⫽0.998,P⬍.01; ICV:R⫽
0.936,P⬍ .01; BTV:R⫽0.934,P ⬍.01; WMHV: R⫽
0.961,P⬍.01).
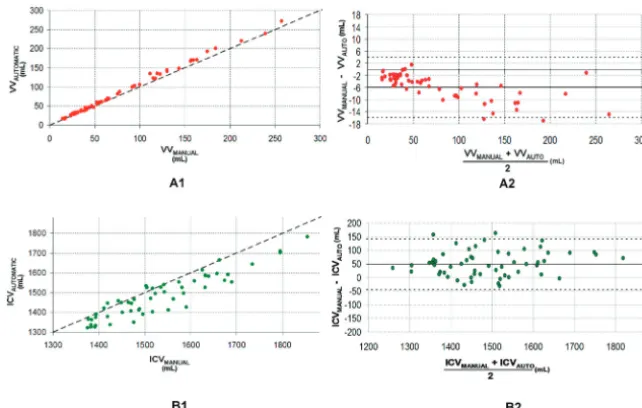
However, there were significant differences between the mean volumes calculated by the manual and the automatic methods for ICV, BTV, VV, and WMHV (ICV,P⬍.01; BTV,P⫽.02; VV,P⬍.01; WMHV,P⬍.01). As shown in Figs 2B1, 3A1, and 3B1, the automatic method underesti-mated ICV, WMHV, and BTV. The systematic differences are displayed in Table 2 and also in the Bland-Altman plots (Figs 2B2, 3A2, and 3B2). There was a systematic overesti-mation of the VV by using the automatic segmentation (Fig 2A2and Table 2).
The Bland-Altman plots show a correlation between the mean and the difference of the automatic and manual
meth-Fig 1.Manual segmentation of brain volumes.
BRAIN
ORIGINAL
[image:2.594.136.453.43.162.2]ods for WMHV (R⫽0.48,P⬍.01) and VV (R⫽0.68,P⫽
.01). This was not observed for BTV or ICV (Figs 2B1and 3B2).
[image:3.594.52.538.57.118.2]The variability of the reference method is summarized in Table 2. No significant differences were found for interob-server and intraobinterob-server variability (WMHV,P⬎.2; VV,P⬎
.08; ICV,P⬎.17; BTV,P⬎.06). From the same 10 subjects, the significant differences between the manual and the
auto-matic methods were confirmed for all brain volumes (WMHV,P⬍.01; VV,P⬍.01; ICV,P⫽.03; BTV,P⫽.04). The manual-automatic limits of agreement were larger than the intraobserver and interobserver limits of agreement, ex-cept in the case of the interobserver manual VV method (Table 2).
[image:3.594.134.455.145.349.2]The automatic algorithm automatically calculated the mean volumes in 127⫾9 seconds.
Table 1: Brain volumes using the manual and the automatic tool QBrain a
VVb(mL) BTVb(mL) ICVb(mL) WMHVb(mL)
M A M A M A M A
Mean⫾SD 75⫾60 81⫾64 1183⫾97 1172⫾96 1513⫾131 1465⫾124 13⫾16 10⫾14
Median 49 51 1178 1158 1503 1459 5 4
Range 14–257 17–272 953–1385 928–1409 1188–1854 1146–1783 0–74 0–68
aN⫽61. b
Statistically different between the mean manual and the mean automatic (P⬍.05).
Fig 2.Comparison between manual and automatic volumes.A1andB1, Plots of automatic versus manual for VV and ICV. The oblique dashed line represents the equality line.A2and
B2,The corresponding Bland-Altman plots for VV and ICV. The horizontal dashed lines are the confidence intervals of the difference between manual and automatic volumes.
Fig 3.Comparison between manual and automatic volumes.A1andB1,The plots of automatic versus manual for BTV and WMHV. The oblique dashed line represents the equality line.
[image:3.594.134.449.385.586.2]Discussion
In this study, a fully automatic commercially available soft-ware for the assessment of brain volumes was evaluated and found to be very fast and user-friendly. Automatic brain vol-umes correlated strongly to the manual brain volvol-umes. How-ever, there was a significant difference and variability between the automatic and reference methods. For ICV, BTV, and WMHV, the differences can be considered of clinically impor-tant magnitude; therefore, the automatic method requires improvement.
Ventricular Volume
Despite the excellent correlation (R⫽0.998) between auto-matic and manual VV, there was a systeauto-matic overestimation. Two main sources for the overestimation were observed.
First, the pixel-intensity threshold was systematically larger compared with the reference, causing an oversegmentation mainly localized at the lateral ventricles in all subjects (On-line supplemental Fig 3C). This may explain the significant corre-lation found between the means of automatic and manual VV and their differences (Fig 2A2). Second, the cisterna ambiens (which is the subarachnoid space between splenium of the corpus callosum and the superior aspect of cerebellum) con-tains difficult anatomic structures; VV was overestimated by the automatic tool (On-line supplemental Fig3F). Further-more, the automatic method did not recognize the cerebral aqueduct and the fourth ventricle as a part of the VV.
A recent study using a similar automatic software, Free-Surfer, found an excellent correlation (R⬎0.98) between au-tomatic and manual VV.14As in our study, the authors found
a significant difference in mean VV between the 2 methods, also with a systematic overestimation.
In this study, the agreement between repeated manual measurements with different observers was similar to the agreement between manual and automatic measurements (Table 2). If the threshold pixel intensity to assess VV auto-matically is adjusted, QBraincould be a reliable tool to assess
VV rapidly; thus, it could replace the traditional linear indices, such as the Evans index.1,17,18
Intracranial and Brain Tissue Volumes
A limitation of the automatic QBrainwas that it calculates only
the total brain tissue volume and does not differentiate the white matter and gray matter. In this study, we, therefore, reported only the results for total BTV.
Despite the high correlations between the automatic and manual protocols for ICV and BTV, there was a difference
between the mean manual volume and the mean automatic volume. The main source of misclassification was localized at the top and base of the cranial cavity. The uppermost 5 sec-tions were not perpendicular to the skull or brain parenchyma contour; this positioning increased the partial volume effects and thus complicated the automatic segmentation (On-line Figs1Cand2F). Miscalculations were also observed at the middle and posterior fossae (On-line Figs 1Fand 2C).
The results for QBrainwere similar to findings in the recent
evaluation of automatic FreeSurfer software,14which overes-timated ICV with a mean difference of 133 mL between the manual and the automatic methods. Another automatic soft-ware, SIENA (Oxford University; http://www.fmrib.ox.ac.uk/ analysis/research/siena/), revealed a difference of 46 mL be-tween the normalized mean manual BTV and the normalized mean automatic BTV.19
The automatic algorithm of QBrainis based on the SNIPER
tool,12which has been used in several clinical studies.20-22The capability of SNIPER to assess ICV and WMHV accurately has been validated in a previous study.12However, the mean
dif-ference between automatic and manual ICV found in our study was much larger than that in this previous study (⫹49 mL compared with their⫹3 mL).12A possible explanation
could be that the automatic QBrainsoftware has an
interscan-ner variability similar to that in the automatic SPM5 software (Wellcome Department of Imaging Neuroscience, London, UK). In a recent study, 1 healthy subject was scanned with 6 different MR imaging scanners. ICV and BTV were estimated automatically with SPM5 and ranged from 1408 to 1515 mL and 1224 to 1363 mL, respectively.23
Irrespective of the dependency on MR imaging scanners, the manual ICV and BTV variability showed that the limits of agreement between the 2 methods (manual and automatic) were at least 2-fold larger due to inter-/intraobserver variabil-ity (Table 2); further improvement of the automatic algorithm is necessary.
Automatic White Matter Hyperintensity Volume
In almost all subjects, the WMHV was underestimated by the automatic tool (Fig 3B1and On-line supplemental Fig 4). This finding is in agreement with the study using SNIPER.12The
[image:4.594.56.535.59.163.2]authors found a slightly smaller systematic underestimation (approximately 1 mL compared with our 2 mL). Their 95% confidence interval of the difference was smaller than ours ([⫺4 –5 mL] compared with ours [⫺6 –11 mL]). We found a significant correlation between the means of automatic and
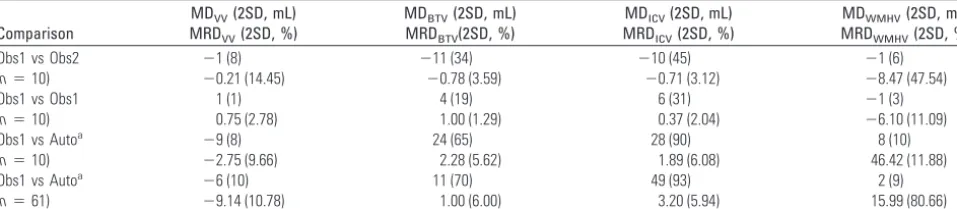
Table 2: Brain volume variability
Comparison
MDVV(2SD, mL) MRDVV(2SD, %)
MDBTV(2SD, mL) MRDBTV(2SD, %)
MDICV(2SD, mL) MRDICV(2SD, %)
MDWMHV(2SD, mL) MRDWMHV(2SD, %)
Obs1 vs Obs2 ⫺1 (8) ⫺11 (34) ⫺10 (45) ⫺1 (6)
(n⫽10) ⫺0.21 (14.45) ⫺0.78 (3.59) ⫺0.71 (3.12) ⫺8.47 (47.54)
Obs1 vs Obs1 1 (1) 4 (19) 6 (31) ⫺1 (3)
(n⫽10) 0.75 (2.78) 1.00 (1.29) 0.37 (2.04) ⫺6.10 (11.09)
Obs1 vs Autoa ⫺9 (8) 24 (65) 28 (90) 8 (10)
(n⫽10) ⫺2.75 (9.66) 2.28 (5.62) 1.89 (6.08) 46.42 (11.88)
Obs1 vs Autoa ⫺6 (10) 11 (70) 49 (93) 2 (9)
(n⫽61) ⫺9.14 (10.78) 1.00 (6.00) 3.20 (5.94) 15.99 (80.66)
a
manual WMHV and their differences as found in the evalua-tion study of SNIPER.12Interscanner variability could also be
a possible contributor to this discrepancy.
It is important also to discuss the manual segmentation protocols used to delineate the WMHV. We used FLAIR im-ages, whereas the previous study used T2 images.12We believe
FLAIR images should be used because they seem to have a higher specificity and accuracy compared with T2 images, es-pecially in the periventricular region.24,25
As to ICV and BTV, the limits of agreement between auto-matic and manual were larger compared with inter-/intraob-server limits of agreement.
Previous studies11,13have attempted to validate their auto-matic WMHV tool against visual scales. We believe this is not a robust means of validation because visual and volume scales have different properties.21,26
While manual segmentation is, for many reasons, still con-sidered a standard segmentation-validation method, objective approaches with realistic data for which the true volumes are known are needed for standardized method assessment. Thus, a previous study reported a comparison of different software packages by using simulated MR imaging, the data base Brain-Web (http://mouldy.bic.mni.mcgill.ca/brainweb).27,28In our
study, we have not used this approach because the BrainWeb data do not contain simulated FLAIR images. Without the FLAIR image sequence, the automatic calculation of brain vol-umes with QBrainsoftware was not possible.
Conclusions
According to our findings, similar automatic tools should un-dergo the same evaluation tests. It is important to validate the automatic tools because a number of clinical studies draw con-clusions about brain volumes estimated with software that has not yet been validated. The automatic algorithm of the soft-ware QBrainneeds improvement to be used by the
neuroradi-ology and neuroscience communities. However, manual seg-mentation is still the criterion standard, and QBrain
incorporates an excellent toolkit for this purpose.
References
1. Ambarki K, Israelsson H, Wahlin A, et al.Brain ventricular size in healthy elderly: comparison between Evans index and volume measurement. Neuro-surgery67:94 –99, discussion 99
2. Yoshita M, Fletcher E, Harvey D, et al.Extent and distribution of white matter hyperintensities in normal aging, MCI, and AD.Neurology2006;67:2192–98 3. Zhao GJ, Li DK, Wolinsky JS, et al.Clinical and magnetic resonance imaging
changes correlate in a clinical trial monitoring cyclosporine therapy for mul-tiple sclerosis: the MS Study Group.J Neuroimaging1997;7:1–7
4. Desikan RS, Cabral HJ, Fischl B, et al.Temporoparietal MR imaging measures of atrophy in subjects with mild cognitive impairment that predict subse-quent diagnosis of Alzheimer disease.AJNR Am J Neuroradiol2009;30:532–38 5. Fjell AM, Amlien IK, Westlye LT, et al.Mini-mental state examination is
sen-sitive to brain atrophy in Alzheimer’s disease.Dement Geriatr Cogn Disord
2009;28:252–58
6. Henneman WJ, Sluimer JD, Barnes J, et al.Hippocampal atrophy rates in Alz-heimer disease: added value over whole brain volume measures.Neurology
2009;72:999 –1007
7. Zeidman LA, Ankenbrandt WJ, Du H, et al.Growth rate of non-operated me-ningiomas.J Neurol2008;255:891–95
8. Condon B, Patterson J, Wyper D, et al.Use of magnetic resonance imaging to measure intracranial cerebrospinal fluid volume.Lancet1986;1:1355–57 9. Kohn MI, Tanna NK, Herman GT, et al.Analysis of brain and cerebrospinal
fluid volumes with MR imaging. Part I. Methods, reliability, and validation.
Radiology1991;178:115–22
10. Anbeek P, Vincken KL, van Osch MJ, et al.Automatic segmentation of differ-ent-sized white matter lesions by voxel probability estimation.Med Image Anal2004;8:205–15
11. Wen W, Sachdev P.The topography of white matter hyperintensities on brain MRI in healthy 60- to 64-year-old individuals.Neuroimage2004;22:144 –54 12. Admiraal-Behloul F, van den Heuvel DM, Olofsen H, et al.Fully automatic
segmentation of white matter hyperintensities in MR images of the elderly.
Neuroimage2005;28:607–17
13. Maillard P, Delcroix N, Crivello F, et al.An automated procedure for the as-sessment of white matter hyperintensities by multispectral (T1, T2, PD) MRI and an evaluation of its between-centre reproducibility based on two large community databases.Neuroradiology2008;50:31– 42
14. Lehmann M, Douiri A, Kim LG, et al.Atrophy patterns in Alzheimer’s disease and semantic dementia: a comparison of FreeSurfer and manual volumetric measurements.Neuroimage2010;49:2264 –74. Epub 2009 Oct 27
15. Relkin N, Marmarou A, Klinge P, et al.Diagnosing idiopathic normal-pressure hydrocephalus.Neurosurgery2005;57:S4 –16, discussion ii-v
16. Malm J, Eklund A.Idiopathic normal pressure hydrocephalus.Pract Neurol
2006;6:14 –27
17. Ambarki K, Israelsson H, Wåhlin A, et al.Brain ventricular size in healthy elderly: comparison between Evans index and volume measurement. Neuro-surgery2010;67:94 –99; discussion 99
18. Evans W.An encephalographic ratio for estimating ventricular enlargement and cerebral atrophy.Arch Neurol Psychiatry1942;47:931–37
19. Jasperse B, Valsasina P, Neacsu V, et al.Intercenter agreement of brain atrophy measurement in multiple sclerosis patients using manually-edited SIENA and SIENAX.J Magn Reson Imaging2007;26:881– 85
20. Palm WM, Walchenbach R, Bruinsma B, et al.Intracranial compartment vol-umes in normal pressure hydrocephalus: volumetric assessment versus out-come.AJNR Am J Neuroradiol2006;27:76 –79
21. van den Heuvel DM, ten Dam VH, de Craen AJ, et al.Measuring longitudinal white matter changes: comparison of a visual rating scale with a volumetric measurement.AJNR Am J Neuroradiol2006;27:875–78
22. Palm WM, Saczynski JS, van der Grond J, et al.Ventricular dilation: association with gait and cognition.Ann Neurol2009;66:485–93
23. Huppertz HJ, Kroll-Seger J, Kloppel S, et al.Intra- and interscanner variability of automated voxel-based volumetry based on a 3D probabilistic atlas of hu-man cerebral structures.Neuroimage2010;49:2216 –24. Epub 2009 Oct 28 24. Barkhof F, Scheltens P.Imaging of white matter lesions.Cerebrovasc Dis2002;
13(suppl 2):21–30
25. Piguet O, Ridley LJ, Grayson DA, et al.Comparing white matter lesions on T2 and FLAIR MRI in the Sydney Older Persons Study. Eur J Neurol
2005;12:399 – 402
26. van Straaten EC, Fazekas F, Rostrup E, et al.Impact of white matter hyperin-tensities scoring method on correlations with clinical data: the LADIS study.
Stroke2006;37:836 – 40. Epub 2006 Jan 26
27. Klauschen F, Goldman A, Barra V, et al.Evaluation of automated brain MR image segmentation and volumetry methods. Hum Brain Mapp
2009;30:1310 –27