http://www.scirp.org/journal/jmp ISSN Online: 2153-120X
ISSN Print: 2153-1196
DOI: 10.4236/jmp.2017.814133 Dec. 20, 2017 2179 Journal of Modern Physics
Galactic Structure and Holography
T. R. Mongan
84 Marin Avenue, Sausalito, CA, USA
Abstract
Galactic structure, involving bulk motion of matter conserving mass and an-gular momentum, is analyzed in a holographic large scale structure model. In isolated galaxies, baryonic matter inhabits dark matter halos with holographic radii determined by total galactic mass. The existence of bulgeless giant spiral galaxies challenges previous models of galaxy formation. In sharp contrast, holographic analysis is consistent with the finding that 15% of a sample of 15,000 edge-on disk galaxies in the sixth SDSS data release are bulgeless. Ho-lographic analysis also indicates that E7 ellipticals are less than 2% of elliptical galaxies.
Keywords
Galactic Structure, Holography
1. Introduction
This paper does not address the wide range of processes, mechanisms, and mer-gers generating galactic structures and leading to the myriad galaxy types ob-served by astronomers. Instead, it identifies the range of isolated galactic struc-tures consistent with conservation of mass and angular momentum in a holo-graphic large scale structure (HLSS) model [1].
Current observations indicate that our universe can be approximated as a closed vacuum-dominated Friedmann universe. Futhermore, “the universe is dominated by an exotic nonbaryonic form of matter largely draped around the galaxies. It approximates an initially low pressure gas of particles that interact only with gravity…” [2]. The holographic principle [3] applied in a vacuum-dominated universe led to an approximate large scale structure model [1] where isolated structures with total mass Mg inhabit spherical holographic screens with
radius 0.183 g cm2
g
M
S= if the Hubble constant H0 67.8 km sec 1 Mpc 1
− −
= ⋅ ⋅ .
How to cite this paper: Mongan, T.R. (2017) Galactic Structure and Holography. Journal of Modern Physics, 8, 2179-2188.
https://doi.org/10.4236/jmp.2017.814133
Received: November 18, 2017 Accepted: December 17, 2017 Published: December 20, 2017
Copyright © 2017 by author and Scientific Research Publishing Inc. This work is licensed under the Creative Commons Attribution International License (CC BY 4.0).
DOI: 10.4236/jmp.2017.814133 2180 Journal of Modern Physics The HLSS model considers galactic matter density distributions
( )
4π 2g
M r
Sr
ρ = ,
where r is distance from the galactic center. Then, mass within radius R is
(
R S M)
g, and tangential velocity of stars or star clusters in circular orbits withinthe 1r2 density distribution around the galactic center is Mg
V G
S
= , where
8 3 1 2
6.67 10 cm g sec
G= × − ⋅ − ⋅ − .
This analysis treats galaxies as spherical halos of dark matter with radius S and density distribution
( ) (
)
21 4π
g M r
Sr
α
ρ = − surrounding total baryonic mass
bary g
M =αM . Cosmological data indicate matter fraction of total energy density of the universe is ≈0.31 and baryonic fraction of total energy desity is ≈0.05,
so baryonic fraction of matter is α ≈0.05 0.31 0.16= and dark matter fraction
is α − =1 0.84. The analysis uses α =0.16, but a distribution of values
centered around α =0.16 could be used to assess galactic systems formed in
parts of the universe with slightly higher or lower ratio of baryons to dark matter. This paper considers galactic structures at redshift z=0, but the
analysis is readily extended to z>0 using results in Ref. [1].
2. Black Holes in the Galactic Core
There is no singularity in galactic matter density distribution
( )
4π 2g
M r
Sr
ρ =
because mass inside a core radius C at the galactic center is concentrated in a central black hole with mass CBH g
C
M M
S
= , where C is the holographic radius
of star clusters that can inhabit circular orbits just outside the core without being disrupted and drawn into the central black hole [1]. The mass MSt comprising
the dark matter halo with mass MH plus baryonic matter with mass Mbary is
0.84 0.16
St g CBH H bary St St
M =M −M =M +M = M + M .
Total angular momentum of a galaxy is estimated using the moment of inertia 2
2 9
g g
I = M S of a rotating sphere with galactic holographic radius S and density
( )
24π
g
M r
Sr
ρ = . From the holographic relation 2
0.183 g
M = S , total angular
momentum of the galaxy is
2 2
9 0.183
g
g g
M J = ω
, where
ω
g is galactic angular velocity. Galactic angular velocityω
g is estimated by considering a mass mfixed on the rotating holographic screen at radius S. Radial acceleration 2
g
a= −ω S of that mass results from gravitational force F GmM2 g S
= − attracting
it to the centroid of the structure. Then, (correcting a misprint in Ref. [1])
(
)
32 2 2
3 0.183g cm
g g
GM G
S M
ω = = and
(
)
0.5
2 0.25
2 9 0.183
g g
g G
J M
M
DOI: 10.4236/jmp.2017.814133 2181 Journal of Modern Physics model [1], average galactic mass at z=0 is 8.3 10× 43g and average galactic
angular momentum is 16 2
9 10
g g
J = × − M , 15% higher than Paul Wesson’s [4]
empirical value 16 2
8 10
g g
J = × − M .
Central black hole angular momentum JCBHmax cannot exceed maximum Kerr black hole angular momentum
2
2 2
max
CBH KCBH g
G G C
J M M
c c S
= ± = ±
,
and
(
)
2 0.5
0.25 2
9 0.183
CBH
g g
J G C G
c S
J M
≤ ±
. In the HLSS model at z=0,
galactic mass ranges from 39 4 10 g
≈ × to 45
10 g
≈ and C 1
S ≤
. So
max
CBH g
J J ranges from 4
2 10−
≈ × to 3
5 10−
≈ × , and central black hole
angular momentum is negligible. Core radius C equals the holographic radius of star cluster sub-elements of the galaxy that can inhabit circular orbits around the galactic center without being disrupted by the central black hole. Maximum HLSS star cluster mass is 39
4.64 10× g, so Cmax=0.052 kpc, and minimum star cluster mass is 34
2.11 10× g, so Cmin =0.00011 kpc.
3. Spiral Galaxies
Spiral galaxies predominate in underdense regions of the universe. This analysis treats baryonic matter in isolated spiral galaxies as disk structures with constant
tangential velocity Mg
V G
S
= surrounding a central sphere with constant
density.
4. Conservation of Mass and Angular Momentum
Baryonic matter outside core radius C around the central black hole consists of a bulge, with mass MB in a hollow sphere with inner radius C and outer radius
B, and a disk with mass MDS. So Mbary =0.16
(
Mg−MCBH)
=MB+MDS. Totalmass within B and outside the core in the 1r2 density distribution around the galactic center is
(
)
MgB C S
− and tangential velocity at B is
g B
B
M M
V G V G
B S
= = = . If MB, the baryonic part of total mass within B, is
in a hollow sphere with inner radius C and outer radius B,
(
)
0.16 g
B
M
M B C
S
= − (1)
Conservation of mass then requires a disk mass
(
)
0.16 g 0.16 1
DS g CBH g
M B
M M M B C M
S S
= − − − = −
(2)
Angular momentum conservation in spiral galaxies requires
g CBH H B DS
DOI: 10.4236/jmp.2017.814133 2182 Journal of Modern Physics respectively the angular moment of the central black hole (JCBH), the dark
matter halo ( JH ), the central bulge ( JB ), and the disk ( JDS ). Since
3
5 10
CBH g
J ≤ × − J ,
g H B DS
J ≈J +J +J (3)
A hollow sphere with density
( )
2 4πg
M r
Sr
β
ρ = , inner radius C, and outer radius
R has moment of inertia 2 3 3 9 g
R C
M
R C
β −
−
, so angular momentum Jbary of galactic baryonic matter comprising the bulge and disk with mass
bary B DS
M =M +M is
(
)
3 32 0.84 9
bary B DS g g g
S C
J J J J M
S C ω
−
= + = −
−
(4)
5. Bulge Radius and Disk Thickness
If the hollow sphere of baryonic matter constituting the bulge has constant
density
(
)
4(
3 3)
0.16 π
3 g B
M
B C B C
S
ρ = − −
, tangential velocity of baryonic
matter in the bulge rises from C C
V V
B
= at core radius C to V at B. The hollow
sphere of the bulge with constant density ρB has moment of inertia
(
)
(
)
5 5
3 3
2
5 B
B C
M
B C
−
− . To approximate observed velocity curves, angular velocity of
the constant density bulge is found by setting tangential velocity at the edge of the bulge VB =ωBB equal to disk tangential velocity V, so B
V B
ω =
and
(
)
(
)
5 5
3 3
2
. 5
B B
B C
V
J M
B B C
−
=
−
(5)
From Equation (4), disk angular momentum is
(
)
3 3 53 532 2
0.84 .
9 5
DS g g B
S C V B C V
J J M M
S C S B C B
− −
= − −
− −
(6)
Maximum bulge radius Bmax occurs when there is no disk and all baryonic mass is bulge mass. From Jg−JH=JBmax, using SC and Bmax >C,
(
)
(
)
max2 2
0.16 0.16
9 M SVg ≈5 M Bg V and max
5
0.56 9
B ≈ S= S.
Next, consider a disk extending from R=B to R=S with density
(
)
2 ( )0 , 4 sech e
R B K B
z R z
z
ρ = ρ − −
, approximating an isothermal disk with constant scale height z0. Setting scale height z0=H 8, the integral
( )
22
0 0
0 0
2 4sech d 8 tanh tanh 4 0.9993 2
H z H
z z H H
z z
= = =
DOI: 10.4236/jmp.2017.814133 2183 Journal of Modern Physics height H encompassing 99.9% of disk matter, disk mass is approximately
( )
(
) (
)
( )2π e d 2π e
R B S B
S
K K
DS B B B
M Hρ R R Hρ K K B K S
− − − − = = + − +
∫
and disk angular momentum is approximately ( )
(
) (
)
( )2
2 2 2 2
2π e d
2π 2 2 2 2 e
R B S
K
DS B B
S B K B
J H V R R
H KV K KB B K KS S
ρ ρ − − − − = = + + − + +
∫
For B= f SB ,
(
) (
)
( )(
) (
)
( )1
1
2 2 2 2 2
e
2 2 2 2 e
B B S f K B DS S f Ds K B B
K f S K S
VM
J
K Kf S f S K KS S
− − − − + − + = + + − + +
Setting radial scale length K=xS, the following equation can be solved for x
by trial and error
(
) (
)
( )(
) (
)
( )1
1
2 2 2
1 e
2 2 2 2 1 e
B B f x B DS f Ds x B B
x f x
SVM
J
x xf f x x
− − − − + − + = + + − + +
Given x, H 2B is found from
(
)
(
) (
)
(1 )2
2
2
2π 1 e
B DS f x B B M B H B
S x x f x
ρ − −
= + − +
If sufficient data are available, the model can be extended to consider situations where different stellar populations are in sub-disks with different radial scale lengths and scale heights This is relevant because analysis of the Milky Way [5] found different star populations in sub-disks with scale height inversely related to sub-disk radial scale lengths.
6. Percentage of Bulgeless Spiral Galaxies
Kormendy et al. [6] note that bulgeless galaxies with V>150 km sec
(
44)
2 10 g
g
M > × “challenge our picture of galaxy formation by hierarchical clustering.” In this analysis, spiral galaxies with mass Mg have bulge radii
between C and Bmax. If bulge radius *
B approximates the demarcation
between spirals with and without a bulge, * max
B C
B C
−
− is the bulgeless fraction of
spiral galaxy configurations consistent with mass and angular momentum conservation. Estimating *
B from * 1 2
H
DOI: 10.4236/jmp.2017.814133 2184 Journal of Modern Physics ranging from 44
1 10× g (with V=169 km sec) to 45
1 10× g (with
300 km sec
V = ) are bulgeless. With scale height z0=H 8, the integral
( )
2 4
0 0
0 0
2 4sech d 8 tanh tanh 2 0.964 4
H z H
z z H H
z z
= = =
∫
, so a central subdiskof height H/2 contains 96.4% of disk mass. Estimating *
B from H/2 = 2B*, 19% to 23% of galaxies with masses between 44
1 10× g and 1 10× 45g are bulgeless. These estimates bracket the 15% estimate of bulgeless galaxies found among 15,127 edge-on disk galaxies in the sixth release of SDSS data [7]. So, holographic analysis has no difficulty accounting for bulgeless giant spiral galaxies.
7. MOND Is Unnecessary
Dark matter can account for flat velocity curves in spiral galaxies, and observations of the colliding “bullet cluster” galaxies 1E0657-558 provide further evidence for dark matter. To avoid using dark matter to account for flat velocity curves, Modified Newtonian Dynamics (MOND) assumes the law of gravity is different at large distances. Ref. [8] cites the baryonic Tully-Fisher relation and mass discrepancy-acceleration (or Vobserved VNewtonian) relation as “challenges for the ΛCDM model,” and accounts for those relations using MOND with an
acceleration threshold 8 2
0 1.2 10 cm sec
a ≈ × − . However, the HLSS model [1]
within the ΛCDM paradigm readily accounts for the MOND acceleration threshold, baryonic Tully-Fisher relation, and mass discrepancy-acceleration (Vobserved VNewtonian ) relation. First, radial acceleration at holographic radius S is
(
2)
8 2
2 2
0.183
0.183 1.2 10 cm sec
g S
G S
GM
a G
S S
−
= = = = × , equal to MOND
acceleration. Second, radial acceleration at radius R due to dark matter is
2
DM DM
G R
a M
S R
=
and at R sufficiently distant from the galactic center that total baryonic mass of the galaxy MB =0.16Mg can be treated as concentrated
at the galactic center, Newtonian radial acceleration from baryonic matter is
2
B B
GM a
R
= . Radius Rγ where aDM =aB is found from
2 2
B DM
R GM
G
M S
R R
γ
γ γ
=
. Since MDM =0.84Mg, Rγ =0.19S, and at that radius
8 2
5.4 10 cm sec
DM B
a =a = × − , near the MOND estimate. Third, tangential velocity V at R relates to radial acceleration ar by
2
r
V =Ra . So,
(
)
2 observed
Newtonian
DM B
B
R a a
V
V Ra
+
≈
, and
observed
Newtonian
1 DM 1 DM
B B
V a RM
V = + a = + SM . When
0.19
R S, observed
Newtonian
1 V
V ≈ . Using
2 0
0.19
DM
B B
a M R
a M S
=
,
0 0.19 B
DM B
a M R
S = M a
and observed 0
Newtonian
0.19
1 DM 1 DM
B B B
V RM M a
V = + SM = + M a . When aB a0,
0
DOI: 10.4236/jmp.2017.814133 2185 Journal of Modern Physics and
1 4
observed 0
Newtonian
1 0.998 o
B B
V a a
V a a
= + ≈
. So, when aBa0,
4 observed 0
Newtonian B
V a
V a
=
and using 2
B B
GM a
R
= and Newtonian GM2B V
R
= ,
2 2
4
observed 2 0 0
B
B B
GM R
V a GM a
GM R
= =
, known as the baryonic Tully-Fisher
relation. Fourth, if 1 1
0 67.8 km sec Mpc
H = ⋅ − ⋅ − , the cosmological constant
56 2 1.12 10− cm−
Λ = × , and accelerations 8 2
0 6.6 10 cm sec
cH = × − and
2 8 2
5.5 10 cm sec
3
c Λ = × − are consistent with the acceleration
8 2
5.4 10 cm sec
DM B
a =a = × − . So, the MOND hypothesis is unnecessary.
8. Elliptical Galaxies
Elliptical galaxies predominate in overdense regions of the universe, and may result from mergers and collisions of progenitor galaxies. Baryonic matter interacts more strongly than dark matter, so collisions between galaxies can produce torques transferring angular momentum from baryonic matter to the composite halo, yielding baryonic ellipsoids with angular velocity less than the angular velocity of the halo and the galaxy as a whole.
This analysis treats elliptical galaxies as constant density ellipsoids within a surrounding spherical isothermal dark matter halo. Dynamical instability of thin galaxies (the firehose instability) limits long axes of ellipsoids to about three times the length of short axes. So elliptical galaxies in this model range from oblate spheroids with radius A along the spin axis equal to one third the radius
R⊥ perpendicular to the spin axis to prolate spheroids with radius A along the spin axis equal to three times the radius R⊥ perpendicular to the spin axis.
In the holographic approach, galaxies are arrangements of bits of information identifying the location of matter in the galaxy. There is no reason for one arrangement of information satisfying conservation of mass and angular momentum to be preferred over another. So, different configurations satisfying conservation of mass and angular momentum with the same total mass should be equally likely.
Baryonic ellipsoids outside the core radius C surrounding the central black hole have baryonic mass ME =0.16
(
Mg−MCBH)
and, since SC andR⊥C, the moment of inertia around the spin axis
2
2 5
E E
I ≈ M R⊥. Prolate and
oblate spheroidal ellipsoids are analyzed as deformed versions of spheres with radius
3 o
S
R = , so the spheroids fit within the holographic screen. Prolate and
oblate spheroids with radius ARo along the spin axis have the same mass and
angular momentum as spheres with radius R=Ro. For prolate spheroids
capable of avoiding firehose instability, radius along the spin axis ranges from
o
DOI: 10.4236/jmp.2017.814133 2186 Journal of Modern Physics from Ro 3 to Ro,
1 1 3
A
= →
. Ellipsoid angular velocity depends on how much baryonic angular momentum was transferred to the halo during elliptical galaxy formation.
Hubble class of prolate spheroidal elliptical galaxies with major axes A varying from Ro to 3Ro and minor axis B=Ro is 10 1
B E
A
= −
rounded to the nearest integer, so limits imposed by firehose instability only allow prolate spheroidal elliptical galaxies of Hubble class E0 to E7. We only see projections of ellipsoids on the plane perpendicular to our line of sight, so actual Hubble class
AEi of an elliptical galaxy and its projected (observed) Hubble class Ei are not the same. Prolate elliptical galaxies rotate around their major axis and oblate elliptical galaxies rotate around their minor axis, so results hold for oblate galaxies when 1 A is replaced by A, and the projection effect can be
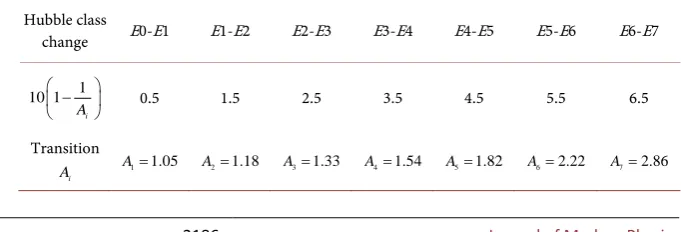
understood by considering only prolate spheroids. Table 1 shows A Ri o major
axis lengths marking transitions between Hubble classes for prolate spheroids, where Ai is A projected on the plane perpendicular to the line of sight.
When the angle between rotation axis of prolate elliptical galaxies and the line of sight decreases from 90˚ to 0˚, the projection P
( )
θ =Asinθ on the plane perpendicular to the line of sight of the actual A along the axis of rotation gets smaller, so projected shape of the galaxy gets rounder and higher actual Hubble classes appear as lower projected Hubble classes as the axis of rotation gets closer to the line of sight. Hubble class distribution of prolate spheroid shapes projected on the plane perpendicular to the line of sight is found by integrating from A=1 to A=3 and from θ =0 to π2
θ = . As above, this analysis
assumes information (matter), in prolate elliptical galaxies capable of avoiding firehose instability with a given mass and angular momentum and corresponding radius Ro perpendicular to the rotation axis, is evenly distributed among
prolate spheroids with radius a=ARo along the spin axis ranging from Ro to 3Ro
(
A= →1 3)
. Total occupancy of prolate elliptical galaxies with given massand angular momentum is 8=3 =1 0
1
= 1 2
A
A dA
∫
. The interval AE0 from A0 to A1 contributes 101
1
d 0.026
2 A A= A=
[image:8.595.197.538.629.745.2]∫
to projected Hubble class E0. The interval AE1Table 1. Major axis lengths Ai marking transitions between Hubble classes for prolate
spheroids.
Hubble class
change E0-E1 E1-E2 E2-E3 E3-E4 E4-E5 E5-E6 E6-E7
1 10 1
i
A
−
0.5 1.5 2.5 3.5 4.5 5.5 6.5
Transition
i
DOI: 10.4236/jmp.2017.814133 2187 Journal of Modern Physics
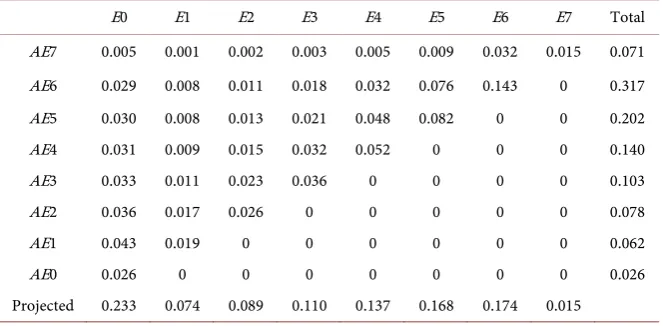
Table 2. Projected Hubble class Ei of elliptical galaxies versus actual Hubble class AEi of elliptical galaxies.
E0 E1 E2 E3 E4 E5 E6 E7 Total
AE7 0.005 0.001 0.002 0.003 0.005 0.009 0.032 0.015 0.071 AE6 0.029 0.008 0.011 0.018 0.032 0.076 0.143 0 0.317 AE5 0.030 0.008 0.013 0.021 0.048 0.082 0 0 0.202 AE4 0.031 0.009 0.015 0.032 0.052 0 0 0 0.140
AE3 0.033 0.011 0.023 0.036 0 0 0 0 0.103
AE2 0.036 0.017 0.026 0 0 0 0 0 0.078
AE1 0.043 0.019 0 0 0 0 0 0 0.062
AE0 0.026 0 0 0 0 0 0 0 0.026
Projected 0.233 0.074 0.089 0.110 0.137 0.168 0.174 0.015
from A1 to A2 contributes 2
1
1
d 0.062
2 A
A A=
∫
to projected Hubble classes E0 and E1, broken down as 2 1( ) ( )1 1
π 2 0
1
d sin d sin d
2
A A
A A A
θ
θ
θ θ θ θ
+
∫
∫
∫
where( )
1sin i
i
A A
A
θ = −
, the first term in the integral contributes to projected Hubble
class E0, and the second term contributes to projected Hubble class E1. Similarly, the interval AEi from Ai to A1 1+ contributes to all projected Hubble classes from E0 to Ei, broken down as
( )
( ) ( )
( )
1 1 1 1 π 2
0
1
d sin d sin d sin d
2
i j
i j i
A A i A
j i
A A A A
θ θ
θ θ
θ θ
θ θ
θ θ
+ − +
=
+ +
∑
∫
∫
∫
∫
where the first termcontributes to projected Hubble class E0, the last term contributes to projected Hubble class Ei, and intervening terms contribute to projected Hubble classes from E1 to E i
(
−1)
. Use ( )1( )sin d(
cos( )
cos 1( )
)
j J
A
j j
A A A
θ
θ
θ θ
θ
θ
+
+
= −
∫
and2 1
cos sin Aj 1 Aj
A A
−
= −
to get
( )
( )
(
)
1 2 2 2 2
1
1 d sin
j j
A
j j
A A A A A A
θ
θ θ θ
+
+
= − − −
∫
, and2 2 2 2 1
2 2
1
dA A A tan
A A
ξ
ξ
ξ
ξ
ξ
−
− = − +
−
∫
. This results in Table 2,listing fractional distribution of projected Hubble class of elliptical galaxies. The result suggests Hubble class E7 galaxies comprise < 2% of elliptical galaxies.
References
[1] Mongan, T.R. (2013) Journal of Modern Physics, 4, 50-54.
https://doi.org/10.4236/jmp.2013.47A1006
[2] Peebles, P.J.E. (2017) How the Nonbaryonic Dark Matter Theory Grew. Princeton University, Princeton.
DOI: 10.4236/jmp.2017.814133 2188 Journal of Modern Physics
https://doi.org/10.1103/RevModPhys.74.825
[4] Wesson, P. (1981) Physical Review D, 23, 1730.
https://doi.org/10.1103/PhysRevD.23.1730
[5] Bovy, J., et al. (2012) The Astrophysical Journal, 753, 148. [6] Kormendy, J., et al. (2010) The Astrophysical Journal, 723, 54. [7] Kautsch, S.J. (2009) Astronomische Nachrichten, 330, 100-106.