Effectiveness and cost-effectiveness of a brief school-based group programme for
parents of children at risk of ADHD: a cluster randomised controlled trial
Kapil Sayal,1,2,3John A Taylor,1,2Althea Valentine,1,2Boliang Guo,1,2Chris J Sampson,1,2 Edward Sellman,4Marilyn James,1,2Chris Hollis,1,2,3 & David Daley1,2,3
1
School of Medicine, University of Nottingham; 2CLAHRC-NDL; 3CANDAL (Centre for ADHD and Neuro-developmental Disorders across the Lifespan), Institute of Mental Health, Nottingham;
4
School of Education, University of Nottingham
Correspondence:
Kapil Sayal (MRCPsych, PhD)
School of Medicine, University of Nottingham E Floor, South Block,
Queen's Medical Centre Nottingham, NG7 2UH, UK
Email:[email protected]
Tel:+44 1158230264 Fax:+44 1158230270
Short Title: School-based group programme for ADHD
Keywords: ADHD, hyperactivity, inattention, parent programme, teacher intervention, RCT, cost-effectiveness
ABSTRACT
Background
NICE guidelines recommend a stepped care approach for the identification and management of children with, or at risk of, Attention-Deficit / Hyperactivity Disorder (ADHD). We investigated the effectiveness, cost-effectiveness and acceptability of a group parenting intervention programme (+/-a te(+/-acher session) for children (+/-at risk of ADHD.
Methods
In a three-arm cluster RCT, 12 primary schools were randomly assigned to control, parent-only, and combined (parent + teacher) intervention arms. Eligible children had high levels of parent-rated hyperactivity/inattention (n=199). At six month follow-up, the primary outcome measure was the parent-completed Conners’ Rating Scale – Revised (ADHD Index). Secondary outcomes included the Conners’ sub-scales (hyperactivity, cognitive problems/inattention, oppositional behaviour), the teacher-completed Conners’ Rating Scale – Revised, child health-related quality of life, parental burden and parental mental health. The cost-effectiveness analyses reflected a health and personal social services perspective. Trial Registration:ISRCTN87634685.
Results
Follow-up data were obtained from 76 parents and 169 teachers. There was no effect of the parent-only (mean difference = -1.1, 95% CI -5.1,2.9; p=0.57) or combined interventions (mean difference = -2.1, 95% CI -6.4,2.1; p=0.31) on the ADHD Index. The combined intervention was associated with reduced parent-reported hyperactivity symptoms (mean difference = -5.3; 95% CI -10.5,-0.01; p=0.05) and the parentonly intervention with improved parental mental health (mean difference = -1.9; 95% CI -3.2,-0.5; p=0.009). The incremental costs of the parent-only and the combined interventions were £73 and £123 respectively. Above a willingness to pay of £31 per 1-point improvement in the ADHD index, the parent-only programme had the highest probability of cost-effectiveness. Participants found the interventions acceptable.
Conclusions
Abbreviations:
INTRODUCTION
Attention Deficit/Hyperactivity Disorder (ADHD) affects 3-5% of school-aged children (National Institute for Health and Clinical Excellence 2008). It is often comorbid with other mental health disorders and is associated with impaired peer and family relationships, functioning at school and quality of life (Danckaerts et al. 2010; Tarveret al. 2014). Longer-term adverse outcomes include poor educational achievement, conduct problems, substance misuse, employment difficulties and criminality (Shaw et al. 2012). It also impacts on parental mental health and is associated with considerable costs to family and society (Doshi et al. 2012). High levels of inattention, hyperactivity and impulsiveness, even if these do not meet full diagnostic criteria for ADHD, are also associated with these outcomes (Taylor et al. 1996; Washbrook et al. 2013). Hence, the early recognition of and provision of interventions for children at risk of ADHD may reduce current difficulties and enhance long-term outcomes.
In the UK, clinical practice guidelines suggest a stepped care pathway for children with, or at risk of, ADHD (National Institute for Health and Clinical Excellence 2008). Ideally, services should be available and accessible at the most appropriate level and setting. These guidelines recommend offering group parent-training/education interventions, at a pre-diagnosis stage, in relation to children with ADHD-type difficulties. Such approaches may be enough to improve outcomes for some children with high levels of these difficulties. Improving access to care is important because, even amongst children who meet diagnostic criteria for ADHD, only half access specialist healthcare services (Sayalet al.2010a).
relation to a community sample of children with high levels of hyperactivity/inattention, this feasibility study aims to:
1) evaluate the effectiveness and cost-effectiveness of a brief school-based programme for parents (with or without a session for teachers).
2) assess the acceptability of the programme and of sharing information about behavioural strategies with teachers.
METHODS
The study design was a three arm cluster randomised controlled trial (the PArents, Teachers and CHildren WORKing together (PATCHWORK) study), with school as the unit of allocation and individual children as the unit of analysis (using measures completed by participating parents and teachers). Further details are given in the trial protocol (Sayal et al. 2012). Eligible schools were large, mixed-sex primary schools across three counties of the East Midlands, UK (Nottinghamshire, Derbyshire and Lincolnshire), incorporating a range of socio-economic status. Participation required informed consent from the head teachers and parents. Ethical approval for the study was obtained from the University of Nottingham Medical School Ethics Committee. Trial Registration: ISRCTN87634685.
All parents of children, aged 4-8 years, in Reception Year (kindergarten) to Year 3 classes were asked to complete the Strengths and Difficulties Questionnaire (SDQ) (Goodman 1999). The SDQ is a widely used measure of childhood mental health and includes four sub-scales relating to emotional problems, conduct problems, hyperactivity/inattention, and peer relationships, with higher scores (scale of 0-10) indicating greater levels of severity. These are summed to provide a total difficulties score (0-40). It also informs about functional impairment (0-10) and burden for the
family (0-3). Parents who rated their child as ≥6 on the hyperactivity/inattention domain (cut-off for
top 20% in the population; Goodman 1999) were eligible to be invited to participate in the main trial.
Sample size justification
each group. On the basis of a large effect size (0.8) between any two groups and clustering with ICC of 0.05 at the school level, the sample size calculation for a power of 80% and significance level of 0.05 indicated that the parents of approximately 150 children needed to participate in this study. On the basis of a minimum of 12 participating schools with average class sizes of 30 children and two classes per year, we estimated that parents of 240 children in each school would be invited to complete screening questionnaires. With an anticipated response rate of 50% and a cut-off set to pick up the highest scoring 20%, we expected to identify 24 high-scoring children per school.
Randomisation
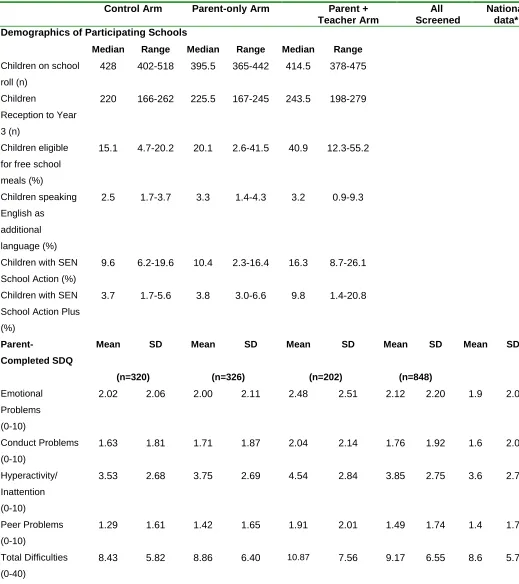
Twelve schools were recruited and randomised on a 1:1:1 ratio by the Clinical Trials Unit at the University of Nottingham using a block randomisation procedure. Demographics of participating schools are given in Table 1.
Table 1 about here
Interventions
The main aim of the trial was to determine the effectiveness and cost-effectiveness of a brief
intervention for parents (+/- teachers) of children at risk of ADHD (i.e. scoring ≥6 for
hyperactivity/inattention on the SDQ). Interventions were either delivered at participating schools or alternative local venues.
‘Parent-only’ intervention
As part of the development of the study, a regional mapping survey
This intervention was based around the strategies of the ‘1-2-3 Magic’ parenting programme (Phelan 2010) with minor modifications to make it more suitable for UK parents of children aged 4-8 years. The programme was delivered to groups of parents in three two-hour sessions over consecutive weeks. Actual group sizes ranged from 1-7 parents. The first session focused on strategies to encourage good behaviour (e.g. positive reinforcement, charting, natural consequences); the second session introduced the management of difficult behaviours using a simple counting technique without talking or emotion, time out and loss of privileges; and the third session outlined different ways in which the parent could strengthen their relationship with their child (e.g. boosting self-esteem, not over-parenting, active listening). Each parent programme was run by a group leader and facilitator, who were members of the research team who had either received training in ‘1-2-3 Magic’ from ADDISS or locally from a licensed practitioner. All received a copy of the ‘1-2-3 Magic’ book and DVDs.
‘Combined' (parent and teacher) intervention
This intervention comprised the parent-only intervention plus an additional 1.5 hour group session which was delivered by the research team to Reception Year to Year 3 teachers. This outlined the utility of ‘1-2-3 Magic’ in the home and classroom, the understanding of children’s needs and possible causes and functions of their behaviour, and encouraged teachers to reflect on their current practice. During the period of delivery of the parenting programme, these teachers also received weekly updates through information sheets summarising the content of each ‘1-2-3 Magic’ session.
No Intervention Control
Schools randomised to this arm were not offered either intervention until final outcome measures were collected at six months follow-up.
Outcome measures
outcome measure was the parent-rated ADHD Index at six month follow-up. Secondary outcomes included scores on the other parent-rated sub-scales and all the teacher-rated sub-scales of the Conners’ Rating Scale – Revised. As described in the trial protocol (Sayal et al. 2012), we anticipated that there would be a greater reduction in ADHD symptoms in children whose parents and/or teachers received the intervention compared to children in the no intervention (control) arm. Other secondary outcome measures assessed changes in parental burden (using the SDQ) and parental mental health using the Malaise Inventory (Rodgers et al. 1999). The reliability and validity of the Malaise Inventory have been demonstrated in two general population samples (n>11,000) - the population mean score is 2-3 and a cut-off point score of 6 or above has good sensitivity and specificity for depression (Rodgerset al.1999).
We collected proxy versions of two measures of health-related quality of life (HRQoL) – the EQ-5D-Y (Willeet al. 2010) and the CHU9D (Stevens 2009) – from parents at baseline and three and six month follow-up to enable the calculation of quality-adjusted life years (QALYs). The
self-completed EQ-5D-Y has been validated in children aged ≥8 years (Ravens-Sieberer et al. 2010). However, because this trial included younger children, we used a proxy version of the questionnaire in which we replaced each instance of “your” with “your child’s”; “I have” with “my child has”; and “myself” with “herself/himself”. Similar to the EQ-5D-Y, the CHU9D is a descriptive system for HRQoL and its reliability and validity for young children has been established (Canaway & Frew 2013). Societal utility values were attached to EQ-5D-Y (MVH Group 1995) and CHU9D (Stevens 2012) responses to calculate QALYs.
At baseline, three month and six month follow-up, an adapted version of the Client Service Receipt Inventory (CSRI) (Beecham & Knapp 2001) was administered to parents as a telephone interview. This version was adapted for use for children with ADHD-type problems (Sayal et al. 2003) and collects information on all the services and supports used by the child and enables support and family-borne costs to be estimated.
Statistical analysis
The analyses were conducted on an intention-to-treat (ITT) basis. Descriptive background statistics were initially performed. A three level intercept only model with school as level 3 unit, child as level 2 unit and repeated time as level 1 unit was conducted to investigate the school level variability for each outcome (Goldstein 2011). Treatment effects on each outcome score of change from baseline measure were quantified using this three level multilevel regression modelling with baseline measure, treatment status, time, interaction between time and treatment modelled as covariates. Missing value patterns were investigated with results showing that missingness was not associated with intervention status and baseline measures. All missingness was imputed under missing at random (MAR) assumption and ten imputed datasets were generated. When imputing missingness, school level variance had to be fixed to achieve model convergence. To assess the robustness of results sensitive to missing values (Carpenter & Kenward 2013, White et al. 2011), the multilevel modelling was also performed using observed data. Stata 14 and REALCOM were used to analyse data and impute missingness (Carpenteret al.2011).
Cost-effectiveness analyses
The resources involved in administering the interventions, including training, staff time, overheads and consumables, were recorded. This enabled an intervention cost to be calculated. Information on service use, time off work and personal costs were recorded using the CSRI. At each time point, participants were asked to report on resource use over the previous three months. National Health Service (NHS) staff earnings estimates (Department of Health 2012) and the Unit Costs of Health & Social Care 2012 (Curtis 2012) were used to attach cost estimates to service use at 2012 prices. Costs of productivity losses were estimated using the Annual Survey of Hours and Earnings (Office of National Statistics 2013).
Bootstrapping was used to estimate confidence intervals for incremental cost-effectiveness ratios, with individual-level resampling (Briggs et al. 1997). The net benefit approach (Tambour et al. 2009) was used to estimate the probability of cost-effectiveness at various willingness to pay thresholds, and cost-effectiveness acceptability curves (CEACs) were generated. All analyses were carried out using Stata 12. Using the methods described above, we additionally carried out secondary analyses adopting a societal cost perspective and using three secondary outcome measures: teacher Conners’ ADHD Index, EQ-5D-Y and CHU9D. QALYs were calculated using the area under the curve approach with linear interpolation, and baseline differences were controlled for by estimating incremental effects as changes from baseline.
RESULTS
Sample Characteristics and Participant Flow
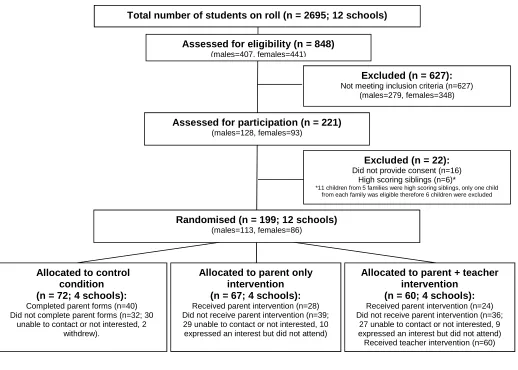
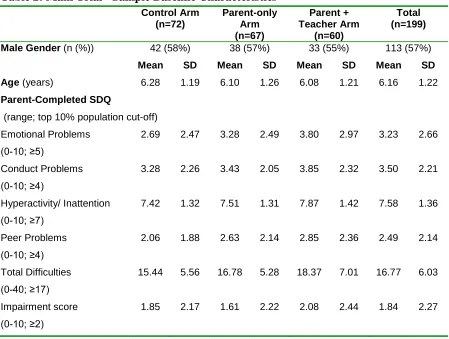
Children with parent-completed screening data (response rate of 31.5% (848/2695)) had similar scores to normative national data on the SDQ domains (Table 1). However, schools randomised to the combined intervention arm were relatively disadvantaged in terms of socio-demographic indices and SDQ scores. Figure 1 illustrates participant flow within the Trial CONSORT diagram. In terms of allocation (n=199 eligible children) across the 3 arms, Table 2 shows that child characteristics were balanced across arms at baseline in terms of gender and age, although the SDQ symptom and impairment scores were higher amongst children allocated to the combined arm. Overall, total difficulties and impairment scores approached the 'abnormal' cut-off in the population (Goodman 1999).
Parental completion of measures at baseline was not associated with child gender, age, or SDQ scores (either in the whole sample or within each trial arm). Baseline data were obtained from 92 (46%) parents and 178 (89%) teachers and six month outcome data from 76 (38%) participating parents and 169 (85%) teachers.
Figure 1 & Table 2 about here
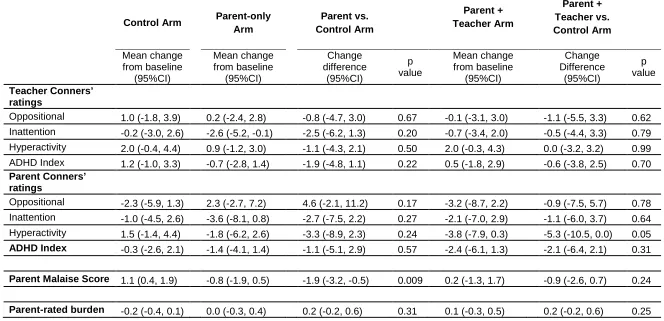
Effect of Interventions on Outcomes
(mean difference = -5.3; 95% CI -10.5,-0.01; p=0.05). At baseline, parent malaise scores were above population means. Parents in the parent-only arm reported greater reductions in the malaise score than the control arm (mean difference = -1.9; 95% CI -3.2,-0.5; p=0.009).
Tables 3 about here
In terms of health-related quality of life, over the six month follow-up, all three groups demonstrated improvements in mean EQ-5D-Y and CHU9D index values (Table 4). The small benefit observed according to allocation was not statistically significant.
Table 4 about here
Cost-Effectiveness Analyses
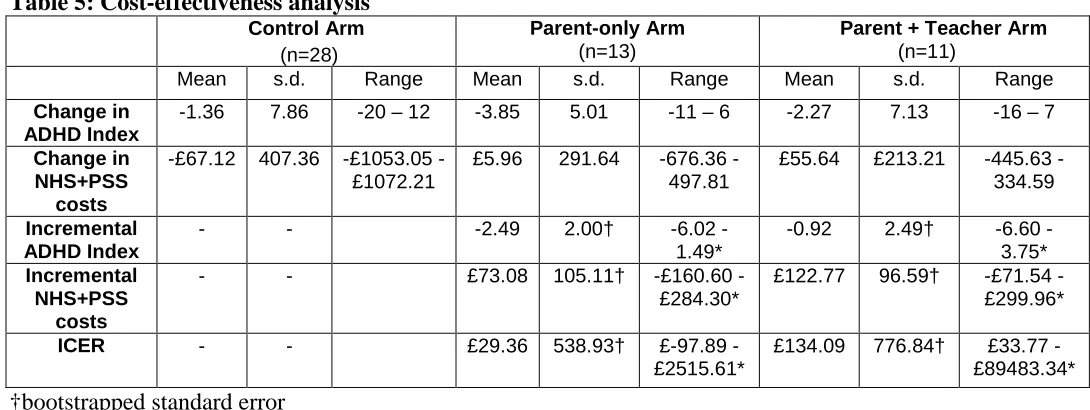
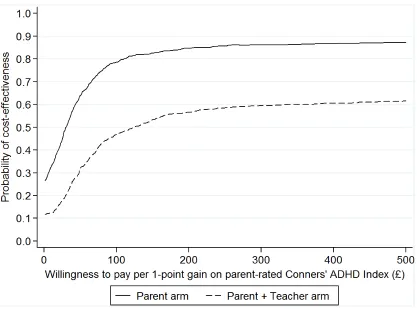
The primary analysis estimated the cost-effectiveness of each intervention using the parent-rated Conners’ ADHD Index as the outcome and adopting an NHS and PSS cost perspective. Average intervention costs per participant and other resource use are shown in Appendices A & B. The intervention costs of the parent-only and combined interventions were £90 and £107 respectively. The results of the primary cost-effectiveness analysis are shown in Table 5. The incremental cost of the parent-only programme was £73, and the incremental cost of the combined programme was £123. The mean incremental benefit, in terms of the parent-rated Conners’ ADHD Index, was a 2-point improvement for the parent-only and a 1-2-point improvement for the combined intervention. The incremental cost per 1-point improvement in the ADHD Index was £29 for the parent-only intervention and £134 in the combined intervention. In order to account for uncertainty in the results, and to provide a decision-maker’s perspective, CEACs were plotted for the two interventions. Figure 2 shows, for various willingness to pay thresholds, the probability that each intervention is cost-effective. Above a willingness to pay of £31 per 1-point improvement in the parent-rated ADHD Index, the parent-only programme has the highest probability of cost-effectiveness. Below this threshold, neither intervention is more likely to be cost-effective than usual care.
Table 5 & Figure 2 about here
and £77 per 1-point improvement in the parent-rated Conners' ADHD Index, respectively. On this basis, the teacher ratings indicate ICERs of £140 and £68, respectively.
Evaluation of Acceptability and Fidelity
In terms of parent evaluation post-intervention (n=43), 100% of parents said that they had gained knowledge to help put their learning into practice, the trainer had explained the concepts and strategies very well, and they would recommend the programme to other parents. 93% rated the programme as very useful, said that it had helped them to learn new ideas/strategies to manage their child’s behaviour, and confirmed that enough time had been spent on topics to enable them to learn ideas/strategies. At six month follow-up, parents (n=21) reported that they had used the following strategies: praise/positive reinforcement (100%), simple requests (100%), the ‘123’ counting method (100%), natural consequences (95%), time out (95%), loss of privileges (95%), docking systems (71%), sticker charts (67%), and kitchen timers (52%). 95% confirmed that they went through the initial (kick-off) conversation with their family and 76% reported that the programme had helped them to learn new ideas/strategies to manage their child’s behaviour. 81% rated the programme as very useful and 95% said that they would recommend the programme to other parents. In terms of the fidelity evaluation of the parenting group sessions, the facilitator confirmed that 88% of topics were covered “a lot” or “quite a lot” with a further 9% rated as “somewhat”.
In terms of teacher evaluation post-session (n=65), 100% said that the session was well organised, 95% that it covered useful material, 92% that it was practical to their needs and interests, 86% that it was presented at the right level, 89% that the activities were effective and 92% that the visual aids and handouts were useful.
DISCUSSION
Main Findings
parental mental health. However, interpretation of these findings should take into account that, with the exception of the teacher ratings for the parent-only intervention, outcomes relied on unblinded ratings from the individual most proximal to the therapeutic setting (Sonuga-Barke et al. 2013). Study participants found the interventions acceptable - 93% of parents rated the programme as very useful post-intervention and 81% at six-month follow-up, and 100% and 95% respectively said that they would recommend the programme to other parents. Teacher evaluation was similarly positive.
The interventions were associated with low direct and indirect costs, and there was some indication that the parent-only intervention could potentially demonstrate cost-effectiveness in a larger sample. As threshold willingness to pay values for health outcomes are not simple to define, a wide range of values were included in the cost-effectiveness acceptability curve (Figure 2). Although subject to debate (Raftery 2014), NICE currently uses a willingness to pay threshold of £20,000-£30,000 per QALY. The value attached to condition-specific measures, including in ADHD, is rarely explicit and is left to the decision maker. Our findings show that if the decision maker values a 1-point improvement in the Conners’ ADHD Index at £31 or more, the parent-only intervention is most likely to be cost-effective. With QALYs as the outcome, the parent-only intervention appears to be cost-effective at a threshold of £20,000 per QALY, but these results are subject to a great amount of uncertainty (Appendix C).
Methodological Issues
As this study involves at-risk children, the findings do not necessarily generalise to similar interventions involving children who meet diagnostic criteria for ADHD. In terms of related research, although the ‘New Forest Parenting Programme’ is effective (Sonuga-Barkeet al. 2001), it has not been systematically evaluated in school-age children or in combination with a teacher component. In a mixed community and clinical sample, there is also evidence for the effectiveness of the 'Incredible Years' programme for ADHD (Webster-Stratton et al.2011). However, this RCT involved an intensive version of the programme with over 40 hours of intervention for both the parent and the child.
the follow-up period was not long enough to demonstrate change - there may be longer-term effects on costs and outcomes.
The measurement of HRQoL in children remains contentious with little consensus on the appropriate descriptive system or valuation perspective. Furthermore, the QALY-maximisation approach to resource allocation in health care has been questioned in relation to mental health (Chisholm et al. 1997), and remains an under-studied area. In this sample, CHU9D values were consistently higher than EQ-5D-Y values across all arms. This highlights a possible discrepancy between the two measures, most likely resulting from differences in the valuation processes employed in estimating the tariffs used. The EQ-5D-Y values were obtained using the time trade-off technique, while the CHU9D was valued using a standard gamble (Ryan et al. 2001). The implications of using a proxy version of the EQ-5D-Y remain unclear and require further research. Furthermore, while the EQ-5D-Y currently uses values from the analogous adult measure, the CHU9D is based on a valuation in which adults value health states for children. A societal preference for children to receive health benefits has been identified in relation to both efficiency and fairness (Tsuchiya 1999; Williams 1997).
Clinical and Research Implications
The desirability of offering interventions to parents of unreferred at-risk children in the community remains unclear – the nested qualitative study (Taylor et al. 2015) explored the barriers and facilitators to participation in this study. Although the programme was acceptable to participating parents and may have potential, there was low uptake from eligible parents (of 127 parents offered the intervention, 52 attended, 19 expressed an interest but did not attend and 56 were not interested or no longer contactable). This was despite considerable efforts from the study team to over-come the practical barriers known to influence participation in parenting programmes (e.g. location, timing, childcare, etc.). This qualitative process evaluation highlighted learning to plan future research; for example, possibly offering the intervention to all parents who perceive that they have difficulties with their child’s behaviour (irrespective of any screening criteria) with teachers discretely approaching parents they consider to be of most need. The presence of a parent champion(s) might help in passing on ‘word of mouth’ information about the existence and usefulness of an available parenting intervention. Future research should also focus on how interventions could be delivered most cost-effectively at a population level. This might involve a comparison of screening approaches followed by targeted interventions for at-risk children against case identification approaches that involve parent or teacher concerns about behaviour followed by targeted interventions or specialist referral if clinically indicated.
Key Messages
In the UK, as part of a stepped care pathway for ADHD, NICE guidelines recommend
offering group parent-training/education interventions, at a pre-diagnosis stage, in relation to children with ADHD-type difficulties.
It is feasible and acceptable to offer interventions through schools for parents and teachers
of children with ADHD-type difficulties.
For children at risk of ADHD, an intervention programme for parents and teachers was not associated with improvement in core ADHD symptoms. Analyses of secondary outcomes suggested a possible effect on parent-rated hyperactivity symptoms and parental mental health problems.
Cost-effectiveness evaluations of school-based parent and teacher interventions for children
REFERENCES
Anderson, R., Ukoumunne, O.C., Sayal, K., Phillips, R., Taylor, J.A., Spears, M., Araya, R., Lewis, G., Millings, A., Montgomery, A.A. & Stallard, P. (2014) Cost-effectiveness of classroom-based cognitive behaviour therapy in reducing symptoms of depression in adolescents: a trial-based analysis.Journal of Child Psychology and Psychiatry,55,1390-1397.
Beecham, J. & Knapp, M. (2001) Costing psychiatric services. In: (ed. G. Thornicroft) Measuring Mental Health Needs. Second Edition, pp 200-224. Gaskell, London, UK.
Bradley, S.J., Jadaa, D.A., Brody, J., Landy, S., Tallett, S.E., Watson, W., Shea, B. & Stephens, D. (2003) Brief psychoeducational parenting program: An evaluation and 1-year follow-up. Journal of the American Academy of Child and Adolescent Psychiatry,42,1171-1178.
Briggs, A.H., Wonderling, D.E. & Mooney, C.Z. (1997) Pulling cost-effectiveness analysis up by its bootstraps: A non-parametric approach to confidence interval estimation.Health Economics,6,327–340.
Canaway, A.G. & Frew, E.J. (2013) Measuring preference-based quality of life in children aged 6-7 years: a comparison of the performance of the CHU-9D and EQ-5D-Y--the WAVES pilot study.
Quality of Life Research,22,173–183.
Carpenter, J., Kenward, M.G. & Goldstein, H. (2011) REALCOM-IMPUTE software for multilevel multiple imputation with mixed response types.Journal of Statistical Software,5,1-14
Carpenter, J. & Kenward, M.G. (2013)Multiple Imputation and its application.John Wiley & Sons Ltd, Chichester, UK.
Chisholm, D., Healey, A. & Knapp, M. (1997) QALYs and mental health care. Social Psychiatry and Psychiatric Epidemiology,32,68–75.
Coates, J., Taylor, J.A. & Sayal, K. (2015) Parenting Interventions for ADHD: A systematic literature review and meta-analysis.Journal of Attention Disorders,19,831-843.
Conners, K. (1997) Conners' Rating Scales - Revised Technical Manual. Multi-Health Systems. North Tonawanda, New York, USA.
Corkum, P.V., McKinnon, M.M. & Mullane, J.C. (2005) The effect of involving classroom teachers in a parent training program for families of children with ADHD.Child and Family Behavior Therapy,27,
29-49.
Curtis, L. (2012) Unit Costs of Health & Social Care. Personal Social Services Research Unit, University of Kent, UK.
Danckaerts, M., Sonuga-Barke, E.J., Banaschewski, T., Buitelaar, J., Dopfner, M., Hollis, C., Santosh, P., Rothenberger, A., Sergeant, J., Steinhausen, H.C., Taylor, E., Zuddas, A. & Coghill, D. (2010) The quality of life of children with attention deficit/hyperactivity disorder: a systematic review. European Child and Adolescent Psychiatry,19,83–105.
Doshi, J.A., Hodgkins, P., Kahle, J., Sikirica, V., Cangelosi, M.J., Setyawan, J., Erder, MH. & Neumann, P.J. (2012) Economic impact of childhood and adult attention-deficit/hyperactivity disorder in the United States.Journal of the American Academy of Child and Adolescent Psychiatry,51,990–1002.
Drummond, M.F., Sculpher, M., Torrance, G.W., O’Brien, B.J. & Stoddart, G.L. (2005) Methods for the Economic Evaluation of Health Care Programmes. Third edition. Oxford University Press, Oxford, UK.
Goldstein, H. (2011)Multilevel Statistical Models.John Wiley & Sons Ltd, Chichester, UK.
Goodman, R. (1999) The extended version of the Strengths and Difficulties Questionnaire as a guide to child psychiatric caseness and consequent burden.Journal of Child Psychology and Psychiatry,40, 791-799.
MVH Group. (1995) The measurement and valuation of health: Final report on the modelling of valuation tariffs.Centre for Health Economics, University of York, UK.
National Institute for Health and Care Excellence. (2013)Guide to the methods of technology appraisal. NICE Steering Group, London, UK.
National Institute for Health and Clinical Excellence (2008) Attention Deficit Hyperactivity Disorder: diagnosis and management of ADHD in children, young people and adults. Clinical Guideline 72, NICE, London, UK.
Office for National Statistics. (2013)Annual Survey of Hours and Earnings.London, UK.
Phelan, T.W. (2010)1-2-3 Magic: Effective Discipline for Children 2-12.Fourth Edition, Parent Magic Inc, Glen Ellyn, Illinois, USA.
Raftery, J.P. (2014) NICE’s Cost-Effectiveness Range: Should it be lowered?Pharmacoeconomics, 32,
613–615.
Ravens-Sieberer, U., Willie, N., Badia, X., Bonsel, G., Burstrom, K., Cavrini, G., Devlin, N., Egmar, A.C., Gusi N., Herdman, M., Jelsma, J., Kind, P., Olivares, P.R., Scalone, L. & Greiner, W. (2010) Feasibility, reliability, and validity of the EQ-5D-Y: results from a multinational study. Quality of Life Research,19, 887–897.
Rodgers, B., Pickles, A., Power, C., Collishaw, S. & Maughan, B. (1999) Validity of the Malaise Inventory in general population samples.Social Psychiatry and Psychiatric Epidemiology,34,333-341.
Ryan, M., Scott, D.A., Reeves, C., Bate, A., van Teijlingen, E.R., Russell, E.M, Napper, N. & Robb, C.M. (2001) Eliciting public preferences for healthcare: a systematic review of techniques. Health Technology Assessment,5,1–186.
Sayal, K., Daley, D., James, M., Yang, M., Batty, M.J., Taylor, J.A., Pass, S., Sampson, C.J., Sellman, E., Valentine, A. & Hollis, C. (2012) Protocol evaluating the effectiveness of a school-based group programme for parents of children at risk of ADHD: the “PArents, Teachers and CHildren WORKing Together (PATCHWORK)” cluster RCT protocol.BMJ Open,2:pii:e001783
Sayal, K., Ford, T. & Goodman, R. (2010a) Trends in recognition and service use for ADHD in Britain, 1999-2004.Psychiatric Services,61,803-810.
follow-up of a school-based trial at age 10 years. Archives of Pediatrics and Adolescent Medicine,164,
462-469.
Sayal, K., Taylor, E. & Beecham, J. (2003) Parental perception of problems and mental health service use for hyperactivity.Journal of the American Academy of Child and Adolescent Psychiatry,42, 1410-1414.
Shaw, M., Hodgkins, P., Herve, C., Young, S., Kahle, J., Woods, A.G. & Arnold, L.E. (2012) A systematic review and analysis of long-term outcomes in attention deficit hyperactivity disorder: effects of treatment and non treatment.BMC Medicine,10,99.
Sonuga-Barke, E.J., Brandeis, S.D., Cortese, S., Daley, D., Ferrin, M., Holtmann, M., Stevenson, J., Danckaerts, M., van der Oord, S., Dopfner, M., Dittmann, R.W., Simonoff, E., Zuddas, A., Banaschewski, T., Buitelaar, J., Coghill, D., Hollis, C., Konofal, E., Lecendreux, M., Wong, I.C., Sergeant, J. & European ADHD Guidelines Group. (2013) Nonpharmacological interventions for ADHD: systematic review and meta-analyses of randomized controlled trials of dietary and psychological treatments.American Journal of Psychiatry,170,275-289.
Sonuga-Barke, E.J.S., Daley, D., Thompson, M., Laver-Bradbury, C. & Weeks, A. (2001) Parent-based therapies for preschool attention-deficit/hyperactivity disorder: A randomized, controlled trial with a community sample.Journal of the American Academy of Child and Adolescent Psychiatry, 40,402-408.
Stevens, K. (2012) Valuation of the Child Health Utility 9D Index.Pharmacoeconomics,30,729–747.
Stevens, K.J. (2009) Developing a descriptive system for a new preference-based measure of health-related quality of life for children.Quality of Life Research,18,1105–1113.
Tambour, M., Zethraeus, N. & Johannesson, M. (2009) A Note on Confidence Intervals in Cost-Effectiveness Analysis.International Journal of Technology Assessment in Health Care,14,467-471.
Tarver, J., Daley, D., & Sayal, K. (2014) Attention-deficit hyperactivity disorder (ADHD): an updated review of the essential facts.Child: Care Health and Development,40,762-774.
Taylor, E., Chadwick, O., Heptinsall, E. & Danckaerts, M. (1996) Hyperactivity and conduct problems as risk factors for adolescent development. Journal of the American Academy of Child and Adolescent Psychiatry,35,1213–1226.
Taylor, J., Valentine, A., Sellman, E., Bransby-Adams, K., Daley, D. & Sayal, K. (2015) A qualitative process evaluation of a randomised controlled trial of a parenting intervention in community (school) settings for children at risk of attention deficit hyperactivity disorder (ADHD). BMC Psychiatry,15,290.
Tsuchiya, A. (1999) Age-related preferences and age weighting health benefits. Social Science and Medicine,48,267–276.
Washbrook, E., Propper, C. & Sayal, K. (2013) Pre-school hyperactivity and attention problems and educational outcomes in adolescence: prospective longitudinal study.British Journal of Psychiatry,203,
265-271.
Webster-Stratton, C.H., Reid, M.J. & Beauchaine, T. (2011) Combining Parent and Child Training for Young Children with ADHD.Journal of Clinical Child and Adolescent Psychology,40,191-203.
Wille, N., Badia, X., Bonsel, G., Burstrom, K., Cavrini, G., Devlin, N., Egmar, A.C., Greiner, W., Gusi, N., Herdman, M., Jelsma, J., Kind, P., Scalone, L. & Ravens-Sieberer, U. (2010) Development of the EQ-5D-Y: a child-friendly version of the EQ-5D.Quality of Life Research,19,875–886.
Figure 1: CONSORT Flow diagram
BASELINE (Parent, n=92 [46.2%]; Teacher, n=178 [89.4%])
6 MONTH (Parent, n=76 [38.2%]; Teacher, n=169 [84.9%])
ANALYSIS (Parent, n=76 [38.2%]; Teacher, n=169 [84.9%]) Allocated to control
condition (n = 72; 4 schools):
Completed parent forms (n=40) Did not complete parent forms (n=32; 30
unable to contact or not interested, 2 withdrew).
Allocated to parent only intervention (n = 67; 4 schools):
Received parent intervention (n=28) Did not receive parent intervention (n=39;
29 unable to contact or not interested, 10 expressed an interest but did not attend)
Completed baseline Teacher n = 59; Parent n = 24
Did not complete baseline measures (Teacher n=1; 1 unable to contact)
Completed baseline Teacher n = 55; Parent n = 40
Did not complete baseline measures (Teacher n=17; 7 teacher on strike, 9 teacher withdrew; 1 unable to contact)
Completed baseline Teacher n = 64; Parent n = 28
Did not complete baseline measures (Teacher n=3; 3 unable to contact)
Excluded (n = 627):
Not meeting inclusion criteria (n=627) (males=279, females=348)
Excluded (n = 22):
Did not provide consent (n=16) High scoring siblings (n=6)*
*11 children from 5 families were high scoring siblings, only one child from each family was eligible therefore 6 children were excluded Assessed for participation (n = 221)
(males=128, females=93)
Assessed for eligibility (n = 848)
(males=407, females=441)
Total number of students on roll (n = 2695; 12 schools)
Randomised (n = 199; 12 schools)
(males=113, females=86)
Completed 6 month follow up Teacher n = 53; Parent n = 17
Lost to follow up - Teacher (n=6; 5 children left school; 1 teacher not contactable) Lost to follow up - Parent (n=7; 2 parents
withdrew from parent follow up only, 5 parents were not contactable)
Completed 6 month follow up Teacher n = 52; Parent n = 37
Lost to follow up - Teacher (n=3; 3 children left school)
Lost to follow up - Parent (n=3; 3 parents were not contactable)
Completed 6 month follow up Teacher n = 64; Parent n = 22
Lost to follow up - Parent (n=6; 3 parents withdrew from parent follow up only, 3
parents were not contactable)
E n ro lm e n t A ll o c a ti o n F o ll o w u p Analysed
(Teacher n = 53; Parent n = 17) Analysed
(Teacher n = 52; Parent n = 37)
Analysed
(Teacher n = 64; Parent n = 22)
A n a ly s is
Allocated to parent + teacher intervention
(n = 60; 4 schools):
Received parent intervention (n=24) Did not receive parent intervention (n=36;
Table 1: Characteristics of schools and children with screening data, by trial arm
Control Arm Parent-only Arm Parent + Teacher Arm
All Screened
National data* Demographics of Participating Schools
Median Range Median Range Median Range
Children on school
roll (n)
428 402-518 395.5 365-442 414.5 378-475
Children
Reception to Year
3 (n)
220 166-262 225.5 167-245 243.5 198-279
Children eligible
for free school
meals (%)
15.1 4.7-20.2 20.1 2.6-41.5 40.9 12.3-55.2
Children speaking
English as
additional
language (%)
2.5 1.7-3.7 3.3 1.4-4.3 3.2 0.9-9.3
Children with SEN
School Action (%)
9.6 6.2-19.6 10.4 2.3-16.4 16.3 8.7-26.1
Children with SEN
School Action Plus
(%)
3.7 1.7-5.6 3.8 3.0-6.6 9.8 1.4-20.8
Parent-Completed SDQ
Mean SD Mean SD Mean SD Mean SD Mean SD
(n=320) (n=326) (n=202) (n=848)
Emotional
Problems
(0-10)
2.02 2.06 2.00 2.11 2.48 2.51 2.12 2.20 1.9 2.0
Conduct Problems
(0-10)
1.63 1.81 1.71 1.87 2.04 2.14 1.76 1.92 1.6 2.0
Hyperactivity/
Inattention
(0-10)
3.53 2.68 3.75 2.69 4.54 2.84 3.85 2.75 3.6 2.7
Peer Problems
(0-10)
1.29 1.61 1.42 1.65 1.91 2.01 1.49 1.74 1.4 1.7
Total Difficulties
(0-40)
8.43 5.82 8.86 6.40 10.87 7.56 9.17 6.55 8.6 5.7
Notes:SEN = Special Education Needs
School demographic data obtained from https://www.gov.uk/government/publications/schools-pupils-and-their-characteristics-january-2011 and https://www.gov.uk/government/publications/special-educational-needs-in-england-january-2011accessed on 13 October 2015.
National normative data (5-10 year olds national average) for Britain obtained from
Table 2: Main Trial - Sample Baseline Characteristics
Control Arm (n=72)
Parent-only Arm (n=67)
Parent + Teacher Arm
(n=60)
Total (n=199)
Male Gender(n (%)) 42 (58%) 38 (57%) 33 (55%) 113 (57%)
Mean SD Mean SD Mean SD Mean SD
Age(years) 6.28 1.19 6.10 1.26 6.08 1.21 6.16 1.22
Parent-Completed SDQ
(range; top 10% population cut-off)
Emotional Problems (0-10; ≥5)
2.69 2.47 3.28 2.49 3.80 2.97 3.23 2.66
Conduct Problems (0-10; ≥4)
3.28 2.26 3.43 2.05 3.85 2.32 3.50 2.21
Hyperactivity/ Inattention (0-10; ≥7)
7.42 1.32 7.51 1.31 7.87 1.42 7.58 1.36
Peer Problems (0-10; ≥4)
2.06 1.88 2.63 2.14 2.85 2.36 2.49 2.14
Total Difficulties
(0-40; ≥17)
15.44 5.56 16.78 5.28 18.37 7.01 16.77 6.03
Impairment score (0-10; ≥2)
Table 3: Treatment effect on mean change score from baseline
Control Arm Parent-only Arm
Parent vs. Control Arm
Parent + Teacher Arm
Parent + Teacher vs. Control Arm
Mean change from baseline
(95%CI)
Mean change from baseline
(95%CI)
Change difference
(95%CI)
p value
Mean change from baseline
(95%CI)
Change Difference
(95%CI)
p value
Teacher Conners’ ratings
Oppositional 1.0 (-1.8, 3.9) 0.2 (-2.4, 2.8) -0.8 (-4.7, 3.0) 0.67 -0.1 (-3.1, 3.0) -1.1 (-5.5, 3.3) 0.62
Inattention -0.2 (-3.0, 2.6) -2.6 (-5.2, -0.1) -2.5 (-6.2, 1.3) 0.20 -0.7 (-3.4, 2.0) -0.5 (-4.4, 3.3) 0.79
Hyperactivity 2.0 (-0.4, 4.4) 0.9 (-1.2, 3.0) -1.1 (-4.3, 2.1) 0.50 2.0 (-0.3, 4.3) 0.0 (-3.2, 3.2) 0.99
ADHD Index 1.2 (-1.0, 3.3) -0.7 (-2.8, 1.4) -1.9 (-4.8, 1.1) 0.22 0.5 (-1.8, 2.9) -0.6 (-3.8, 2.5) 0.70
Parent Conners’ ratings
Oppositional -2.3 (-5.9, 1.3) 2.3 (-2.7, 7.2) 4.6 (-2.1, 11.2) 0.17 -3.2 (-8.7, 2.2) -0.9 (-7.5, 5.7) 0.78
Inattention -1.0 (-4.5, 2.6) -3.6 (-8.1, 0.8) -2.7 (-7.5, 2.2) 0.27 -2.1 (-7.0, 2.9) -1.1 (-6.0, 3.7) 0.64
Hyperactivity 1.5 (-1.4, 4.4) -1.8 (-6.2, 2.6) -3.3 (-8.9, 2.3) 0.24 -3.8 (-7.9, 0.3) -5.3 (-10.5, 0.0) 0.05
ADHD Index -0.3 (-2.6, 2.1) -1.4 (-4.1, 1.4) -1.1 (-5.1, 2.9) 0.57 -2.4 (-6.1, 1.3) -2.1 (-6.4, 2.1) 0.31
Parent Malaise Score 1.1 (0.4, 1.9) -0.8 (-1.9, 0.5) -1.9 (-3.2, -0.5) 0.009 0.2 (-1.3, 1.7) -0.9 (-2.6, 0.7) 0.24
Table 4: Health-related quality of life*
Control Arm
Mean (s.d.) n=33
Parent-only Arm
Mean (s.d.) n=16
Parent + Teacher Arm
Mean (s.d.) n=9
Baseline 3 month 6 month Baseline 3 month 6 month Baseline 3 month 6 month
EQ-5D-Y 0.815
(0.257)
0.888 (0.200)
0.822 (0.279)
0.734 (0.370)
0.808 (0.373)
0.834 (0.292)
0.771 (0.294)
0.773 (0.412)
0.790 (0.418)
CHU9D 0.847
(0.099)
0.887 (0.093)
0.880 (0.109)
0.818 (0.128)
0.869 (0.099)
0.887 (0.092)
0.897 (0.102)
0.859 (0.143)
Table 5: Cost-effectiveness analysis
Control Arm
(n=28)
Parent-only Arm
(n=13)
Parent + Teacher Arm
(n=11)
Mean s.d. Range Mean s.d. Range Mean s.d. Range
Change in ADHD Index
-1.36 7.86 -20 – 12 -3.85 5.01 -11 – 6 -2.27 7.13 -16 – 7
Change in NHS+PSS
costs
-£67.12 407.36 £1053.05
-£1072.21
£5.96 291.64 676.36
-497.81
£55.64 £213.21 445.63
-334.59
Incremental ADHD Index
- - -2.49 2.00† 6.02
-1.49*
-0.92 2.49† 6.60
-3.75*
Incremental NHS+PSS
costs
- - £73.08 105.11† £160.60
-£284.30*
£122.77 96.59† £71.54
-£299.96*
ICER - - £29.36 538.93† £97.89
-£2515.61*
£134.09 776.84† £33.77
-£89483.34*
†bootstrapped standard error
ONLINE-ONLY APPENDICES:
Appendix A: intervention costs
Mean cost per person Parent-only Arm
Parent + teacher Arm
Staff training £28.19 £28.19
Staff time £51.97 £59.97
Child care £1.45 £1.45
Consumables £1.27 £4.07
Overheads £2.36 £8.86
Screening £4.27 £4.27
Appendix B: Resource use associated with child’s behaviour
Control Arm Parent-only Arm Parent + Teacher Arm
Baseline1 Follow-up2 Baseline1 Follow-up2 Baseline1 Follow-up2
n mean s.d. range n mean s.d. range n mean s.d. range n mean s.d. range n mean s.d. range n mean s.d. range
Days of work missed
34 2.68 15.65 0–
91.25
27 1 4.46 0–23 21 0.10 0.44 0–2 12 0 0 0–0 18 0.22 0.73 0–3 8 0 0 0–0
Hours fewer worked
33 0.12 0.70 0–4 27 0 0 0–0 21 0.83 3.82 0–
17.5
12 0 0 0–0 18 0.58 1.86 0–7.5 8 0 0 0–0
Other carers’ days of work missed
35 0.11 0.68 0–4 28 0.04 0.19 0–1 20 0.05 0.22 0–1 13 0.23 0.60 0–2 22 0.07 0.32 0–1.5 11 0 0 0–0
Partner’s days of work missed
34 0.15 0.70 0–4 28 0.21 0.83 0–4 22 0.05 0.21 0–1 12 0.17 0.58 0–2 22 0.07 0.32 0–1.5 8 0.25 0.71 0–2
Educational Psychologist
35 0 0 0–0 30 0.1 0.31 0–1 22 0 0 0–0 13 0 0 0–0 23 0.65 2.72 0–13 11 0 0 0–0
SENCo 35 0.03 0.17 0–1 30 1.23 4.06 0–21 22 0.27 0.70 0–3 13 1.15 3.60 0–13 23 3.04 13.51 0–65 11 1.45 3.93 0–13
Classroom assistant
32 5.25 16.58 0–65 30 7.37 18.15 0–65 22 8.86 22.83 0–65 13 0 0 0–0 23 17.26 29.02 0–65 11 27.18 48.80 0–130
A&E 35 0 0 0–0 30 0.03 0.18 0–1 22 0.05 0.21 0–1 13 0 0 0–0 23 0 0 0–0 11 0.18 0.40 0–1
Other outpatient
35 0.03 0.17 0–1 30 0 0 0–0 22 0 0 0–0 13 0 0 0–0 23 0.04 0.21 0–1 11 0 0 0–0
GP (practice) 35 0.31 0.87 0–4 30 0.27 0.78 0–3 22 0.14 0.47 0–2 13 0 0 0–0 23 0.17 0.58 0–2 11 0 0 0–0
GP (home) 35 0 0 0–0 30 0 0 0–0 22 0 0 0–0 13 0 0 0–0 23 0 0 0–0 11 0 0 0–0
Practice nurse
35 0 0 0–0 30 0.03 0.18 0–1 22 0 0 0–0 13 0 0 0–0 23 0.09 0.42 0–2 11 0 0 0–0
School nurse 35 0.34 0.94 0–4 30 0.07 0.25 0–1 22 0.05 0.21 0–1 13 0 0 0–0 23 0.35 0.93 0–4 11 0 0 0–0
Health visitor (home)
35 0 0 0–0 30 0.03 0.18 0-1 22 0 0 0–0 13 0 0 0–0 23 0.04 0.21 0–1 11 0 0 0–0
Hospital paediatrician
35 0 0 0–0 30 0.1 0.31 0–1 22 0.05 0.21 0–1 13 0 0 0–0 23 0.04 0.21 0–1 11 0 0 0–0
Community paediatrician
35 0.11 0.32 0–1 30 0.1 0.40 0–2 22 0.14 0.35 0–1 13 0.15 0.55 0–2 23 0.39 0.66 0–2 11 0.09 0.30 0–1
Counselling 35 0.26 1.22 0–7 30 0.23 0.97 0–5 22 0 0 0–0 13 0 0 0–0 23 0 0 0–0 11 0 0 0–0
CAMHS 35 0.26 1.07 0–6 30 0.17 0.75 0–4 22 0 0 0–0 13 0.08 0.28 0–1 23 0.26 1.05 0–5 11 0 0 0–0
Social worker (home)
35 0.09 0.51 0–3 30 0.37 2.01 0–11 22 0.05 0.21 0–1 13 0.08 0.28 0–1 23 0.78 2.56 0–12 11 0 0 0–0
Social worker (office)
35 0.03 0.17 0–1 30 0.27 1.46 0–8 22 0 13 0 0 0–0 23 0 11 0 0 0–0
After school club
35 0 30 0.87 4.75 0–26 22 1.18 5.54 0–26 13 0.92 3.33 0–12 23 1.04 3.46 0–12 11 0 0 0–0
1
Appendix C: Secondary cost-effectiveness analyses
Parent-only Arm Parent + teacher Arm
Cost perspective Outcome measure Total n Incremental cost Incremental benefit
ICER 95% CI* Incremental cost
Incremental benefit
ICER 95% CI*
A NHS Parent
Conners’ ADHD Index
52 £73.08 2.489 £29.36 -97.89,
2515.61
£122.77 0.916 £134.09 33.77,
89483.34
B NHS Teacher
Conners’ ADHD Index
47 -£10.19 2.304 -£4.42 -558.56,
142.98
£89.62 -3.342 -£26.82 -2026.76,
34.05
C NHS QALYs
(EQ-5D-Y)
51 £73.08 0.019 £3899.04 -1723.04,
4441.18
£142.77 -0.005 -£28258.63 -807.71,
547312.4
D NHS QALYs
(CHU9D)
48 £118.04 0.015 £7860.58 -9771.78,
59299.7
£82.98 -0.022 -£3692.45 -24001.27,
5817.74
E Societal Parent Conners’ ADHD Index
48 £105.93 2.486 £42.61 -143.68,
1627.72
£227.72 1.440 £158.14 34.32,
5.4x10¹⁶
F Societal Teacher Conners’ ADHD Index
44 £22.19 3.656 £6.07 -156.87,
173.27
£143.98 -1.990 -£72.33 -16262.23,
-3.69
G Societal QALYs (EQ-5D-Y)
47 £105.93 0.018 £6020.52 -1364.71,
5898.63
£255.00 -0.008 -£33750.88 1749.27,
623550
H Societal QALYs (CHU9D)
44 £140.25 0.012 £11694.85 -8888.36,
310382
£192.70 -0.028 -£6860.22 -26689.89,