THE APPLICATION OF THE FRAGMENT-BASED
SCREENING APPROACH TO RMLA PROTEIN AND PA1645 STRUCTURE
Wassila Abdelli Boulkeroua
A Thesis Submitted for the Degree of PhD at the
University of St Andrews
2013
Full metadata for this item is available in Research@StAndrews:FullText
at:
http://research-repository.st-andrews.ac.uk/
Please use this identifier to cite or link to this item:
http://hdl.handle.net/10023/4477
1
The application of the fragment-based screening approach
to RmlA protein and PA1645 structure
by
Wassila Abdelli Boulkeroua
A thesis submitted for the degree of Doctor of Philosophy
The University of St Andrews
1. Candidate’s declarations:
I, Wassila Abdelli Boulkeroua, hereby certify that this thesis, which is approximately 34,700 words in length, has been written by me, that it is the record of work carried out by me and that it has not been submitted in any previous application for a higher degree.
I was admitted as a research student in October 2007 and as a candidate for the degree of PhD in structural biology in September 2011; the higher study for which this is a record was carried out in the University of St Andrews between 2011 and 2012.
Date 27/08/2013 signature of candidate
2. Supervisor’s declaration:
I hereby certify that the candidate has fulfilled the conditions of the Resolution and Regulations appropriate for the degree of PhD in structural biology in the University of St Andrews and that the candidate is qualified to submit this thesis in application for that degree.
Date 27-8-13 signature of supervisor
3. Permission for electronic publication:(to be signed by both candidate and supervisor)
In submitting this thesis to the University of St Andrews we understand that we are giving permission for it to be made available for use in accordance with the regulations of the University Library for the time being in force, subject to any copyright vested in the work not being affected thereby. We also understand that the title and the abstract will be published, and that a copy of the work may be made and supplied to any bona fide library or research worker, that my thesis will be electronically accessible for personal or research use unless exempt by award of an embargo as requested below, and that the library has the right to migrate my thesis into new electronic forms as required to ensure continued access to the thesis. We have obtained any third-party copyright permissions that may be required in order to allow such access and migration, or have requested the appropriate embargo below.
The following is an agreed request by candidate and supervisor regarding the electronic publication of this thesis:
Access to printed copy and electronic publication of thesis through the University of St Andrews.
2
TABLE OF CONTENTS
LIST OF ABBREVIATIONS 5
ABSTRACT 8
ACKNOWLEDGMENT 10
CHAPTER ONE 12
Introduction 12
1.1. Antibiotics resistance 13
1.2. Pseudomonas aeruginosa 14
1.3. Mycobacterium tuberculosis 18
1.4. L-Rhamnose Pathway 22
1.5. Drug discovery techniques 23
1.6. FBDD approaches 24
1.7. Fragment library design 28
1.7.1. Fragments key properties 28
1.7.2. Library design 29
1.7.3. Quantitative estimate of drug-likeness (QED) score 31
1.8. Screening techniques 31
1.8.1. X-ray crystallography 31
1.8.2. Surface plasmon resonance (SPR) 32
1.8.3. Nuclear magnetic resonance spectroscopy (NMR) 38
1.8.3.1. NMR in drug discovery 38
1.8.3.2. General features 38
1.8.3.3. Ligand-based vs. target-based NMR spectroscopy 40
1.8.3.4. Chemical shift mapping 41
1.9. Examples of drugs originating from FBDD 45
1.9.1. The application of FBDD to Hsp90 protein 48
1.9.1.1 Optimisation of aminopyrimidines starting from fragment 1 50 1.9.1.2. Optimization of phenols starting from fragment 3 53
1.10. Aim of this study 60
CHAPTER TWO 61
The application of Differential Scanning Fluorimetry (DSF) to detect ligands that bind and
stabilise RmlA protein 61
2.1 Introduction 62
2.2. Materials and methods 66
2.2.1. E. coli BL21 competent cells preparation 66
2.2.2. Genetic transformation of competent cells 66
2.2.3. RmlA overexpression and purification 67
2.2.4. The identification of the protein by Mass Spectrometry 71
2.2.5. Fragment library 73
2.2.6. DSF experimental setup 73
2.2.7. Analysis of thermal shift data 75
2.2.8. The application of DSF to other P. aeruginosa Proteins 76
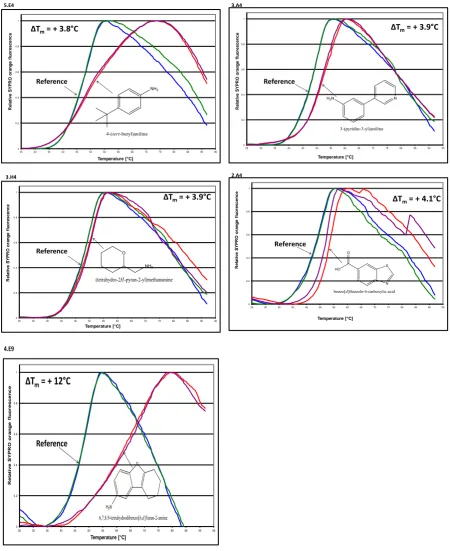
2.3. Results and discussion 77
3
2.4. Conclusion 88
CHAPTER THREE 90
The application of ligand-based NMR screening techniques in order to find novel inhibitors
for RmlA protein 90
3.1. Introduction 91
3.1.1. Saturation transfer difference 91
3.1.2. WaterLOGSY 95
3.1.3 Limitations to ligand-based NMR screening 98
3.2. Materials and methods 100
3.2.1. Cocktail preparation 100
3.2.2. Ligand-based NMR experimental set-up 101
3.2.3. Binding specificity by STD competition experiment 102
3.3. Results and data analysis 103
3.3.1. STD results and data analysis 103
3.3.2. WaterLOGSY results and data analysis 107
3.3.3. Results and discussion of the dTTP competition binding STD experiment 117
3.4. Epitope mapping via STD 127
3.5. Discussion and conclusion 131
CHAPTER FOUR 135
The application of a coupled enzyme bioassay in order to detect compounds that inhibit the
biological activity of RmlA 135
4.1. Introduction 136
4.2. Materials and methods 142
4.2.1. Protein overexpression and purification 142
4.2.2. Fragment library 142
4.2.3. Assay description 142
4.3. Results and discussion 144
4.4. Conclusion and future work 157
CHAPTER FIVE 160
Purification, crystallisation and structural characterisation of 160
PA1645, a Pseudomonas aeruginosa protein 160
5.1 Introduction 161
5.1.1. S-SAD phasing as a powerful tool in protein X-ray crystallography 161
5.2 Materials and methods/results 163
5.2.1. Protein Overexpression and purification 164
5.2.2. Crystallisation 169
5.2.3. Data collection 170
5.3. Discussion 182
5.3.1. Structural analysis 182
5.4. Conclusion and future work 184
CHAPTER SIX 186
Conclusions and future work 186
6.1. Conclusions and future work to the application of FBDD approach to RmlA 187
6.2. Conclusions and future work to PA1645 structure 189
4
REFERENCES 191
APPENDICES 211
APPENDIX A 212
APPENDIX B 224
APPENDIX C 242
5
LIST OF ABBREVIATIONS
AG Arabinogalactan
AMP Adenosine Monophosphate
ATP Adenosine Tri-Phosphate
CCD Charge-Coupled Device
DHAP Dihydroxyacetone Phosphate
DLS Dynamic Light Scattering
DMSO Dimethyl Sulfoxide
DSF Differential Scanning Fluorimetry
DTT Dithiothreitol
dTTP Deoxythymidine triphosphate
EDTA Ethylenediaminetetraacetic Acid
GAP Glyceraldehyde 3-phosphate or 3-phosphoglyceraldehyde
GDH Glutamate Dehydrogenase
GFP Green Fluorescent Protein
GFP Green Fluorescent Protein
6
IPTG Isopropyl-d-thiogalactoside
LB Luria-Bertani
MAD Multiwavelength Anomalous Dispersion
MDR Multi-Drug Resistant
Met Methionine
MICs Minimum Inhibitory Concentration
MR Molecular-Replacement
MTB Mycobacterium Tuberculosis
NAD+ Nicotinamide Adenine Dinucleotide
NADH Nicotinamide Adenine Dinucleotide
NMR Nuclear Magnetic Resonance
NROT Number of Rotatable Bonds
NTA Nitrilotriacetic Acid
PBP Penicillin-Binding Protein
PCR Polymerase Chain Reaction
PPi Inorganic Pyrophosphate
PPI-PFK Pyrophosphate-dependent Phosphofructokinase
7 RmlA glucose-phosphate thymidylyltransferase
RmlA Glucose-1-phosphate thymidylyltransferase
RmlD dTDP-6-deoxy-L-lyxo-4-hexulose reductase
SAD Single Wavelength Anomalous Dispersion
SDS-PAGE Sodium Dodecyl Sulfate Polyacrylamide Gel Electrophoresis
SeMet Selenomethionine
SPR Surface Plasmon Resonance
S-SAD Sulfur-single Wavelength Anomalous Dispersion
STD Saturation Transfer Difference
TB Tuberculosis
TEV Tobacco Etch Virus
TMP Thymidine Monophosphate
TPI Triose-Phosphate Isomerase
Tris Tris(hydroxymethyl)aminomethane
WaterLOGSY Water–Ligand Observed Via Gradient Spectroscopy
WHO World Health Organization
8
ABSTRACT
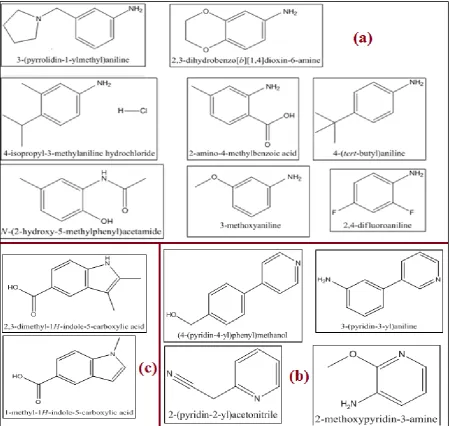
P. aerguinosa is a serious human bacterial pathogen. This thesis describes attempts to use structural biology to identify new starting points for drugs against P. aerguinosa .A number of fragment-based screening techniques were used in order to identify potential inhibitors to P. aerguinosa RmlA protein, the first enzyme in the L-Rhamnose pathway. A 500 “Rule of 3” Fragment Library (Maybridge) was investigated. The first approach was the application of Differential Scanning Fluorimetry (DSF) approach to detect ligands that bind and stabilize RmlA protein. The stabilisation of RmlA was determined by thermal unfolding in the presence of each of the 500 compounds. 21 of those compounds were found to increase the protein stability. The library was then screened by NMR spectroscopy for binding to RmlA. Two techniques were evaluated STD and WaterLOGSY. 106 compounds gave positive results in both NMR experiments. These hits were then tested by a simple STD competition binding with dTTP, a natural RmlA substrate, in order to identify those binding at the active or allosteric site. 21 out of the 106 compounds were observed to compete with dTTP. The results were compared to the results of the DSF screening. Compounds that tested positive in the dTTP competition binding STD experiment and in the DSF screening were tested for their ability to inhibit RmlA in a biological assay. A coupled enzyme assay was used to monitor RmlA activity. Only one compound, 3-pyridin-3-ylaniline, showed significant inhibition of the enzyme activity.
9 asymmetric unit. There is some ambiguity as to the validity of the proposed trimeric arrangement, with results from solution and crystal disagreeing.
10
ACKNOWLEDGMENT
I would like to express my gratitude to my supervisor Professor Jim Naismith for his exceptional and endless support, guidance and encouragement throughout this research. Also, I would like to warmly thank all members of the Naismith Group, in particular Dr Magnus Alphey, Dr. Srikannathasan and Judith Reeks. Special thanks to Dr Uli Schwarz-Linek, Dr Tomas Lebl and Mrs MelanjaSmith for their help with NMR experiments.
I dedicate this work for my parents and family, especially my daughter Yoursa who came to this world during my PhD and who has been a driving motor to finishing this project.
12
CHAPTER ONE
13
1.1. Antibiotics resistance
Nowadays, bacterial resistance to antibiotics is an ever-increasing worldwide concern. A fundamental problem leading to such resistance is the irrational use of antibiotics. In fact, prolonged or inadequate dosing of antibiotics may result in the selection of multidrug resistant isolates, as these bacteria survive and replicate depending on a number of factors including antibiotic use (Henderson, 2006). The misuse and overprescribing of antibiotics is a common practice in many parts of the world, especially developing countries where the supply of these agents is unregulated (Hart and Kariuki, 1998).
14
1.2. Pseudomonas aeruginosa
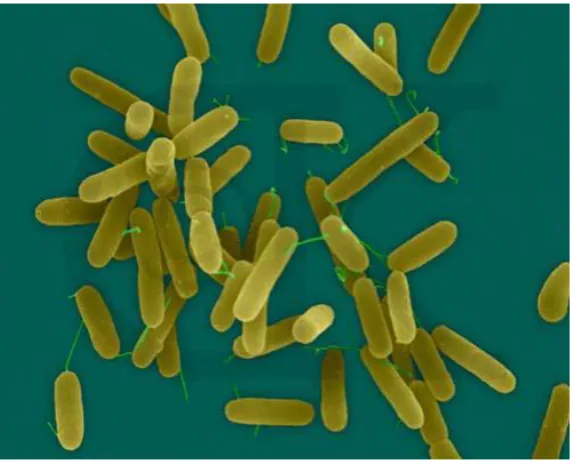
In 1862, Luke first reported Pseudomonas aeruginosa (P. aeruginosa) in human infections. Later, in 1882, the bacterium was first isolated by Gessard, who called it Bacillus pyocyaneus (Lyczak, 2000). P. aeruginosa is a Gram-negative opportunistic pathogen with minimal nutritional requirements and can tolerate a wide variety of physical conditions. This ubiquitous free-living bacterium is found in most moist environments (Moynie et al., 2013).
15
Figure 1.1: Microscopic photograph of P. aeruginosa (http://www.pseudomonas.com)
16 Treatment of infections caused by P. aeruginosa can be very difficult as this organism in particular demonstrates all known enzymic and mutational mechanisms of bacterial resistance, which makes it a phenomenon of antibiotic resistance (Pechere and Kohler, 1999; Nadeem et al., 2009). P. aeruginosa is intrinsically resistant to most antimicrobial agents (Mesaros et al., 2007; Nadeem et al., 2009). Intrinsic resistance consists of the inherent structural or functional characteristics that exist in the average strain of a given species and provide it with an innate ability to resist a particular antimicrobial agent irrespective of antibiotic exposure (Hancock, 1998). The basis for the high intrinsic resistance of P. aeruginosa is its low outer-membrane permeability to the uptake of antibiotics and substrate molecules. The movement of small hydrophilic molecules such as β-lactams into the cell is restricted to a small portion of the outer-membrane (mainly the water-filled channels of porin proteins) (Hancock, 1998). Although this semi-permeable barrier property of the outer- membrane is true for all Gram-negative bacteria, it is especially true in the case of P. aeruginosa, which has an outer-membrane that is 12 to 100-fold less permeable than that of Escherichia coli (E. coli) for example (Nikaido and Hancock, 1986).
17 MIC. Although difficult to explain, this acquired resistance could be based on the fact there is limited oxygen availability at higher culture densities which may affect the action of antibiotics that require active electron transport for cellular uptake (Davey et al., 1988; Bryan, 1991; Hancock, 1998)
The acquired resistance of P.aeruginosa is unstable and the organism will revert to full susceptibility when the inducing environmental factors are removed. However, the intrinsic resistance of the bacterium can be coupled with genetic resistance which involves the stable acquisition of a drug resistance plasmid, or new genetic information as a result of mutation of an existing gene product or control mechanism. These genetic resistance mechanisms affect the most frequently administrated antipseudomonal antibiotics: β-lactams, aminoglycosides and fluoroquinolones (Strateva and Yordanov, 2009). In the case of aminoglycosides, for example, broad range resistance mechanisms have been described. Enzyme modification is one of the major mechanisms reported, which involves the acquisition of certain plasmids encoding for enzymes that attach a phosphate, adenyl or acetyl radical to the antibiotic molecule. This results in a reduced binding affinity of the modified antibiotics to the target in the bacterial cell (Llano-Sotelo et al., 2002). The bacterium also has in its chromosome an aminoglycoside resistance gene, aphA, which can be activated by mutation (Okii et al., 1983).
18 cephalosporinase) coupled to the low membrane permeability of P. aeruginosa contribute to a great extent to the organism’s natural resistance to β-lactams. (Nordmann and Guibert, 1998; Hancock and Speert, 1996). There are uncommon genetic resistance mechanisms that affect β-lactams which include altered outer-membrane permeability, which mainly involves the loss of the major porin protein named OprF. Only a modest increase in resistance is observed with such mutations and does not always affect β-lactams themselves. Modification of the target site, penicillin-binding protein (PBP), is another rare genetic resistance mechanism observed in clinical, animal model and selected laboratory isolates (Hancock and Speert, 1996; Malouin and Bryan, 1986). Examples include altered PBP-4s with low affinity which were reported after imipenem treatment and modified PBP-3s, which results in an increased resistance to many anti-pseudomonal β-lactams (Gotoh, 1990; Pechere and Kohler, 1999).
With fewer antimicrobial agents being developed, resistance in this organism can develop very rapidly at a much faster rate. This, combined with weakened host defences and the production of extracellular bacterial enzymes and toxins, results in a high mortality rate from infections due this notorious bacterium, which can go up to 40–50% (Shahcheraghi et al., 2003).
1.3. Mycobacterium tuberculosis
19 asymptomatic and potentially long lasting. In the active state the bacteria can multiply and destroy blood vessels and lung tissues (Davidow et al., 2005). TB is diagnosed using tuberculin skin test, acid-fast stain, and chest radiographs. It is estimated that one-third of the world’s population has been in contact with the pathogen, but approximately 90% of infected persons are clinically asymptomatic (Fremond et al., 2004). According to statistics produced by the World Health Organization (WHO) two billion people are infected with (MTB), with nine million new active TB cases annually (Spigelman, 2007; World Health Organization, 2010).
20
Figure 1.2: Mycobacterium tuberculosis (from www.sciencesource.com)
The long doubling time of MTB strains represents a considerable difficulty in working with the pathogen which divides every 15–20 hours. This is relatively slow compared to other bacteria with division times measured in minutes. E. coli for example can divide roughly every 20 minutes (Dye et al., 2002).
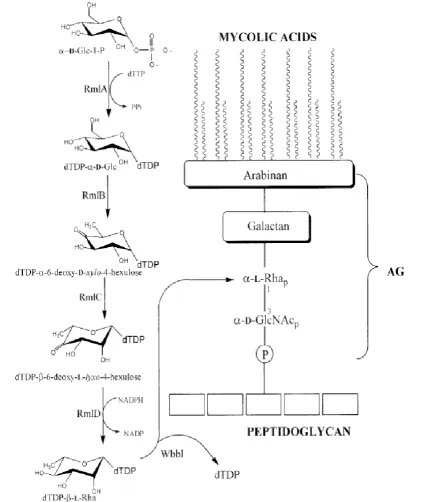
The mycobacterial cell wall of the TB bacilli represents an attractive target for drug discovery. The wall core is composed of three interconnected macromolecules (figure 1.3). The outermost is a lipid layer that consists of branched fatty acids called the mycolic acids. The middle component, arabinogalactan (AG), is a polymer composed of galactofuranosyl and D-arabinofuranosyl residues. AG is linked to peptidoglycan, the innermost of the three macromolecules, by a linker disaccharide α-L-rhamnosyl-(13)-α-D
21
Figure 1.3: Mycobacterium tuberculosis cell wall structure and the dTDP-L-rhamnose
[image:23.595.92.515.60.563.2]22
1.4. L-Rhamnose Pathway
23
1.5. Drug discovery techniques
The examples of drug-resistant organisms discussed above demonstrate the need for the development of new therapeutic agents. The fragment-based drug discovery (FBDD) is currently predominant in pharmaceutical research and biotechnological industries, with over a decade of practical experience and theoretical analysis. Leads derived from high throughput screening (HTS) of large compounds had a low success rate in clinics. Better understanding of the reasons for such failure influenced to a great extent the fragment based drug discovery fields and formed the basis of its underpinning logic (Siegal et al., 2007).
Compared to HTS, FBDD has a number of attractive features. First, the essence of this approach is the use of low molecular weight fragments, usually less than 250 Dalton (Goddette, 2006; Rees et al., 2004). In general, reducing the size of a large complex molecule is more difficult than building up a new one (Erlanson, 2006). Therefore, this feature makes the subsequent chemical optimization of the drug easier, allowing hence the production of leads with high ligand efficiency (LE) and molecular weights within the desired range (Liu et al., 2003). The concept of LE can be used to determine the potency of hits during lead identification stage and decide whether an increase in molecular size is necessary and can be justified by significant gains in potency. LE can be defined as:
where ΔG is the free energy of binding of the ligand for a specific protein, HAC is the number
of heavy atoms in the ligand, and Kd represents the dissociation constant for the protein-ligand
complex (the half maximum inhibitory concentration, IC50, is often used instead of Kd)
24 Second, the number of compounds screened is smaller, usually in the range of a hundred to a few thousands (Goddette, 2006; Rees et al., 2004). This can be explained by the fact that these compounds are simpler in structure, with a higher probability of binding to target protein-binding site than large complex molecules (Lesuisse et al., 2002). They are small enough to reduce the probabilities of unfavourable interactions (electronic or steric) to a minimum. Third, unlike most other techniques, FBDD detects compounds that bind with low affinity (100 μM to 10 mM) (Goddette, 2006). Structural information about these weak binding interactions can be obtained via techniques such as X-ray crystallography, NMR and others (Congreve et al., 2003b).
1.6. FBDD approaches
25
Figure 1.4: Shematic representation of fragment evolution. (a) Fragment 1 binds to the
receptor at one site. (b) A more complex molecule “lead” builds away from the original fragment and stregnthen the contact with upper surface and then grows into an adjacent pocket (Rees et al., 2004).
The second approach is fragment linking (figure 1.5), where two or more fragments that are identified to bind to separate but proximal parts of the binding site are chemically linked together to achieve a super additivity effect. The joined molecule is larger with a higher affinity binding. For this process to be efficient, not only the starting fragments need to be identified, but also a process by which these fragments can be appropriately linked in an efficient way.
Figure 1.5: Diagram illustrating fragment linking approach. (a) Fragment 1 binds one part of
26 The third approach is fragment self-assembly (figure 1.6), where fragments with complementary functional groups are able to react together (self-assemble), in the presence of the protein target (the template molecule). The template protein, without being covalently bound to the inhibitor, contributes to the self-selection and catalyses the synthesis of its own inhibitor (Rees et al., 2004). This self-screening helps accelerating the identification of lead compounds for drug discovery (Ramström and Lehn, 2002).
Figure 1.6: Schematic illustration of fragment self-assembly approach. (a) Fragments 1 and 2
bind to receptor sites at the same time. The two fragments possess proximal groups that are able to react with each other in the presence of the template molecule. (b) The resulting lead molecule is formed in the active site (Rees et al., 2004).
27 reactions, virtually embraces all possible combinations allowing the generation of virtual combinatorial libraries (figure 1.7) (Ramström and Lehn, 2002).
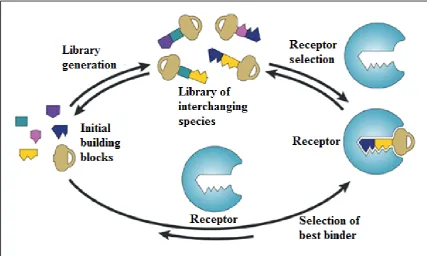
Figure 1.7: Diagram illustrating the concepts behind dynamic combinatorial chemistry and virtual combinatorial libraries. A true dynamic library of interchanging ligands is represented with 'keys' at the top of the diagram. These keys are created through reversible exchange of a limited number of initial key building blocks. In the presence of a receptor (a molecular 'lock') the best binder is selected. The library is then forced to rearrange in a way such as more species of this ‘key’ member are produced. The bottom of the diagram describes the establishment of a virtual combinatorial library, the components of which become detectable only in the presence of a template receptor (selector) (Ramström and Lehn, 2002).
[image:29.595.87.515.124.380.2]28 affinity). This may include selectivity, cell based activity, oral activity or efficacy (Rees et al., 2004).
Figure 1.8: Diagram illustrating fragment optimisation approach. (a) Lead molecule 1 as
discovered by fragment-based approach. (b) Lead molecule 3 resulting from modification of the overall physical properties of lead molecule 1 with aim of improving a particular property.
1.7. Fragment library design
1.7.1. Fragments key properties
Drugs that pass through the fragment optimisation stage undergo years of intensive toxicological and clinical-efficacy studies. If successful, the drugs are then, finally, accepted by regulatory and paying bodies. Most drug candidates that survive those stages have a set of physico-chemical key properties that fall within a certain ‘drug-like space’. A number of cut-off values have been used to define such a space, most importantly the values highlighted by the medicinal chemist Christopher Lipinski and his colleagues in the ‘rule of five’ (Hughes et al., 2008; Luker et al., 2011).
29 metabolism, and excretion properties (Lipinski et al., 1997). According to this rule, a compound intended for oral delivery must have no more than five hydrogen-bond donors (OH and NH groups), a maximum of ten hydrogen-bond acceptors (notably N and O), a molecular mass less than 500 Dalton, and a partition coefficient LogP (a measure of the molecule’s lipophilicity) under five. The origin of the rule’s name “Five” is from the fact that all numbers in the rule are multiples of five (Rees et al., 2004; Goddette, 2006). Lipinski’s rules have been enhanced by more recent analysis. According to these analyses the number of rotatable bonds (NROT) is an important parameter where an upper limit of seven rotatable bonds is optimal for oral bioavailability (Rees et al., 2004). Another key property (rule) is the polar surface area (PSA) which it is thought that molecules that are passively absorbed with a PSA of 110-140 Å2 have a low oral bioavailability (Congreve et al., 2003a). In the light of these considerations, studies indicate that fragments seem to obey a “Rule of 3”. In this rule, as proposed by Astex Therapeutics, molecular weight is < 300 Dalton, ClogP ≤ 3, H-bond donors < 3, hydrogen bond acceptors < 3, NROT < 3, and a total polar surface area (TPSA) < 60Å2 (Goddette, 2006). This “Rule of 3” could be a useful selection tool when building fragment libraries for efficient lead discovery (Congreve et al., 2003a).
1.7.2. Library design
Fragments chosen in this research are “Rule of 3” compliant and a lower limit of 150 Da for
30 aqueous buffer due to their low binding affinity. It can be difficult to predict the solubility of the fragment in crystallisation experiments (Jacoby et al., 2003; Baurin et al., 2004; Lepre, 2001). Water solubility can be estimated by applying cut off values based on experience for predictable properties such as CLogP and the number of H-bond donors and acceptors (Siegal et al., 2007). There is no simple correlation between water solubility, number of H-bond donors and number of H-bond-acceptors. The absence of robust computational methods means one must determine the solubility of a given fragment experimentally (Baurin et al., 2004). Furthermore, it is preferable that the fragment possesses a chemical “handle” for further elaboration, but should not be too reactive to avoid a covalent with the protein target (Siegal et al., 2007).
The above analysis addresses the “property space” of the fragment. A further analysis is needed to select fragments with a good chance to bind to a target protein. For example, the chemical tractability of the fragment can be analysed, where the presence of linker functionality is required. Building blocks such as those used in combinatorial chemistry could be suitable fragments. This approach can be further elaborated by using masked linker groups.
31
1.7.3. Quantitative estimate of drug-likeness (QED) score
The pharmaceutical industry is facing productivity challenges due to the low number of new drug approvals relative to the high costs of research and development investment. The high attrition rate (96%) of compounds that enter clinical trials puts pressure on scientists to improve the quality of target for this industry to survive in the longer term (Bunnage, 2011).
Hopkins and colleagues contributed to the enhancement of guidelines for drug-likeness by providing a quantitative estimate that analyses a combination of a molecule’s physical properties. Their approach allows ranking molecules in order of desirability by defining a single, continuous scale. Desirability functions were defined for eight physical properties. This includes the number of groups in the molecule known to cause toxicity, the number of aromatic rings, the polar surface area and the number of rotatable bonds in a molecule. The four Lipinski properties were also taken into account. The functions encompass the full distribution of each physical property and generate a scale of continuous quantitative estimate of drug-likeness (QED) from most to least drug-like (Bickerton, 2012). By computing drug-likeness on a single quantitative scale, this method offers a “holistic” and more balanced analysis than other approaches (Leeson, 2012).
1.8. Screening techniques
1.8.1. X-ray crystallography
32 developed into clinical candidates. The method has seen many improvements in the area of protein production and crystallisation, as well as the degree of automation associated with crystal manipulation (Nienaber et al., 2000). This method consists of soaking a crystal of the target protein with a cocktail of fragments, for a period of time between one to twenty-four hours. The solubility of the fragments and the stability of the protein must be verified in the soaking solution. After soaking, the X-ray structure is obtained and compared with the structure of the original protein. Hits can be identified by looking at the differences between the electron density maps (Bosch et al., 2006). One of the limitations of X-ray crystallography is that it is time-consuming compared to other technologies, but the main limitation is that the target protein must form suitable crystals for X-ray analysis, which makes it impossible for some proteins of interest to be studied using this technique (Bartoli et al., 2006). Once the fragments are found, their binding mode to the protein can be visualised immediately, which is the main advantage of X-ray crystallography. This information can then be used as a guide in the optimisation stage of the fragment following the approaches described before (Howard et al., 2006).
1.8.2. Surface plasmon resonance (SPR)
33 between materials with negative and positive permittivities such as a metal-dielectric layer (Neumann et al., 2007; Daghestani and Day, 2010). The SPR phenomenon occurs when SPs are resonantly excited by coupling polarised light to the sensor to which target molecules are immobilised and addressed by ligands in a mobile phase (Rees et al., 2004; Neumann et al., 2007; Daghestani and Day, 2010).The light’s wave vector component parallel to the metal
surface needs to match that of the SPs, for this phenomenon to happen. The resonance
condition is only satisfied at distinct angles of incidence, which appear as a drop in the
reflectivity of incident light (Novotny and Hecht, 2006; Homola, 2003; Daghestani and Day, 2010). Changes on the dielectric sensing surface, due to binding to the immobilised target for example, will cause a shift in the angle of reflectivity, followed by a detector, in order to satisfy
34
Figure 1.9: Diagram of a surface plasmon resonance biosensor (Kretchmann configuration).
35
Figure 1.10: Detection of binding events during the SPR experiment. Changes in the angle of
reflectivity that satisfies the resonance condition occur as the mobile analyte starts to flow over the sensing layer and bind to the immobilised substrate. These changes continue to occur until a level of saturation is reached and all binding sites are occupied. The angle of the detector returns back to baseline as the analyte completely dissociates from the substrate (Daghestani and Day, 2010).
This binding experiment consists of two phases. In the first one, the soluble analyte (ligand) binds to the protein immobilised component, whereas in the second one the analyte dissociates upon rinsing with analyte free solution. The apparent rate constants for the association and dissociation phases of the reaction can then be calculated by fitting kinetics from these two phases to appropriate binding models. The apparent equilibrium constant is then deduced from the ratio of these values, describing the “binding affinity” (Neumann et al., 2007).
36 progress of the interaction (figure 1.11). The response may be absolute above a fixed zero point or relative to the response at another specified report point.
Figure 1.11: Schematic illustration of a sensogram (Taken from the Sensor Surface
Handbook).
37
Figure 1.12: The three different approaches used to attach biomolecules to the surface of a
sensor chip (Taken from the Sensor Surface Handbook)
38
1.8.3. Nuclear magnetic resonance spectroscopy (NMR)
1.8.3.1. NMR in drug discovery
NMR techniques can be incorporated into different stages of the drug discovery process. These stages, although may overlap, can be classified into hit finding, hit validation and hit optimisation. In general, the more advanced is the drug discovery process, the more complex are the NMR techniques needed. In hit finding, where the library size is relatively large, 1D ligand-based experiments such as Saturation Transfer Difference (STD), are most favourable because they allow high throughput as well as a reduced experimental time, and the time for sample preparation. Data analysis and interpretation are relatively easy and quick. Consequently, labelled samples, target-consuming and lengthy 2D/3D experiments are unfavourable at this early stage. In hit validation, the library size is considerably reduced after the primary screen. At this stage, the aim is to exclude false positives arising from non-specific binding, changes in the pH, aggregation, and chemical reactions with the drug target. This can be achieved by using target-based NMR experiments such as chemical shift mapping. In hit optimisation the extracted true binders from the hit validation stage are assessed, ranked and clustered according to properties such as solubility, molecular weight, chemical accessibility, and affinities. The exact binding site (especially if more than one) and binding mode have to be identified. In this phase, for example, ligands for different binding sites can be linked to achieve an increase in their binding affinity (Klages et al., 2007).
1.8.3.2. General features
39 small ligand adopts the magnetic properties of the target to which it binds to. It is, therefore, a strict requirement for these experiments to distinguish between the ligands (library compounds) and the target (protein, DNA or RNA). This distinction can be achieved through two main methods. The first one is based on the difference in molecular masses between target and ligands where the latter needs to be considerably smaller than the target. A number of NMR parameters depend on the molecule’s rotational and translational diffusion rates which are molecular mass dependent. One of the parameters that depend on the rotational diffusion rate is the transverse relaxation of the NMR signal, where rapidly tumbling ligands relax at a slower rate than the large, slowly tumbling target. Ligands can be distinguished from the target by their narrow lines, given that the linewidth is inversly related to the transverse relaxation rate. Added to this, comparably broad signals from the target can be minimized using suppression filters. Relaxation-related parameters also include the nuclear Overhauser effect (NOE) (homonuclear, 1H-1H), which is also rotational diffusion rate dependent. Large molecules show a negative enhancement and small molecules show a positive one. The use of relaxation- and /or diffusion-based filters involves the suppression of the ligand or target NMR signals, which places affinity limits on the techniques used (Klages et al., 2007; Jhoti et al., 2007).
40 signals from the unwanted component, providing the techniques involved with wider affinity range.
1.8.3.3. Ligand-based vs. target-based NMR spectroscopy
There are two classes of NMR screening. The first one is the target detected method, where the effects of the binding ligand on the target NMR spectra are observed, whereas in the second one, the changes induced in the ligand NMR signals by binding to a large target are detected. Examples of the taget-based and ligand-based NMR experiments are shown in figures 1.13 and 1.14, respectively.
Because the ligand and the target interact in aqueous solution, the ligands have to be soluble in water to prevent their aggregation effect that may lead to a false positive in the screening process (Klages et al., 2007). The effective molecular mass is increased by compound (ligand) aggregation, which drives the effective overall rotational correlation time (τc) upward and amplifies the corresponding relaxation parameter. The increase in τc and the enhancement of the corresponding relaxation parameter is also a consequence of ligand binding to large receptor molecule, which explains the false positive effect arising from ligand aggregation
(Lepre et al., 2004).
41 limited to low and medium binding affinities with dissociation constant, Kd, values ranging
between 0.1 µM and 1 mM (Webb, 2006).
On the other hand, false positives may result from non-specific binding. In the target based approach, however, not only ligands binding with an affinity higher than 0.1 µM are detectable, but the distinction between specific and non-specific binding is easier (Lepre et al., 2004). It is also possible to exclude effects caused by aggregation and changes in pH. More importantly, structural information on the ligand target complex can be extracted from the spectra. This approach, however, requires larger amounts of the protein target (0.1-1 mM). It is rather a time-consuming process making use of two-dimensional (2D) spectra. Target proteins, usually isotope labelled, have a restricted size to a maximum molecular weight of 100kDa (Klages et al., 2007). Labelling depends on the molecular weight of the target because of the need to sequentially assign the proteins (Lepre et al., 2004). Large proteins may require 13C labelling whereas a uniform 15N labelling is sufficient for the small ones (Klages et al., 2007; Jhoti et al., 2007).
1.8.3.4. Chemical shift mapping
43
Figure 1.13: Example of a target-based NMR binding experiment. The 15N-HSQC spectra for
44
Figure 1.14: Example of a ligand-based NMR binding experiment which involves the use of
1
H line broadening to detect binding. Shown are 1H NOESY spectra of two compounds in a mixture in the absence (top trace) and presence (bottom trace) of the catalytic domain of p38 MAP kinase. Broad protein resonances were attenuated using relaxation filter. Resonances from 2-phenoxybenzoic acid (top right structure) and nicotinic acid (top left structure) are marked with dashed and solid arrows, respectively. There are overlapping resonances from both compounds showing at the peak at 7.2 ppm. Line broadening, suppression of fine structure, and attenuation of ligand resonance peak height due to the relaxation filter in the bottom spectrum indicate 2-phenoxybenzoic acid binds to p38, while nicotinic acid does not (Peng et al., 2001).
45 Other biophysical fragment screening techniques include isothermal titration calorimetry, mass spectrometry, thermal electrophoresis, capillary electrophoresis and differential scanning fluorimetry. There is no single technique that is suitable for all targets or compounds, which often require multiple methods to be deployed (Murray et al., 2012). Differential scanning fluorimetry (DSF) is discussed in Section 2.1.
1.9. Examples of drugs originating from FBDD
Examples of cases where FBDD has been successfully applied to a particular target are cumulating. This approach is continuously yielding drugs that are currently in different stages of clinical trials and even on the market (Baker, 2013). In 2011, Vemurafenib was approved as drug for metastatic melanoma. It only took six years for this drug to be marketed after scientists at Plexxikon started searching for low-molecular-mass hits against kinases, in 2005.
In December 2012, a drug identified by Merk, known as MK-8931, entered Phase II/III clinical trials for Alzheimer's disease, which is a disease area in which there have recently been big deceptions in late-stage clinical trials. MK-8931, an inhibitor of the protease β-secretase 1 (BACE1), derived from a small molecule which made interactions of only micromolar range affinity with the enzyme’s shallow binding pocket. This shallow pocket is one of the reasons that makes this target a challenging one. The small molecule was then built up into a drug candidate using structural information to acquire the physicochemical properties required to cross the blood-brain barrier.
46 information. Although a relatively bigger molecule, Navitoclax disrupts a protein–protein interactions which is a difficult category of targets.
AT13387 is a drug currently in phase II clinical trials for gastrointestinal stromal tumours. The drug was identified by Astex starting from a 223 Da fragment with an affinity in the micromolar range for heat shock protein 90 (Hsp90). Subsequent structure based design which involved the synthesis of 169 compounds resulted in a final candidate with a million-fold boost in potency.
47
Table 1.1: Examples of compounds currently in clinical trials originating from fragment based
48
1.9.1. The application of FBDD to Hsp90 protein
FBDD was applied to the chaperone Heat shock protein 90 (Hsp90a) using a combination of NMR and high throughput X-ray crystallography (Murray et al., 2010). Molecular chaperones are involved in the conformational stability, maturation, and function of other substrate proteins called clients (Bukau et al., 2006). Many of Hsp90 “clients” are oncology targets that are heavily involved in cancer progression, which makes the inhibitors of this chaperone potential chemotherapeutic agents in cancer (Workman et al., 2007; Whitesell and Lindquist, 2005). The Hsp90 function involves the turnover of ATP to ADP via an ATPase activity linked to the N-terminal domain of this protein (Pearl and Prodromou, 2006). The ATP binding site has been characterised crystallographically, and the binding modes of many of the Hsp90 inhibitors have been identified (Pearl and Prodromou, 2006). It has been shown that this inhibition results in the down-regulation of Hsp90 client proteins and antiproliferative activity (Vilenchik et al., 2004).
49 ADP was increased by adding 5 mM Mg2+ to the screening solution, which leads to the displacement of fragments that weakly bind to the nucleotide site (Murray et al., 2010).
Analysis of the NMR data resulted in 125 compounds progressing into further screening by X-ray crystallography, using both soaking and co-crystallisation experiments. Crystal structures were obtained from a total of 26 of these fragments. The chemical structures for four of the validated hits are shown in figure 1.15. Isothermal titration calorimetry was used to determine dissociation constants to describe all binding affinities in this example (Murray et al., 2010).
50
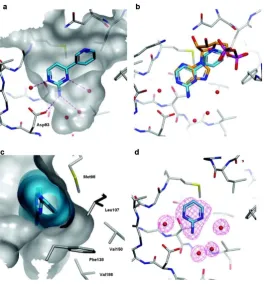
Figure 1.16: Binding mode of aminopyrimidine fragments in Hsp90. (a) The crystal structure
of Hsp90 with compound 1. The bond connecting the pyridine to the pyrimidine is heavily twisted. (b) The crystallographic overlays of compound 1 and ADP show that the interactions with Hsp90 are of a conserved nature. (c) Complex structure of compound 1 and Hsp90 showing that the proximal lipophilic pocket on the middle-right-hand side of the protein surface is poorly filled by ligand surface (cyan) and is not occupied by water molecules. (d) F
o
− F
c electron density map contoured at 4σ for compound 2.
1.9.1.1 Optimisation of aminopyrimidines starting from fragment 1
51 binding affinity could be improved through the stabilisation of the protein-bound conformation. The second one is that the proximal lipophilic pocket that is formed by the lipophilic side chains of Met98, Leu107, Phe138, Val150, and Val186 (figure 1.16c) is poorly filled by the fragment which explains the need to improve the hydrophobic fit in this region (Murray et al., 2010).
The first step in the optimisation of fragment 1 was the virtual screening of close analogues, which lead to the purchase of the simple chloro analogue, compound 5. The latter showed a 100-fold improvement in affinity. The next step involved the synthesis of analogues of compound 5 by substitution with small groups at positions 2 and/or 6 of the upper phenyl ring with the aim of stabilising the twist observed in the X-ray structure and filling the proximal lipophilic pocket. The synthesis resulted in analogues 6, 7, 8 and 9, with compound 9 being the most ligand efficient molecule. Thus, the next iteration was based on compound 9 where further substitutions of the upper phenyl ring with small groups at positions 4 and/or 5 took place, with the aim of facilitating more lipophilic interactions with the enzyme and allow the introduction of solubilising groups to improve cell activity. This process resulted in compound 14 which could be a potential lead molecule against Hsp90 (figure 1.17) (Murray et al., 2010). Tables 1 and 2 give data and chemical structures for the aminopyrimidines covered in this section. The tables give dissociation constants obtained with isothermal titration calorimetry, and the cell IC50 values reflect the inhibition of HCT116 cell proliferation.
52
Table 1.2: Potency of the aminopyrimidines enhanced by substitution with small groups at R2
and R6.
53
Figure 1.17: Crystallographic superimposition of compound 14 (in cyan) with the original
compound 1 (in orange) from which it has derived. The original binding mode of the fragment is conserved in the final complex (Murray et al., 2010).
1.9.1.2. Optimization of phenols starting from fragment 3
The binding mode of the phenol compound 3 is described in figure 1.18. The first steps in the optimisation of fragment 3 involved the synthesis of the Chloro (15), ethyl (16), isopropyl (17), and tert-butyl (18) analogues, with compound 18 and 17 showing 100-fold improvment in potency (table 1.4).
54 compounds 19 and 20 were synthesised, but resulted in an approximately 10-fold decrease in potency compared to the corresponding 4-OH substituted compounds (table 1.4).
The next synthetic iteration investigated a selection of amides to replace the diethylamide in compound 18. The X-ray structure indicated the importance of the carbonyl group which forms a direct hydrogen bond with the side chain of Thr184 and a strong water-mediated hydrogen bond with Asp93 (figure 1.18a). The torsion between the carbonyl and phenyl ring is highly twisted, and the torsion is stabilised by the tertiary nature of the amide. The design therefore focused on tertiary amides. Compounds 21 to 26 were prepared, with 24 showing an increase in affinity of several-hundred-fold.
The next change consisted combining the best amides from the previous step with the isopropyl group, which involved the synthesis of compounds 27, 28, and 29. The change to the isopropyl group resulted in an enhanced affinity and also reduced lipophilicity.
55
Figure 1.18: Binding mode of phenol fragment 3 in Hsp90. (a) Compound 3 forms hydrogen
56
57
Figure 1.19: (a) Structure for the original compound 3 together with the lead molecule 31. (b)
Crystallographic superimposition of lead molecule 31 (in cyan) and fragment 3 (in orange) from which it was derived. The lead molecule is over one million times more potent than the fragment (Murray et al., 2010).
The final lead in the two cases of fragment to lead campaigns described above i.e. the optimisation of aminopyrimidines starting from fragment 1 and the optimisation of phenols starting from fragment 3 has a molecular weight of approximately 300 Da which allows the optimisation of non-potency related properties without the risk of having the final clinical candidate lying outside the “druglike space”. This is mainly due to the groups added during the optimisation stage, which are considered to be the most efficient groups ever reported (Verdonk and Rees, 2008).
58 efficiency have been identified. Woodhead et al. (2010) describe how the resorcinol lead was converted into a compound that is currently in clinical trials for the treatment of cancer.
59
Figure 1.20: (a) Compound 35 structure. (b) Crystal structure for compound 35 and Hsp90
complex. The key binding features are identical to those of lead compound 31 (Woodhead et al., 2010).
This example illustrates three concepts important to FBDD. The first one is that the fragments are of low molecular weight with low binding affinities (>100 μM). Despite the latter, the
60
1.10. Aim of this study
61
CHAPTER TWO
The application of Differential Scanning Fluorimetry (DSF) to detect ligands that bind
62 The aim of this chapter is to evaluate the application of differential scanning fluorimetry (DSF) approach to detect ligands that bind and stabilize RmlA protein. The thermal unfolding of RmlA was monitored in the presence and absence of 500 compounds individually. The experiment was performed using a real-time PCR instrument in the presence of the fluorescent dye SYPRO orange. The opening section discusses the theoretical background of the DSF approach with an overview of the key advantages of the technique and where it stands compared to other fragment screening methods. It then describes the materials and method implemented to carry out the screening stage. That includes the overexpression and purification of the protein, a description of the library used and the experimental set up of the DSF approach. Next, it discusses the effect of the fragments tested on the protein’s stability. Finally the chapter concludes by reviewing the results obtained and looking into other ways of how to test those compounds further and alternative techniques that could be used to test the library.
2.1 Introduction
Protein thermal stability testing, also known as thermofluor (TF) or differential scanning fluorimetry (DSF) (Ericsson et al., 2006; Niesen et al., 2007) , is based on the measurement of the increase in the thermal stability of the protein induced by ligand binding. The approach consists of applying gradually increasing temperature on purified proteins, in the presence and absence of a ligand. The protein melting temperature is defined as (Tm), which is known as the
midpoint of the protein unfolding position. The Tm value (the inflection point of the transition
curve, figure 2.1), can be calculated using the following equation, derived from the Boltzman equation:
( )
63 where “LL” and “UL” are the values of minimum and maximum intensities, respectively, “a” denotes the slope of the curve within Tm , “y” and “x” denote the fluorescence intensity and the
temperature, respectively (Vedadi et al., 2006; Cummings et al., 2006; Niesen et al, 2007).
In the DSF approach an “environmentally sensitive” dye which specifically interacts with non-native protein is used as an indicator to observe the amount of unfolded protein in solution as a function of temperature (Mezzasalma et al., 2007; Cummings et al., 2006). This is achieved by measuring the fluorescence from the dye which results from the changes in the dye’s emission properties upon interaction with unfolded protein (Vedadi et al., 2006). DSF uses a number of fluorescent dyes which differ in their optical properties. The dyes’ fluorescence is quenched in
an aqueous solution, whereas in non-polar environment, such as the hydrophobic sites on unfolded proteins, the fluorescence intensity becomes significantly higher. With a high signal to noise ratio, SYPRO orange is currently the dye with most favourable properties for this approach. It has a relatively high wavelength for excitation (near 500 nm) which reduces the chances of any small molecule causing its fluorescence intensity to quench and therefore interfering with its optical properties (Niesen et al., 2007). The emission wavelength of SYPRO orange is near 600nm (Niesen et al., 2007). Some proteins may show no unfolding transition when analyzed using SYPRO orange, in which case an alternative dye should be tested. The molecular structure of SYPRO orange is not disclosed, (symbolized as a three-ring aromatic molecule in figure 2.1) (Niesen et al., 2007).
Most ligands that bind specifically to the native protein will increase the Tm, and a temperature
shift (∆Tm) between the protein’s melting temperatures in the two conditions is observed and
64 aggregation which destabilises the protein tertiary structure and do not test positively in DSF (Cummings et al., 2006).
SYPRO orange Protein
Exposure of hydrophobic parts as protein
unfolds
Gradual removal of protein from solution
due to precipitation and aggregation
Strong fluorescent light of 610 nm emitted by the dye molecules bound to
non-polar parts
Excitation of a basic fluorescence intensity
by light of 492 nm
Figure 2.1: fluorescence intensity plotted as a function of temperature for the unfolding of
protein (citrate synthase). The plot has a sigmoidal shape which is illustrated by a two-state transition depicted in this figure. The lower level (LL) and upper lever (UL) of the fluorescence intensity defined by equation 2.1 are also demonstrated here (figure taken and modified from Niesen et al, 2007).
65 be measured. It is possible to screen for compounds with expected affinity (KD) between 1 nM
and 1 mM. However, varying protein and compound concentrations is frequently necessary. For example, higher concentration may be required for compounds that bind with relatively low affinity, such as nucleotides. Also, it can be sometimes necessary to increase protein concentration to obtain an acceptable signal-to-noise ratio (Niesen et al, 2007).
It also provides additional information on the ligand’s binding mechanism, making it possible to distinguish protein stabilizers from protein destabiliseers. Another main advantage of the approach is that it is applicable to different stages of the screening process, from primary screening to hit profiling. It is also a useful selection tool of protein constructs for use in screening and X-ray crystallography (Cummings et al., 2006). DSF also plays an important role in the expression and purification of proteins since it allows the detection of a specific ligand that improves the protein stability and hence decreases its potency to unfold and reduces the chances of its aggregation and susceptibility to proteolysis (Vedadi et al., 2006).
The DSF approach has limitations that are known to make it difficult to calculate the Tm value.
66
2.2. Materials and methods
2.2.1. E. coli BL21 competent cells preparation
Luria-Bertani (LB) Agar plates were streaked with BL21 E. coli cells (glycerol stock). The cells were grown overnight at 37 oC. After that, a single colony was placed in 10 ml LB media and left to grow overnight at 37 oC with shaking. One ml of overnight culture was used to inoculate 100 ml LB (1/100 volume) in 500 ml flask. The flask was incubated at 37 C (250 rpm), with shaking for two hours until OD600 approximately reached 0.4. The rest of the
overnight culture was stored as glycerol stock (50 % v/v glycerol) at - 80 C until required.
The cells were transferred into two pre-chilled centrifuge tubes (50 ml), and placed to chill on ice for 30 minutes. Cells were then centrifuged at 2800 rpm, for five minutes, at 4 C. Each pellet was resuspended in 12.5 ml 100 mM calcium chloride and 12.5 ml 40 mM magnesium sulfate (both pre-chilled on ice).
The resuspended cells were left to chill on ice for a further 30 minutes before they were centrifuged again at 2800 rpm, for five minutes, at 4 C. After that, the resulting pellets were resuspended each in 2.5 ml 100 mM calcium chloride and 2.5 ml 40 mM magnesium sulfate. Pre-chilled autoclaved glycerol was added to 10% total volume. The cells were placed into small fractions (250 L aliquots) before they were frozen on dry ice and stored at – 80 C until
usage.
2.2.2. Genetic transformation of competent cells
50 l of competent cells were first thawed on ice. After that, 1 l of RmlA plasmid was added
67 heatshock for 45 seconds at 42 C (waterbath). The cells were then incubated on ice for two minutes and transferred into an incubator at 37 C with shaking for one hour.
Cells were then plated on selective media and grown overnight at 37 oC. The overnight culture was stored as glycerol stock (50 % v/v glycerol) at -80 C until required.
The plasmid encoding for RmlA from P. aeruginosa contains a sequence coding for a 6 His-tag on the N-terminus of RmlA to allow an easy purification on metal-chelating columns. The amino acid sequence for the RmlA construct is as follows:
HHHHHHGSMAMKRKGIILAGGSGTRLHPATLAISKQLLPVYDKPMIYYPLSTLMLAGI REILIISTPQDTPRFQQLLGDGSNWGLDLQYAVQPSPDGLAQAFLIGESFIGNDLSALVL GDNLYYGHDFHELLGSASQRQTGASVFAYHVLDPERYGVVEFDQGGKAISLEEKPLEP KSNYAVTGLYFYDQQVVDIARDLKPSPRGELEITDVNRAYLERGQLSVEIMGRGYAW LDTGTHDSLLEAGQFIATLENRQGLKVACPEEIAYRQKWIDAAQLEKLAAPLAKNGY GQYLKRLLTETVY
2.2.3. RmlA overexpression and purification
In order to overexpress RmlA, E. coli BL21 competent cells transformed with the plasmid were grown at 37 C in LB medium containing 100 μg/ml ampicillin until the OD600 reached 0.6 ±
68 incubation at room temperature, Ethylenediaminetetraacetic acid (EDTA) free protease cocktail inhibitor tablet (Roche) and DNase I (20 μg/ml) were added. The viscosity of the mixture was further decreased by sonication (seven cycles of one minute interrupted by one minute period on ice). The resulting lysate was centrifuged at 20,000 g for 20 minutes at 4 C to remove particulate matter.
The supernant was collected and applied, using a syringe, to a 5 ml HiTrapTM FF column (GE
Healthcare) pre-loaded with 0.1 M nickel sulfate and pre-equilibrated with buffer (20 mM Tris-HCl, pH 8.0, 500 mM sodium chloride).
The column was washed firstly with 20 column volumes of buffer containing 10 mM imidazole and followed by 30 column volumes of buffer containing 30 mM imidazole to remove non-specifically bound, histidine-rich proteins. RmlA protein was eluted with 15 column volumes of buffer containing 500 mM imidazole. Purity was assessed by SDS-PAGE (figure 2.2).
69
Lysate Molecular Weight
Marker (kDa)
14.4 20.1 30.0 43.0 67.0 94.0
Elution fractions (2-13) from Ni column purification of RmlA
1 2 3 4 5 6 7 8 9 10 11 12 13 14
Figure 2.2: SDS-PAGE gel showing the elution fractions of RmlA during the purification
70
Figure 2.3: The gel filtration profile shows two peaks. The large symmetrical and sharp peak
was verified as RmlA by mass spectrometry. This column was not calibrated. However, since RmlA from P. aeruginosa was known to be a tetramer (Blankenfeldt et al., 2000a; Blankenfeldt et al., 2000b) and in this project crystallised as a tetramer it was assumed this peak corresponds to a tetramer1.
1
71
2.2.4. The identification of the protein by Mass Spectrometry
The identity of the protein was confirmed by mass spectrometry following the in-gel digestion protocol. A band corresponding to RmlA was excised from the SDS-PAGE gel (figure 2.2) stained with Coomassie blue. The excision was as close to the boundary of the stain as possible, in a way as to minimise keratin contamination. The sample was submitted to the
Mass Spectrometry and Proteomics Facility at the University of St Andrews, where it was
reduced, alkylated and digested using the Genomic Solutions ProGest protein digestion station. Both MS and MSMS analyses were provided by the AB Sciex MALDI-TOF instrument. The sample was then processed using MASCOT, whereby mass spectra were matched against the NCBI database.
Analysis of the gel sample resulted in an unequivocal definition of the protein as RmlA, with a sequence coverage of 70% and a high score match of 1140 to Q9HU22 ( Glucose-1-phosphate thymidylyltransferase – P. aeruginosa ). Matched peptides are shown in bold red below.
1 MKRKGIILAG GSGTRLHPAT LAISKQLLPV YDKPMIYYPL STLMLAGIRE
51 ILIISTPQDT PRFQQLLGDG SNWGLDLQYA VQPSPDGLAQ AFLIGESFIG
101 NDLSALVLGD NLYYGHDFHE LLGSASQRQT GASVFAYHVL DPERYGVVEF
151 DQGGKAISLE EKPLEPKSNY AVTGLYFYDQ QVVDIARDLK PSPRGELEIT
201 DVNRAYLERG QLSVEIMGRG YAWLDTGTHD SLLEAGQFIA TLENRQGLKV
72
Figure 2.4: RmlA MS spectrum showing that most peaks (red) match to that of the RmlA
[image:74.595.108.497.54.688.2]73
2.2.5. Fragment library
A 500 compound fragment library at 25 micromole each, in 96-loose well Matrix plates was purchased from Maybridge. The powder compounds were dissolved in the appropriate volume of DMSO to give stock solutions equal concentrations of 150 mM.
This fragment library is “Rule of 3” compliant. In this rule, as proposed by Astex Therapeutics, molecular weight is < 300 Da, ClogP ≤ 3, H-bond donors < 3, hydrogen bond acceptors < 3, NROT < 3, and a total polar surface area TPSA < 60 Å2 (Goddette, 2006). This “Rule of Three” could be a useful selection tool when building fragment libraries for efficient lead discovery (Congreve et al., 2003a). The fragments are quantifiably diverse through the application of industry standard chemometrics. They are also pharmocophorically rich with the inclusion of many unique Maybridge heterocycles. The purity of the fragments is high, exceeding 95%, with an assured aqueous solubility (ALogGPS – with outliers confirmed by actual solubility measurement). See list of compounds in Appendix A.
2.2.6. DSF experimental setup
75
1 2 3 4 5 6 7 8 9 10 11 12
A 3.A1 3.A1 3.A2 3.A2 3.A3 3.A3 3.A4 3.A4 3.A5 3.A5 3.A6 3.A6
B 3.B1 3.B1 3.B2 3.B2 3.B3 3.B3 3.B4 3.B4 3.B5 3.B5 3.B6 3.B6
C 3.C1 3.C1 3.C2 3.C2 3.C3 3.C3 3.C4 3.C4 3.C5 3.C5 3.C6 3.C6
D 3.D1 3.D1 3.D2 3.D2 3.D3 3.D3 3.D4 3.D4 3.D5 3.D5 3.D6 3.D6
E 3.E1 3.E1 3.E2 3.E2 3.E3 3.E3 3.E4 3.E4 3.E5 3.E5 reference reference
F 3.F1 3.F1 3.F2 3.F2 3.F3 3.F3 3.F4 3.F4 3.F5 3.F5 reference reference
G 3.G1 3.G1 3.G2 3.G2 3.G3 3.G3 3.G4 3.G4 3.G5 3.G5 reference reference
[image:77.595.67.544.54.368.2]H 3.H1 3.H1 3.H2 3.H2 3.H3 3.H3 3.H4 3.H4 3.H5 3.H5 reference reference
Figure 2.5: Diagram illustrating the 96-well thin wall PCR plate setup. In each plate there are
eight reference wells (coloured in purple). The rest of the wells illustrate the way the compounds from the first half of the 96-well library “plate 3” (as purchased) were laid out in the 96-well thin wall PCR plate (the experimental plate). As shown in the diagram each compound was tested twice within the same experimental plate. For example compound in position A1 in plate 3 of the library “3.A1” was dispensed into wells A1 and A2 into the experimental plate.
2.2.7. Analysis of thermal shift data
For each well solution, the temperature midpoint for the protein unfolding transition, Tm, was