Corporate Social Responsibility and
Shareholder Proposals
Erwin Eding
a& Bert Scholtens
a,b,cWe study how corporate social responsibility relates to investors, firms and shareholder
proposals. We examine shareholder proposals on environmental, social, and governance
issues at the annual general meeting of shareholders with US Fortune 250 firms during
2011-2014. We find that especially the probability of receiving shareholder proposals on
environmental issues is positively associated with responsible institutional ownership. We
find no systematic evidence that the outperformance regarding social responsibility of the
firms themselves would significantly matter regarding the likelihood of shareholders filing
proposals about corporate social responsibility, except for employee well-being.
JEL codes: G32; G34; M14
Keywords: Shareholder proposals; Corporate social responsibility; Socially responsible
investing; Institutional investors; UN PRI
a
Department of Finance, Faculty of Economics and Business, University of Groningen, The Netherlands
b
School of Management, University of Saint Andrews, Scotland, UK c
1. Introduction
How is corporate social responsibility related to firms, investors and shareholder proposals? We investigate whether the responsibility of a firm and its investors can be associated with the probability of the firm receiving a shareholder proposal on environmental, social or governance issues. Corporate social responsibility (CSR) concerns the social, ethical and environmental behavior of a firm as well as its governance that goes beyond any legal obligations (Escrig-Olmig et al., 2017; Danilovic et al., 2015; Baumgartner, 2014; Eccles, Ioannou and Serafeim 2014; Kitzmueller and Shimshack 2012; Lucas, 2010; Fougère and Solitander, 2009; Dahlsrud, 2008). Increasingly, investors engage with socially responsible investing (SRI). As such, they try to account for environmental, ethical, social and governance characteristics of their investment objects (Al-Najjar and Anfimadou, 2012; Escrig-Olmig et al., 2011; White, 1996).
In particular, shareholder engagement is used to pressure companies to take on environmental, social, or governance activities (see Dimson et al. 2015; Weinstein et al., 2015; Schooley, Renner and Allen 2010; González-Benito and González-Benito, 2008; Welford, 2007; O’Rourke, 2003; Halme and Niskanen, 2001). Karpoff et al. (1996) find that shareholder engagement, in the form of
CSR performance and being subject to CSR related shareholder proposals at the annual general meeting (AGM) of shareholders. Second, whether having responsible institutional investors is to be associated with the firm being targeted by proposals on CSR issues at the AGM. As such, we complement the analysis of Karpoff et al. (1996) and Schooley et al. (2010) by focusing on environment, social and governance proposals and we expand the analysis of Flammer (2015) by accounting for investors’ responsibility within the context of CSR shareholder proposals. This would allow us to account for both firm and shareholder responsibility when studying the filing of CSR proposals at the AGM. Next to the academic interest, investigating this is relevant for firms as it can help them manage their investor relations and for investors as it might help them to efficiently allocate their resources. Our study also is of interest from a policy perspective, in particular regarding the role of disclosure and transparency of non-financial information of the business community.
Our study relies on a sample of Fortune 250 companies during the period 2011-2014, which we combine with shareholder proposal data from Proxymonitor. Firms targeted by shareholder
proposals about environmental, social, or governance issues will be compared with firms not subject to such shareholder proposals. The CSR characteristics are derived from Thomson Reuters’ Asset4. Responsible investing is related to signing up to the UN’s sponsored Principles for Responsible Investing. We perform multivariate analysis with logistic regressions and engage in several robustness checks. We find that the responsibility of institutional ownership is to be significantly and negatively associated with the probability of receiving a shareholder proposal on environmental issues. However, a firm’s CSR performance does not seem to systematically affect the probably of being subject to CSR shareholder proposals when we control for financial and institutional characteristics. Here, the firm’s score on employee well-being is the main exception.
2. Background and hypotheses
Karpoff et al. (1996) found that firms with poor prior financial performance (regarding market-to-book ratio, operating returns, sales growth) are more likely to attract shareholder proposals in general. They study proposals on corporate governance issues during 1986-1990 and rely on 866 proposals from 317 companies. Using logistic regression, they conclude that these insider-initiated governance proposals do not seem to increase firm value, improve operating performance, or influence firm policies (Karpoff et al. 1996). Schooley et al. (2010) also rely on logistic regression and study governance proposals but focus on the probability of such shareholder proposals being filed. They used matched pairs analysis and have 182 firms with proposals on governance and study the period 1986-2003.They establish there is a significant relationship between corporate governance shareholder proposals and the firm’s governance characteristics, especially ownership concentration. The intuition behind the positive impact of ownership concentration would be that fewer shareholders have to be convinced to vote in favor of the shareholder proposal. The positive relationship from institutional ownership suggests that proposal filers count on the voting support of institutional shareholders. Tkac (2006) and Rojas et al. (2009) find that activists are more likely to target large, well-known companies to maximize the impact of their campaign. They conclude so on the basis of univariate analysis of a U.S. sample over the years 1992-2002 and 1997-2004, respectively. Benito and González-Benito (2008) rely on survey data and investigate how firm characteristics relate to stakeholder environmental pressure in the Spanish manufacturing industry. Flammer (2015), in a quasi-natural experiment, studies the effect of CSR shareholder proposals on financial performance. She uses an extensive dataset of U.S. firms during the period 1997-2012 and estimates a discontinuous regression model. She finds that the adoption of close call CSR proposals can be associated with a value
We will want to test two hypotheses, one relating to the properties of the firm in relation to receiving CSR proposals, the other relating to the properties of the investors filing such proposals. As to the first hypothesis, the literature suggests that CSR characteristics of a firm might influence it’s financial performance and reputation (Edmans, 2011; Dimson et al. 2015; Flammer, 2015). However, it cannot be inferred from the literature if CSR performance and the probability of CSR shareholder proposals are to be related as none of the papers investigates CSR characteristics in relation to CSR proposal probability. If the perception of Schooley et al. (2010) and Karpoff et al. (1996) regarding shareholder proposals would be correct, i.e. shareholder proposals are used to mitigate agency problems, a negative relationship between the firms’ CSR and the likelihood of CSR shareholder proposals is to be expected: shareholders want to improve firm performance and want to discipline the firm (hereafter labelled as ‘disciplining’ hypothesis). The presence of such monitoring can reduce the potential conflicts arising from agency problems (Bénabou and Tirole 2010).
However, the relationship between CSR performance and CSR shareholder proposal probability might also be explained in another fashion: Firms that perform well on CSR can expect more
shareholder proposals in this respect as they will have attracted investors who realize that CSR is helpful for financial outperformance and want to see this potential realized (to be labelled as the ‘positive selection’ hypothesis). Such behavior would result in a positive relation between CSR performance and the probability of CSR shareholder proposals. Thus, to test whether, and how, shareholders take CSR performance into account when filing a CSR shareholder proposal, the following two competing hypotheses are set up:
Hypothesis 1a: CSR performance of the firm is negatively associated with the probability of
receiving a shareholder proposal on CSR issues for the firm (‘disciplining’).
Hypothesis 1b: CSR performance of the firm is positively associated with the probability of
receiving a shareholder proposal on CSR issues for the firm (‘positive selection’).
Our second hypothesis focuses on the responsibility of institutional owners and the probability of shareholders filing proposals on CSR issues. As this hasn’t been researched before, our hypotheses in this respect are of an exploratory nature. Because the responsibility of individual investors is not directly observable, and those of institutional investors is only indirectly so, we will focus on the latter (see next section). We expect that the responsibility of institutional owners (RIO) is positively related with CSR proposal probability. A positive relationship between the responsibility of institutional ownership and CSR proposal probability would imply that filers of a CSR proposal express their responsibility by such filing (labelled as ‘signaling’ hypothesis). As such, they live up to their
principles. However, this not necessarily needs to be the case as a negative relationship would suggest that responsible investors do not deem it necessary to file CSR proposals. The reason could be that the responsible investors expect that their presence already will urge the firm to act more responsible or that they already selected firms high on CSR. Apparently, they see no further need for filing CSR proposals (labelled as ‘passivity’ hypothesis). Thus, to test the relationship between the responsibility of institutional investors and CSR shareholder proposal probability, the following two competing hypotheses are set up:
Hypothesis 2a: The responsibility of institutional owners of the firm is positively associated with
the probability of receiving a shareholder proposal on CSR issues for the firm (‘signaling’).
Hypothesis 2b: The responsibility of institutional owners of the firm is negatively associated
with the probability of receiving a shareholder proposal on CSR issues for the firm (‘passivity’).
The null hypothesis in both cases is that the responsibility of the institutional investors in a firm does not affect the probability that this firm receives a shareholder proposal on CSR issues.
3. Model, data, and methodology
To explain CSR shareholder proposal probability we will use six different regression models.: Environmental, social, and governance shareholder proposal probability are examined separately because it is increasingly common to differentiate corporate social responsibility policy along environmental, social and governance issues. This is due to the fact that encompassing ratings aggregate different dimensions of CSR and that the transmission mechanism between these dimensions and the firm’s operations differ (see Chatterji et al., 2009). For each of the three CSR dimensions (environmental, social, and governance), we will want to estimate one model with the aggregate score regarding environmental, social and governance characteristics (models 2, 4 and 6 respectively) and one with more detailed constituting items regarding each of these characteristics (i.e., models 1, 3 and 5). Our models are line with those of Karpoff et al. (1996), Cziraki et al. (2010), and Schooley et al. (2010), who all use the shareholder proposal probability as their independent variable. Including environmental and social variables in a model to explain environmental and social shareholder proposal probability is consistent with the approach of Flammer (2015), who included several types of social and environmental proposals in her analysis to detect the value effects of filing such shareholder proposals.
Our models differ somewhat from prior literature on shareholder proposal probability, such as Karpoff et al. (1996), Cziraki et al. (2010), Schooley et al. (2010), namely in that we try to find out about the explanatory power of firms’ CSR scores and the responsibility of investors in relation to CSR shareholder proposal probability. Further, in contrast to Flammer (2015), we do not investigate what actually happens with the voting about the proposals and their aftermath.
The two models regarding environmental shareholder proposal probability are:
,
, (1)
,
with PEi,t the probability that firm i receives an environment shareholder proposal in year t, MCAPi,t relating to market capitalization of firm i in year i, MTB to the market to book value, IOWN to institutional ownership, RIO to the responsibility of the institutional investor, EER to emission reduction, EPR to product innovation, ERR to resource reduction, and ECSR to environmental performance. εi,t is the error term. Thus, environmental performance in model 1 is represented by variables on scores on emission reduction, product innovation, and resource reduction. Environmental performance in model 2 is represented by an aggregated environmental performance score (ECSR).
The responsibility of institutional investors (RIO) with a particular firm will be associated with CSR shareholder proposal probability at the AGM of that firm. With responsible institutional investors, we relate to investors who include social, environmental and governance considerations into their investment decision. In this respect, the signatory list of the United Nations-supported Principles of Responsible Investing (UNPRI) is used to verify whether shareholders include such considerations into their investment decision-making process or not. To be an UNPRI signatory, an investor has to comply with the six principles of UNPRI (see www.pri.org). As only institutional investors are able to sign up to these principles, we aren’t able to verify the responsibility of other types shareholders. We will examine the responsibility of the largest 50 institutional shareholders in each company (see Cziraki et al. 2010). The largest 50 shareholders of a firm are extracted from Orbis, which is a
database that contains company-specific information. For each firm-year observation the percentage of responsible institutional investors is calculated. For example, if Berkshire Hathaway has 75
For social and governance issues in shareholder proposals we will rely on the following two sets of two models respectively, which are highly similar to models (1)-(2):
,
, (3)
,
, (4)
,
, (5)
,
, (6)
In models (3) and (4), PSi,t the probability that firm i receives a social shareholder proposal in year t. In (3), EWS stands for the employee wellbeing score, PRS for the product responsibility score, COS for the community score, and HRS for the human rights score. The wellbeing of employees is a combined measure of scores from Asset4 on diversity and opportunity, employment quality, health and safety, and training and development. Because all these scores are closely related to employee wellbeing we do not include them separately. In (4), SCSR is the overall social score. Models (5) and (6) examine governance proposal probability. Here, PGi,t the probability that firm i receives a
governance shareholder proposal in year t. In (5), governance performance is represented by variables on scores on board functions (BFS), board structure (BSS), vision and strategy (VSS), and shareholder rights (SRS). The governance performance in model 6 is represented by a weighted governance score (GCSR) variable.
The explanatory variables that are included in all six models are firm size, financial
ownership act as control variables. Firm size is measured by the market capitalization (MCAP) and is extracted from Datastream. MCAP is the share price multiplied by the number of ordinary shares outstanding. The market value is given in billions of U.S. dollars. Size is included because Karpoff et al. (1996) find that larger firms are more prone to receiving shareholder proposals. The financial performance of a firm is measured by the market-to-book ratio (MTB), which especially captures value creating potential. Both Karpoff et al. (1996) and Cziraki et al. (2010) find that financial performance measured by MTB is inversely related to shareholder proposal probability. MTB is extracted from Datastream. Institutional ownership (IOWN) is measured by the sum of percentages owned by the biggest 50 institutional shareholders of a firm. For example, if in 2014 Berkshire Hathaway’s 50 biggest shareholders have 1.5% of shares each, the IOWN variable for Berkshire in 2014 will get a value of 75% or 0.75. Cziraki et al. (2010) and Dam and Scholtens (2013) also explain the relationship between institutional ownership and shareholder proposal probability by the size of the institutional owners.
3.2 Data
As we want to test the probability of three different categories of shareholder proposals, regarding the corporation’s environmental policy, social policy, and governance policy respectively, we need to identify three different sample groups. To this extent, data were obtained from the database of Proxymonitor.org on proposals made between 2011 and 2014. Proxymonitor.org is a website sponsored by Manhattan Institute for Policy Research. The 2011-2014 time period is chosen because Proxymonitor.org only provides historical information on shareholder proposals from 2011 onwards and we use one year lags. As such, we focus on the post global financial crisis period. In addition, the 2011-2014 database yields more observations than the samples of Karpoff et al. (1996), Cziraki et al. (2010), and Schooley et al. (2010) who primarily rely on matching analysis which of course impacts the sample size. Flammer’s (2015) alternative research design is about the sampling for close call CSR proposals and she relies on two databases to which we don’t have access (RiskMetrics and
reported on yearly frequency by the Fortune magazine. Fortune ranks companies which are incorporated, operate and file financial statements in the U.S. by revenues in their respective fiscal year and classifies the shareholder proposals in several categories. Environmental policy, social policy, and governance policy are examples of such categories. From 2011 to 2014, a total of 2,483 proposals were recorded at 267 companies. The amount of unique firms observed each year in the 2011-2014 period is 259, 253, 250, and 256 respectively. In some years more than 250 unique firms are observed, hence the Fortune 250 selection criteria is a bit stretched. This is related to the fact that there usually are several months between filing a shareholder proposal and the AGM. Management shareholder proposals (i.e. proposals filed by the management of the firm) are excluded as these are not
comparable to “ordinary” shareholder proposals, because managers are inside-owners and may have other incentives to file shareholder proposals than the outside-owners, like institutional investors (Jensen and Meckling 1976). After this filtering, 1,217 CSR shareholder proposals at 211 unique companies remain. Multiple shareholder proposals per year on one category (environmental, social, or governance) for one firm are treated as a single shareholder proposal event. If we would not follow this treatment it might be possible that a specific company is present with multiple observations in the proposal probability sample in case they did receive multiple proposals on one topic. Such double, triple or quadruple etc. observations would lead to a clustering bias. Further, some firms received shareholder proposals and others did not. Then, each sample is constructed in such a way that it consists of observations of firms who did receive environmental, social or governance shareholder proposals, and of observations of firms who did not receive a shareholder proposal on this particular issue. This sample construction method contrasts with those of Karpoff et al. (1996), Cziraki et al. (2010), and Schooley et al. (2010). They constructed their sample on the basis of matching processes.
[ Insert Table 1 about here please ]
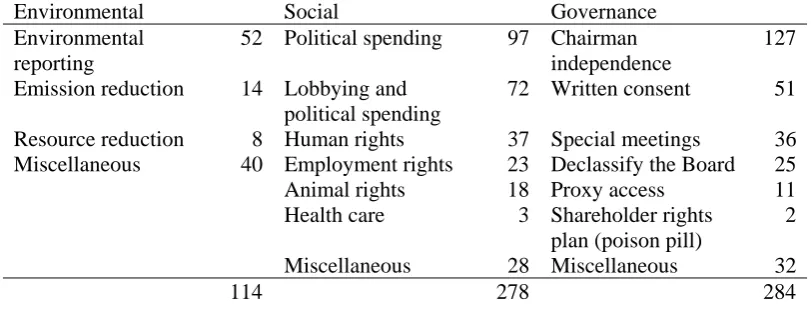
consist of 278 and 284 observations respectively. Please note that for the corporate governance sample the shareholder proposals on executive compensation are excluded (this is because the Dodd-Frank Act requires firms allow shareholder votes on executive compensation).
The CSR scores are extracted from Thomson Reuters’ Asset4 (Datastream). Thomson Reuters’ Asset4 assesses CSR performance for a wide range of variables on a scale from zero to hundred. ASSET4 ESG data is chosen for several reasons. The first reason is that ASSET4 is a global dataset and covers more than 4000 companies; it is much more internationally diversified than MSCI’s KLD. The availability of overall CSR scores makes the data easy and efficient to work with. Another reason to use ASSET4 ESG data is that it is easily accessible via DataStream. ASSET4 ESG data has been used in studies on the CSR-CFP relationship, examples are Daszynska-Zygadlo et al. (2016) and Dorfleitner et al. (2013). ASSET4 reports on four pillars which represent different dimensions of CSR: economic, environmental, governance, and social. As we already want to use economic characteristics as controls, we will use the aggregate and detail scores on the environmental performance pillar, the social performance pillar and the corporate governance pillar. The CSR performance of a firm is calculated on the basis of a z-score This z-score is a relative measure; it reflects a company’s CSP relative to the average CSP of all other companies that are rated by
ASSET4. The z-scores are normalized, which entails that ASSET4 scales the z-scores in order to make them fit into the range of zero to hundred. This makes them much more useful in research than the MSCI KLD ratings.
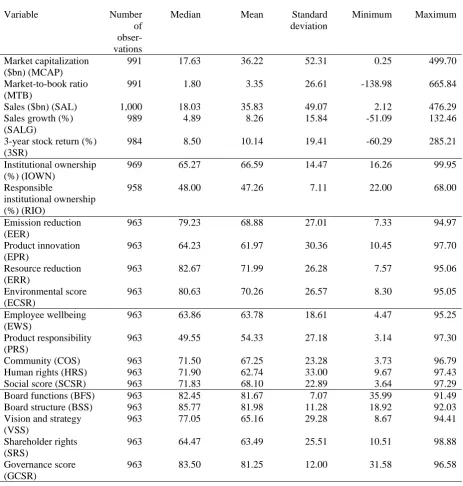
[ Insert Table 2 about here please ]
The descriptive statistics are reported in Table 2 and we provide their correlations in Appendix A. It shows that the average firm’s market capitalization is $ 18 billion and that responsible investor ownership is 48%. Of the three CSR dimensions, the sample firms score highest on governance and lowest on social. Most variables do not seem to have high correlations: High correlations are mainly observed between weighted pillar scores and category scores. This makes sense because the
subcategorical scores are the underlying products of the weighted category scores. The variables that are included at the same time into one of the models do not exhibit high correlations among each other. Therefore the estimation results will not suffer from multicollinearity problems.
3.3 Methodology
compare between firms who received a shareholder proposal on an environmental topic and those who did not receive a CSR shareholder proposal, firms who received a shareholder proposal on a social topic and those who did not receive a CSR shareholder proposal, and between firms who received a governance shareholder proposal and those who did not receive a CSR shareholder proposal. To test for the statistical significance of differences between the target firms and their non-target peers, both a parametric two sample t-test and a non-parametric Wilcoxon rank sum test is undertaken. For the multivariate analysis, we rely on the estimations of the six regression models. Multivariate analysis examines the impact of a group of independent variables on a dependent variable. In our case, the dependent variable in the regression model is a dummy variable; firms did or did not receive a
shareholder proposal. To account for the properties of this dependent variable, and in line with Karpoff et al. (1996) and Schooley et al. (2010), a logistic regression will be estimated to investigate the effect of firms’ characteristics on shareholder proposal probability using maximum likelihood to estimate the non-linear logistic model. To ensure the standard error estimates are robust to heteroscedasticity, Huber-White covariances are used when estimating the regressions.
4. Results
4.1 Univariate analysis results
[ Insert Table 3 about here please ]
further establish that institutional ownership is smaller for firms that are targeted by a CSR
shareholder proposal compared to the non-targeted firms. Firms targeted by either an environmental, social, or governance shareholder proposal, have approximately 10% less institutional owners than non-targeted firms. This contrasts with Cziraki et al.’s (2010) finding of a positive association of institutional ownership on shareholder proposal probability, but is consistent with Dam and Scholtens (2013). Further, we observe that both the parametric and the non-parametric test statistics provide quite similar test results.
Interesting is that firms that receive proposals on environmental issues have significantly higher responsible institutional investor ownership. Regarding firms which receive proposals from shareholders on social and governance issues, we do not find a difference regarding the responsibility of the institutional owners between targeted and non-targeted firms. This suggests that the second hypothesis of no differences between the responsibility of institutional owners with respect to targeted and non-targeted firms cannot be rejected in the case of proposal on social and governance issues. However, it can be rejected for proposals on environmental issues, confirming the positive selection hypothesis (1b).
When we take a closer look at the constituents of the three pillars, we observe that firms targeted by environmental shareholder proposals have significantly higher scores regarding all environmental dimensions of CSR. Both the environmental category scores and the weighted environmental score are higher for firms targeted by environmental shareholder proposals. Firms targeted by social shareholder proposals also have statistical significantly higher scores on employee wellbeing performance, human rights performance, and the overall social performance. Further, firms targeted by governance shareholder proposals score significantly higher on vision and strategy, and on the overall governance score.
We do not find support for the ‘disciplining’ hypothesis (1a) where investors file proposals with firms performing poorly on CSR. The ‘positive selection’ hypothesis does also hold in the case of the overall social and governance scores, but cannot be confirmed for all specific subcategories. Further, regarding the role of responsible institutional owners, we find some support for the ‘signaling’ hypothesis (2a) in the case of environmental firm characteristics; responsible owners appear to signal their responsibility by filing proposals with companies that already perform relatively well and not with those that underperform. We find no support for the ‘passivity’ hypothesis (2b).
4.2 Multivariate analysis results
[ Insert Table 4 about here please ]
Table 4 provides the results of the six regression models introduced in section 3.1. In models (1) and (2), where environmental shareholder proposal probability is the dependent variable,
responsible institutional ownership is positive and statistically significant. However, none of coefficients of the four items investigated does suggest a statistical significant relationship with environmental shareholder proposal probability. This clearly contrasts with the univariate analysis results, and shows the value-added of using our model. In regression models (3) and (4), with social shareholder proposal probability as the dependent, only employee wellbeing is positive and significant associated with social shareholder proposal probability. This is in line with the results of Edmans (2011) with the “100 Best Companies to Work For in America”. In regression models (5) and (6), with governance shareholder proposal probability as our dependent variable, there is no significant relationship with the individual items. Unlike the univariate results, regression models (1)-(6) indicate that most of the individual and general CSR categories are not significantly influencing the probability of shareholders filing CSR proposals, except in the case of employee wellbeing. Employee wellbeing seems to have a positive influence on social shareholder proposal probability, albeit only marginally so. Thus, overall, it seems that CSR performance does not affect relate to the probability of
analysis cannot confirm the findings of Schooley et al. (2010) for governance, but are consistent with those of Flammer (2015) in the case of environmental performance, but not for social and governance performance.
The results regarding the responsibility of institutional owners and CSR proposal probability are of interest for testing hypotheses 2a and 2b. We find that environmental shareholder proposal probability exhibits a highly significant positive relationship with the responsibility of institutional ownership, whereas other types of shareholder proposals probability do not exhibit such an influence. The responsibility of institutional owners of the firm positively affects the probability of receiving an environmental shareholder proposal, which tends to provide support for hypothesis 2a. Because the parameters for the responsibility of institutional ownership in model (3)-(6) are not statistically
significant, the second null hypothesis cannot be rejected in the case of shareholder proposals on social and governance issues.
4.3. Robustness analysis
To investigate the robustness of our multivariate analysis, several regression models and estimation methods are conducted. First, to verify the robustness of the control variables, firm size and financial performance, MCAP and MTB are replaced with the amount of sales (SAL) and the three year cumulative stock return (3SR). We find that the statistical significance levels of 3SR differ from those for MTB in the main regression models (results available upon request with the contacting author). Also a few CSR performance dimensions now exhibit statistically significant levels, namely the encompassing environmental score and the vision and strategy of the firm.
likelihood of filing shareholder proposals on social issues. The values from other statistical significant variables, like market capitalization and employee wellbeing, have become somewhat smaller. The explanatory power of the institutional ownership variable is now significantly negative in all of the models, which is in line with the passivity hypothesis (2b).
To test the validity of using the logistic regressions, and to provide more easily interpretable results, the six main regression models also are re-estimated with the more common pooled ordinary least squares (OLS) method (results available upon request with the contacting author). The results of the pooled OLS estimating models are in line with the results of the logistic regression approach. Employee wellbeing is again the only statistical significant CSR category in explaining social
shareholder proposal probability and confirms Edmans’ (2011) findings. The vision and strategy score is now at the 10% statistical significance level for governance shareholder proposal probability. The signs of the control variables and RIO variable are similar to those in the logistic regression models.
Finally, the logistic regression estimations are conducted on the basis of an alternative sample construction method (results available upon request with the contacting author). Recall that to arrive at the main results, the sample is constructed with firms that received a shareholder proposals on a specific topic (environmental, social, or governance) and firms that did not receive any CSR shareholder proposal. Now, alternatively, the sample is constructed with firms that received a shareholder proposals on a specific topic and firms that did not receive a shareholder proposal on the respective topic. So for example: if Berkshire Hathaway received a shareholder proposal on an environmental topic and Apple received a shareholder proposal on a governance topic, both observations will be included in the environmental sample where Berkshire’s dependent variable (dummy) will get a value of one, and Apple’s dependent variable will get a value of zero. As such, the ‘non-target’ part of the environmental robustness sample also includes firms that did receive
5. Conclusion
We studied whether responsible institutional investors and corporate social responsibility (CSR) performance of a firm can be associated with the probability of this firm receiving a
shareholder proposal on environmental, social, or governance issues. We measure the responsibility of institutional investors by the relative ownership of the fraction of the 50 biggest institutional owners of a firm that have signed the United Nations supported Principles of Responsible Investing (PRI). The CSR performance of a firm is measured by several environmental, social, and governance performance scores that are provided by Thomson Reuters’ Asset4.
For our sample of Fortune 250 companies in the 2011-2014 period, we find that the
responsibility of institutional ownership of a firm positively and significantly relates to the probability that shareholders file proposals on environmental issues. Further, it shows that shareholder proposal probability is to be positively associated with the firm’s performance on employee wellbeing,
confirming previous findings by Edmans (2011). In addition, we establish that most other CSR issues do not seem to be significantly related to the probability of receiving a proposal from shareholders on CSR. Our extensive robustness analysis confirms the reliability of our findings.
References
Al-Najjar, B., Aspioni Anfimiadou, A., 2012. Environmental policies and firm value. Business Strategy and the Environment, 21 (1), 49-59.
Baumgartner, R.J., 2014. Managing corporate sustainability and CSR: A conceptual framework combining values, strategies and instruments contributing to sustainable development. Corporate Social Responsibility and Environmental Management, 21 (5), 258-271.
Bénabou, R., Tirole, J., 2010. Individual and corporate social responsibility, Economica, 77, 1-19. Chatterji , A.K., Levine, D.I., Toffel, M.W., 2009. How well do social ratings actually measure corporate social responsibility? Journal of Economics and Management Strategy, 18, 125-169. Cziraki, P., Renneboog, L., Szilagyi, P., 2010. Shareholder activism through proxy proposals: the European perspective. European Financial Management, 16 (5), 738-777.
Dahlsrud, A., 2008. How corporate social responsibility is defined: an analysis of 37 definitions, Corporate Social Responsibility and Environmental Management, 15 (1), 1-13.
Dam, L., Scholtens, B., 2013. Ownership concentration and CSR policy of European multinational enterprises. Journal of Business Ethics, 118 (1), 117-126.
Dam, L., Scholtens, B., 2015. Towards a Theory of Responsible Investing: On the Economic Foundations of Corporate Social Responsibility. Resource and Energy Economics, 41, 103-121.
Danilovic, M., Hensbergen, M., Hoveskog, M., Zadayannaya, L., 2015. Exploring Diffusion and Dynamics of Corporate Social Responsibility. Corporate Social Responsibility and Environmental Management, 22 (3), 129-141.
Dimson, E., Karakas, O., Xi, L., 2015. Active ownership. Review of Financial Studies, 28 (12), 225-268.
Eccles, R.G., Ioannou, I., Serafeim, G., 2014. The impact of corporate sustainability on organizational processes and performance. Management Science, 60 (11), 2835-2857.
Edmans, A., 2011. Does the stock market fully value intangibles? Employee satisfaction and equity prices. Journal of Financial Economics, 101, 621-640.
Escrig-Olmedo, E., Muñoz-Torres, M.J., Fernández-Izquierdo, M.A., 2013 Sustainable development and the financial system: Society's perceptions about socially responsible investing. Business Strategy and the Environment, 22 (6), 410-428.
Escrig-Olmedo, E., Muñoz-Torres, M.J., Fernández-Izquierdo, M.A., Rivera-Lirio, J.M., 2017. Measuring corporate environmental performance: A methodology for sustainable development, Business Strategy and the Environment, 26 (2), 142-162.
Fougère, M., Solitander, N., 2009. Against corporate responsibility: critical reflections on thinking, practice, content and consequences. Corporate Social Responsibility and Environmental Management, 16 (4), 217–227.
Friede, G., Busch, T., Bassen, A., 2015. ESG and financial performance: aggregated evidence from more than 2000 empirical studies. Journal of Sustainable Finance & Investment, 5 (4), 210-233 González-Benito, J., González-Benito, O., 2008. A study of determinant factors of stakeholder
environmental pressure perceived by industrial companies. Business Strategy and the Environment, 19 (2), 164-181.
Halme, M., Niskanen, J., 2001. Does corporate environmental protection increase or decrease
shareholder value? The case of environmental investments. Business Strategy and the Environment, 10 (4), 200-214.
Jensen, M.C., Meckling, W.H., 1976. Theory of the firm: Managerial behavior, agency costs and ownership structure. Journal of Financial Economics, 3, 305-360.
Karpoff, J., Malatesta, P., Walking, R., 1996. Corporate governance and shareholder initiatives: empirical evidence. Journal of Financial Economics, 42 (3), 365–395.
Kitzmueller, M., Shimshack, J., 2012. Economic perspectives on corporate social responsibility. Journal of Economic Literature, 50 (1), 51-84.
Lucas, M.T., 2010. Understanding environmental management practices: integrating views from strategic management and ecological economics. Business Strategy and the Environment, 19 (8), 543-556.
O’Rourke, A., 2003. A new politics of engagement: Shareholder activism for corporate social responsibility. Business Strategy and the Environment, 12 (2), 227-239.
Rojas, M., M'Zali, B., Turcotte, M., Merrigan, P., 2009. Bringing about changes to corporate social policy through shareholder activism: filers, issues, targets, and success. Business & Society Review, 114 (2), 217-252.
Schooley, D., Renner, C., Allen, M., 2010. Shareholder proposals, board composition, and leadership structure. Journal of Managerial Issues, 22 (2), 152-165.
Tkac, P., 2006. One proxy at a time: pursuing social change through shareholder proposals. Economic Review, 91 (3), 1-20.
Welford, R., 2007. Corporate governance and corporate social responsibility: issues for Asia. Corporate Social Responsibility and Environmental Management, 14 (1), 42-51.
Table 1
ESG shareholder proposal categories
This table shows the topics of the shareholder proposals which are part of the environmental, social and governance samples. The ‘miscellaneous’ categories contain shareholder proposals on a too broad variety of topics to categorize them separately
Environmental Social Governance
Environmental reporting
52 Political spending 97 Chairman independence
127 Emission reduction 14 Lobbying and
political spending
72 Written consent 51 Resource reduction 8 Human rights 37 Special meetings 36 Miscellaneous 40 Employment rights 23 Declassify the Board 25 Animal rights 18 Proxy access 11 Health care 3 Shareholder rights
plan (poison pill)
2
Miscellaneous 28 Miscellaneous 32
Table 2 Descriptive statistics Variable Number of obser-vations
Median Mean Standard
deviation
Minimum Maximum
Market capitalization ($bn) (MCAP)
991 17.63 36.22 52.31 0.25 499.70
Market-to-book ratio (MTB)
991 1.80 3.35 26.61 -138.98 665.84
Sales ($bn) (SAL) 1,000 18.03 35.83 49.07 2.12 476.29
Sales growth (%) (SALG)
989 4.89 8.26 15.84 -51.09 132.46
3-year stock return (%) (3SR)
984 8.50 10.14 19.41 -60.29 285.21
Institutional ownership (%) (IOWN)
969 65.27 66.59 14.47 16.26 99.95
Responsible
institutional ownership (%) (RIO)
958 48.00 47.26 7.11 22.00 68.00
Emission reduction (EER)
963 79.23 68.88 27.01 7.33 94.97
Product innovation (EPR)
963 64.23 61.97 30.36 10.45 97.70
Resource reduction (ERR)
963 82.67 71.99 26.28 7.57 95.06
Environmental score (ECSR)
963 80.63 70.26 26.57 8.30 95.05
Employee wellbeing (EWS)
963 63.86 63.78 18.61 4.47 95.25
Product responsibility (PRS)
963 49.55 54.33 27.18 3.14 97.30
Community (COS) 963 71.50 67.25 23.28 3.73 96.79
Human rights (HRS) 963 71.90 62.74 33.00 9.67 97.43
Social score (SCSR) 963 71.83 68.10 22.89 3.64 97.29
Board functions (BFS) 963 82.45 81.67 7.07 35.99 91.49
Board structure (BSS) 963 85.77 81.98 11.28 18.92 92.03
Vision and strategy (VSS)
963 77.05 65.16 29.28 8.67 94.41
Shareholder rights (SRS)
963 64.47 63.49 25.51 10.51 98.88
Governance score (GCSR)
Table 3. Univariate analysis
This table reports the means of financial performance, ownership information, and corporate social responsibility scores for Fortune 250 firms that are, and are not, targeted by ESG shareholder proposals between 2011 and 2014. The means of the non-target firms are based on year observations of firms that did not receive an ESG shareholder proposal during the respective year. Shareholder proposal target firms are separated into environmental, social, and governance groups. The means of the group are based on year observations of firms that received one or more shareholder proposal during the respective year on a respectively environmental, social, or governance topic. Firm characteristics are measured at 1 January of the year before the shareholder proposal is being voted on at the annual general meeting. The t-and z-statistic both measure the statistical significance of the difference between a target firm group and the non-target firm mean and median, respectively (the median is not reported).
Non-target firms
Target firms
Environmental Social Governance
(1) Mean (2) Mean (3) t-stat (4) z-stat (5) Mean (6) t-stat (7) z-stat (8) Mean (9) t-stat (10) z-stat (11)
MCAP 19.12 65.64 5.88*** 9.25*** 68.17 10.29*** 13.69*** 61.83 9.31*** 11.82***
MTB 1.89 2.81 1.65* 3.28*** 6.66 1.59 2.87*** 6.32 1.53 2.93***
SAL 22.41 65.51 4.88*** 5.82*** 61.33 8.53*** 11.42*** 58.57 7.79*** 10.47***
SALG 8.95 6.81 -1.62 -0.90 7.57 -1.10 -1.92* 6.83 -1.96 -1.99***
3SR 9.99 10.19 0.11 0.39 9.76 -0.17 -1.07 10.23 0.16 0.90
IOWN 70.70 59.03 -8.24*** -7.19*** 61.38 -9.08*** -8.39*** 62.61 -7.39*** -7.07***
RIO 47.24 49.10 2.48*** 2.42*** 47.30 0.11 0.23 47.46 0.44 0.05
EER 63.66 73.72 3.94*** 2.72***
EPR 56.39 69.32 4.26*** 3.60***
ERR 67.38 76.52 3.36*** 3.62***
ECSR 64.61 76.69 4.59*** 3.74***
EWS 60.60 68.16 5.84*** 4.92***
PRS 53.87 54.90 0.50 0.42
COS 66.98 67.72 0.43 0.01
HRS 59.02 68.14 3.60*** 3.51***
SCSR 64.38 73.02 5.35*** 3.98***
BFS 81.65 81.94 0.58 0.82
BOS 81.45 82.77 1.58 1.18
VSS 60.37 71.56 5.23*** 5.17***
SRS 61.96 63.49 0.80 0.53
GCSR 80.15 82.40 2.59*** 2.58***
Table 4. Multivariate analysis.
This table reports the characteristics related to the probability of firms receiving an ESG shareholder proposal based on logistic regressions. Firm
characteristics are measured at 1 January of the year before the shareholder proposal is being voted on at the annual general meeting. The dependent variable is a dummy which is equal to one if a firm is targeted by a shareholder proposal (on environmental, social, or governance topic), and equal to zero if the firm is not targeted by an ESG shareholder proposal. *,**, and *** indicate whether the parameter is statistically significant at the 10%, 5%, and 1% level, respectively. The pseudo-R2’s and percentage of correct predictions indicate how well the regression models fit the data.
Environmental Social Governance
(1) (2) (3) (4) (5) (6)
Constant -3.189** -3.284*** -0.864 -0.897 -1.770 -0.956
MCAP 0.016*** 0.016*** 0.025*** 0.025*** 0.020*** 0.021***
MTB 0.017 0.017 0.008** 0.007** 0.006** 0.006**
IOWN -0.033*** -0.033*** -0.010 -0.011 -0.010 -0.010
RIO 0.060*** 0.060*** -0.001 0.000 0.006 0.007
EER 0.004
EPR 0.004
ERR -0.002
ECSR 0.008
EWS 0.012*
PRS -0.001
COS -0.005
HRS -0.003
SCSR 0.004
BFS 0.007
BOS 0.001
VSS 0.005
SRS 0.000
GCSR 0.002
Correction predictions (%)
71.7 69.8 72.5 71.7 66.7 67.8
Pseudo R2 .194 .195 .186 .183 .141 .137
Appendix A
Table A.1 - Correlation matrix
1 2 3 4 5 6 7 8 9 10 11 12 13 14 15 16 17 18 19 20
1 MCAP 1.00
2 MTB .02 1.00
3 SAL .68 .00 1.00
4 SALG .01 -.01 .00 1.00
5 3SR .05 .03 -.01 .13 1.00
6 IOWN -.26 .02 -.14 .02 .01 1.00
7 RIO .05 .02 -.01 -.01 -.04 -.03 1.00
8 EER .26 .05 .10 -.10 -.13 -.04 .01 1.00
9 EPR .30 .00 .18 -.03 .00 -.08 .00 .58 1.00
10 ERR .24 .05 .09 -.13 -.09 -.05 .04 .77 .57 1.00
11 ECSR .28 .04 .13 -.10 -.09 -.05 .01 .89 .81 .89 1.00
12 EWS .20 .02 .06 -.06 -.10 -.05 .02 .64 .42 .61 .63 1.00
13 PRS .04 -.02 -.01 -.05 -.04 .08 .03 .36 .41 .37 .43 .37 1.00
14 COS -.07 -.04 -.12 -.04 -.03 .05 -.02 .41 .26 .39 .40 .52 .27 1.00
15 HRS .26 .01 .13 -.08 -.02 -.06 .02 .49 .48 .53 .56 .41 .33 .25 1.00
16 SCSR .19 .01 .07 -.09 -.09 -.01 .02 .70 .53 .70 .73 .91 .58 .64 .64 1.00
17 BFS -.01 .00 .04 -.10 -.07 -.02 .05 .10 .07 .13 .12 .09 .03 .11 .02 .10 1.00
18 BSS .00 -.06 -.02 -.01 .05 .16 .01 .00 .02 .00 .01 .05 .05 .08 -.03 .06 .08 1.00
19 VSS .25 .03 .13 -.09 -.11 -.04 .03 .74 .54 .70 .75 .67 .37 .43 .46 .72 .15 .05 1.00
20 SRS .09 .04 .05 .05 .03 .06 .03 -.02 .00 -.06 -.04 .09 .12 -.03 -.03 .05 .02 .06 .02 1.00
21 GCSR .15 .03 .06 -.06 -.06 .12 .03 .49 .34 .44 .48 .52 .34 .33 .30 .55 .9 .31 .69 .55
For abbreviations, see Table 2.