Developing student questioning when problem solving: The role of
sample student responses
Sheila Evans and Malcolm Swan
University of Nottingham, School of Education, UK,
[email protected]; [email protected]
This paper describes intervention resources designed to provide opportunities for student self-regulation, with a particular focus on setting subgoals when problem solving. Each task includes a range of pre-written interrelated “sample student responses” that expose students to multiple perspectives on an unstructured non-routine problem. After students attempt the problem they are given the responses to collaboratively complete, critique and compare. We explore students’ capacity to adopt another person’s (the sample student’s) goals in order to complete a solution, and their capacity, through the use of comparison, to identify worthy criteria when critiquing the completed solutions. We then reflect on how we can make subsequent improvements to the resources.
Key words: Problem solving, comparing solutions, peer assessment.
INTRODUCTION
Many studies cite planning and monitoring as key discriminators for problem solving success (e.g. Schoenfeld, 1992; Carlson & Bloom, 2005). During the initial planning phase, the subgoals students set determine the mathematical and self-regulating strategies used. Novice problem solvers often set vague, unstructured goals or their goals are flawed (Juwah et al., 2004). They often use naïve, inefficient strategies (e.g. trial and error), rather than considering the more powerful methods at their disposal. They pursue unfruitful or inefficient lines of enquiry relentlessly, without stopping to consider alternative strategies (Schoenfeld, 1992). Furthermore, they remain uncertain of the criteria to judge the quality of their work (Bell et al. 1997), other than checking the correctness of the answer. In contrast, expert problem solvers spend time setting hierarchical goals (Schunk & Zimmerman, 2012), carefully monitor their progress against these goals, and persist in the face of obstacles (Schunk & Zimmerman, 2012). They routinely use these goals to step back and ask themselves or their partner questions such as ‘Where is this strategy going?’, ‘Should it be so complicated?’, or ‘Does this solution make sense?’ (e.g. Schoenfeld, 1992). Answers to which may prompt a change of direction in order to improve, for example, their solution’s appropriateness, elegance, efficiency or generalizability. Furthermore, using subgoals makes progress visible, and their realization may sustain motivation to persist (Schunk, 2006).
differences surface, and opportunities arise for students to reflect on, and adapt their success criteria to accommodate new values. Through a series of case studies Juwah et al. (2004) found that providing students with opportunities for peer (and self) assessment encouraged the identification of goals implicit in solutions and judgments about how these goals related to their own solutions to a problem.
We have carefully designed resources intended to help students develop their self-regulating skills. In these resources, students are asked to interpret, complete, compare and critique pre-prepared, handwritten “sample student responses” to non-routine, unstructured problems. The responses are designed to simulate different ways students may solve a problem (Evans & Swan, 2014) and provide opportunities for students to use and reflect on the goals set by others. We begin by explaining the
theory and method behind the design of these resources, then discuss how our intentions were interpreted in the classroom and detail the subsequent improvements.
THEORETICAL BACKGROUND
This study is rooted in a design research paradigm. Design research involves both the development of intervention resources and studying what happens when they are enacted in the classroom. Accordingly, the design process of iteratively designing, testing and revising a resource and the research process of conjecturing, collecting, analysing data and contributing to theory, occur simultaneously and in parallel. Thus the development of an intervention forms a symbiotic relationship with the development of the research. Within this flexible environment, both the intervention and the initial research questions or conjectures may be refined. This flexibility is particularly beneficial when the research base is thin and provides only limited guidance for the design of an intervention (McKenney & Reeves, 2012).
The design of the resources emerges from the findings from a large design research project (Swan & Burkhardt, 2014) but with some distinguishing features. Namely, the pre-written sample student responses are all incomplete. Thus the context has been mathematized; the students’ task is to complete the mathematics and communicate results. This design structure provides students with an opportunity to ask themselves questions about each sample student’s goals. Questions such as: ‘What is this student doing?’ and ‘Why are they doing that? and ‘What should they do next?’ This awareness of goals set can positively influence their own performance when solving problems, promoting self-regulatory skills and productive goal-directed action, engendering persistence in the face of obstacles (Schunk & Zimmerman, 2012). After completing solutions, students attempt to explicitly compare and connect them. To prevent students from simply comparing handwriting or checking for mistakes, responses were short, accessible and error-free (Evans & Swan, 2014).
event. The literature suggest this practice, particularly if supported by a meaningful framework, focuses students attention on similarities and differences, and so facilitates the noticing of more features than if artifacts were viewed separately (e.g. Gamer, 1974; Chazan & Ball, 1999). Accordingly, in this study, students are asked to compare alternative approaches to non-routine unstructured mathematics problems. Thus encouraging students to ask themselves questions such as: ‘What are the differences between these two responses?’; ‘How do these differences benefit or constrain the solution?’; ‘Why do x rather than y?’ By encouraging students to not only to make sense of a solution but to make judgments about its quality, may shift their perspective from viewing solutions as a process, to viewing them as objects to be evaluated. This shift can promote deeper understanding of the mathematics (Sfard, 1991).
We know from the literature that transferring learning from one problem situation to another can be challenging as students often form highly concrete, context-specific, understandings of the solution (e.g. Gentener, 2003). This may be partially addressed by exposing students to multiple solutions, particularly if these solutions are
compared rather than considered individually (e.g. Catrambone & Holyoak, 1989).
By comparing students’ focus on structural, often abstract, commonalities rather than
idiosyncratic, situation-specific, surface features (Gentener, 2003). A study within
mathematics education supports these findings. The study (Rittle-Johnson & Star, 2007) likewise focused on transferring methods studied in one context to another. Students learnt to solve equations by either comparing alternative methods or by reflecting on each method separately. The students in the ‘compare’ group made greater gains in procedural knowledge and flexibility to solve routine problems in multiple ways and comparable gains in conceptual knowledge. Although the studies on comparing solutions did not involve unstructured, non-routine problems, (we could locate no studies of this kind) we conjecture that comparing solutions to these types of problems could help to improve students’ ‘flexibility’ when solving other problems. Thus increasing their capacity to monitor their progress against interim goals as their solution is slowly created.
METHOD
Structure of the intervention lesson:
• Students worked on the task in a prior lesson. This provided the teacher with insight into the ways students were understanding and representing the problem. • After the teacher briefly reintroduced the problem to the whole class, students
worked first individually then in pairs, completing sample student responses. • Because students were not used to comparing responses, the teacher briefly
explained, using a non-mathematical example, the benefits of making comparisons.
• Students then glued the now completed responses to a poster and interpreted, completed and compared the solutions.
• In a whole-class discussion students reviewed what they had learned.
Figure 1 shows the problem used. Figure 2 shows the pre-written student responses. We carefully designed the responses to encourage students to make connections between approaches in order to create or strengthen networks of related ideas (Silver et al., 2005) and enable students to achieve ‘a coherent, comprehensive, flexible and more abstract knowledge structure’ (Seufert et al., 2007).
Student Materials Solving a Real-Life Problem: Baseball Jerseys S-1 © 2012 MARS, Shell Center, University of Nottingham
Baseball Jerseys Bill wants to order new jerseys for his baseball team. He sees the following advertisements for two printing companies, ‘PRINT IT’ and ‘TOP PRINT’. Bill doesn’t know which company to choose.
PRINT IT
Get your baseball jerseys printed with your own team names here.
Only $21 per jersey.
TOP PRINT
We will print your baseball jerseys - just supply us with your design.
Pay a one-off setting up cost of $45; we will then print each jersey for only $18!
1. Give Bill some advice on which company he should buy from. When should he choose ‘PRINT IT’? When should he choose ‘TOP PRINT’? Explain your answer fully.
2. A third company called ‘VALUE PRINTING’ wants to start trading.
It wants its prices to be between those of ‘PRINT IT’ and ‘TOP PRINT’.
This company never wants to be the most expensive and never wants to be the cheapest. Can you complete this poster for the new company?
VALUE PRINTING
We print baseball jerseys.
Pay a one-off set up cost of $...
Then each jersey will cost$...
Give Bill some advice on which company he should buy from.
When should he choose ‘PRINT IT’? When should he choose ‘TOP PRINT’? Explain your answer fully.
Figure 1: The problem
[image:4.595.63.557.334.664.2]Dylan Cath Ezra
Figure 2: The three pieces of sample student work
response. We used a grounded theory approach to assess the 45 sets of assessment comments made by the 15 pairs of students about the 3 responses. To interpret the comments we used 3 themes corresponding to the 3 tasks students undertook: how students completed; assessed and connected the sample student responses.
SECTION 4: RESULTS AND DISCUSSION
When initially attempting to solve the problem one student used a graphical method and another an algebraic method. The rest of the class used a form of ‘trial and improvement’. This concurs with our earlier research (Evans & Swan, 2014) that suggests students often prefer this method rather than, for instance an algebraic strategy. Trial and improvement can forge a way into the problem but the information available within answers are often limited. For instance, trends may not be revealed. Furthermore, most students failed to effectively communicate their answer to ‘Bill’, thus overlooking the purpose of the problem. These results agree with the literature that suggests students often disconnect mathematical representation from the context of the problem and make little attempt to reconnect them (e.g. Friel, Curcio, & Bright, 2001). As trial and improvement was the
commonly used strategy, students were to be exposed to two new approaches and a
familiar one in the intervention lesson.
How students completed the responses
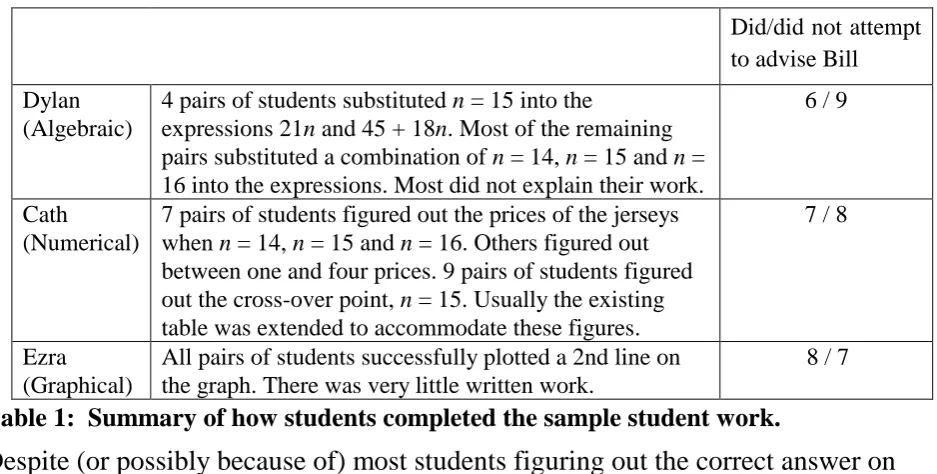
Table 1 summarises how pairs of students completed each response and attempted to advise ‘Bill’ (e.g.‘Top Print is cheaper after 15 jerseys’).
Did/did not attempt to advise Bill
Dylan (Algebraic)
4 pairs of students substituted n = 15 into the
expressions 21n and 45 + 18n. Most of the remaining pairs substituted a combination of n = 14, n = 15 and n = 16 into the expressions. Most did not explain their work.
6 / 9
Cath
(Numerical)
[image:5.595.65.534.443.680.2]7 pairs of students figured out the prices of the jerseys when n = 14, n = 15 and n = 16. Others figured out between one and four prices. 9 pairs of students figured out the cross-over point, n = 15. Usually the existing table was extended to accommodate these figures.
7 / 8
Ezra (Graphical)
All pairs of students successfully plotted a 2nd line on the graph. There was very little written work.
8 / 7
Table 1: Summary of how students completed the sample student work.
Figure 3: Response of two students
These students understood the context, but responded in a superficial way, by finding something procedural to do. They followed the pattern in the first column, and used the procedures for calculating costs correctly, but did not engage in solving the problem using Cath’s method. Thus students did not attempt to understand and adopt Cath’s goals. This may be due to the teacher not fully explaining the purpose of the activity at this stage: once complete the solutions were to be critiqued and connected. Consonant with students’ original attempts to solve the problem there was a notable lack of attempts to interpret their solution in terms of the context (21 out of a possible 45. Of these, only 3 pairs explicitly advise ‘Bill’, the remaining 18 simply explained what the solution showed). However, again not fully understanding the purpose of the activity may discourage students from providing all 3 answers (12 out of the 15 pairs of students did attempt to recontextualise at least one of their solutions). Students may assume they would simply be repeating themselves.
How students assessed the responses
32 of the 45 ‘sets’ of assessment comments suggested students were making direct comparisons between the responses. For example, comments such as ‘it is clear to see the pattern [Ezra’s response] compared to Dylan’s’. There were numerous other assessment comments that implied students were making comparison. For example one pair made the two comments ‘only talked about one particular value [Dylan’s response] and ‘showed the full range of results in a graph [Ezra’s response]. Our evidence suggests that most students were not simply considering the attributes of individual approaches to the problem, but were using comparison to draw out the relative advantages and disadvantages of each. Most students (33 of the 45 sets) were able to make at least two comparative comments on each response and only 8 ‘sets’ made totally positive or totally negative comments; indicating students were using a range of questions when assessing the work and did not feel compelled to declare one solution as the ‘correct one’. This behaviour contradicts the commonly held assumption that mathematical solutions always consist of one right response amongst a hazardous field of wrong ones. It appears that as students compared solutions, similarities, differences, advantages and disadvantages were revealed, discouraging the emergence of a ‘best’ solution. We used 5 categories to investigate the nature of the assessment comments:
Assessments about accessibility. These comments referred to the personal challenges of using the method. E.g., ‘Cath’s method may take a while to do’. Assessment about fitness for purpose. These comments referred to students’
assessment of the legitimacy of the response given the context of the problem. (E.g., ‘hard to find an exact price, big scale, so pretty much guess work’.) Assessment about the incompleteness of the method. These comments arose
despite students being asked to complete each solution. E.g., ‘doesn’t answer the question’.
Undefined assessment comments. These were comments we were unable to categorise. E.g., ‘easiest’.
We then categorised all assessment comments into those expressing advantages and those expressing disadvantages. The results of the coding are given in Table 2:
Assessment about: Algebra (Dylan) Table (Cath) Graph (Ezra) Total
clarity 3 (1,2) 5 (4,1) 1 (1,0) 9 (6,3)
accessibility 7 (7, 0) 5 (0,5) 5 (1,4) 17 (8,9)
fitness for purpose 11 (1,10) 16 (9,7) 30 (17,13) 57 (27,30)
incompleteness of method 3 (0,3) 0 0 3 (0,3)
Undefined 4 (3,1) 7 (5,2) 1 (0,1) 12 (5,3) Total 28 (12,16) 35 (18,15) 37 (19,18) 98 (49,49)
Table 2: The numbers in brackets refer to the (advantages, disadvantages).
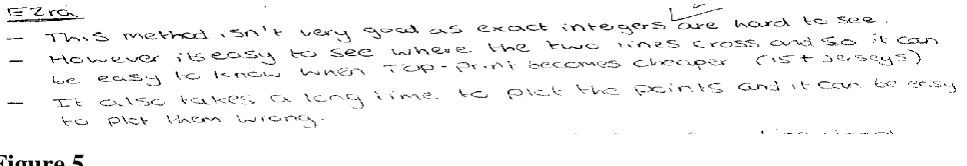
Figure 5
Now we will analyse the nature of these assessments. Rather than critiquing the graphical solution from a personal perspective (6), students clearly preferred to focus on the suitability of the graph within the context (30). The positive comments include: 7 on how the graph allowed them to easily see a trend, 4 on the wide range of costs, and 3 non-specific comments about the appearance of the graph (e.g. ‘easy visually to see’). There were 11 negative comments about the graph’s lack of accuracy due to the scale (e.g. ‘hard to find an exact price, big scale so pretty much guess work’). The tabular method drew 16 comments about the appropriateness of the solution, including positive comments about the accuracy of the costs (2), ease of comparing companies (3), and presentation of specific costs (2). Negative comments referred to the lack of a range of costs (2) and poor visual representation (2). Negative comments about the algebraic method referred to lack of values (4) and lack of detail about which company was cheaper (3). Thus we can detect themes across all three solutions: the accuracy of the work, the range of values used, and the ease of comparing costs. It is conceivable that these themes were instigated through the act of explicitly comparing solutions. For instance, an advantageous property noticed in one solution, may then be assessed in another.
How students connected the responses
Most comments about how solutions were linked were generic. For instance, ‘The two solutions both used the same formula.’ This concurs with research suggesting the need for instructional prompts that draw students’ attention to how methods are linked (e.g. Chazan & Ball, 1999). However, time was another important factor contributing to the quality and number of comments on how responses could be connected. Students simply did not have enough time to complete the task.
CONCLUSION
figuring out this value?’ or ‘How does this result help Bill?’ To ask these questions students need to engage in the ‘student’s’ hierarchical goals.
The findings do support the perspective that comparing properties of solutions to problems does indeed draw out the affordances and limitations of each but without compelling students to decide which one is correct. Students often critiqued solutions from a personal viewpoint, focusing on whether they understood the method and whether they would be able to use it again. However, many students did also critique the suitability of each sample student response within the context of the problem. This was particularly the case with the graphical response.
Although we cannot make any generalisations beyond this classroom setting the findings from this study together with feedback from trials of other lessons will help shape a further iteration of all the resources. It is clear students need more support when undertaking these activities. For example, to help students complete the responses we will suggest teachers provide opportunities for students to reflect on the goals ‘students’ have set. Furthermore, if teachers ensure students understand the purpose of this activity, then they may be motivated to not only complete the mathematics, but also interpret it in the context of the problem. In so doing, differences may emerge in information gained from each completed solution. This in turn may help students undertake the next activity, critiquing the solutions.
We endeavour, through the resources and teacher instruction to further raise awareness of what gets noticed when critiquing, and whether what is noticed and critiqued is of relevance to the context. This may help students move from simply noticing features of the solutions from a personal perspective to noticing them from the perspective of the context of the task. In this case the ‘sample student’s’ and ‘Bill’s’ perspective. For example, it may require just a small shift in perspective to move from asking questions such as ‘How long would this method take me to do?’ to ‘Is this an efficient and elegant method?’ We also plan to design follow-up task in which ‘Bills’ goals are slightly altered. Students will need to think carefully about the criteria for success when planning a strategy and monitoring its progress as it unfolds on the paper or in discussion. We will continue to frame these student tasks within the activity of comparing solutions. We regard this as a successful design strategy.
REFERENCES
Bell, A., Phillips, R., Shannon, A., & Swan, M. (1997). Students’ perceptions of the purposes of mathematical activities. Paper presented at the 21st Conference of International Group for the Psychology of Mathematics Education, Lahti, Finland. Black, P., & Wiliam, D. (1998b). Inside the black box : raising standards through
Burkhardt, H. (1988). Teaching problem solving. In H. Burkhardt, S. Groves, A. Schoenfeld, & K. Stacey (Eds.), Proceedings of the problem solving theme group, ICME 5, Problem solving: A world view (pp. 17-42). Nottingham: Shell Centre. Carlson, M., P. & Bloom, I. (2005). The cyclic nature of problem solving: an
emergent multidimensional problem-solving framework. Educational Studies in Mathematics, 58, 45-75.
Chazan, D., & Ball, D. L. (1999). Beyond being told not to tell. For the Learning of Mathematics, 19(2), 2-10.
Evans, S. & Swan, M. (2014) Lesson design for formative assessment. Educational Designer, 2(7).http://www.educationaldesigner.org/ed/volume2/issue7/article26
Friel, S., Curcio, F., & Bright, G. (2001). Making sense of graphs: Critical factors influencing comprehension and instructional implications. Journal for Research in Mathematics Education, 2(2), 124-159.
Gamer, W. R. (1974). The processing of information and structure. MD: Erlbaum. Gentner, D. (1989). The mechanisms of analogical learning. In S. Vosniadou & A.
Ortony (Eds.), Similarity and analogical reasoning (199-241). London: Cambridge University Press.
Gentner, D., Loewenstein, J., & Thompson, L. (2003). Learning and Transfer: A
General Role for Analogical Encoding. Journal of Educational Psychology, 95(2), 393-408.
Juwah, C., Macfarlane-Dick, D., Mathew, B., Nicol, D., Ross, D., & Smith, B. (2004). Enhancing student learning through effective formative feedback. UK: Higher Education Academy.
McKenney, S., & Reeves, T.C. (2012). Conducting Educational Design Research. UK: Routledge.
Pintrich, P. R., & Susho, A. (2002). Student motivation and self-regulated learning in the college classroom. In J. C. Smart & W.G. Tierney (Eds), Higher Education: handbook of theory and research (vol. XVII). New York: Agathon Press.
Rittle-Johnson, B. & Star, J.R. (2007). Comparing Solution Methods Facilitate Conceptual and Procedural Knowledge? An Experimental Study on Learning to Solve Equations. Journal of Educational Psychology 99 (3), 561–574
Schoenfeld, A. H. (1992). Learning to think mathematically: problem solving, metacognition, and sense making in mathematics. In D. A. Grouws (Ed.), Handbook of Research on Mathematics Learning and Teaching, (334-370). New York: Macmillan.
Seufert, T., Janen, I., & Brunken, R. (2007). The impact of intrinsic cognitive load on the effectiveness of graphical help for coherence formation. Computers in Human Behavior. 23, 1055–1071.
Sfard, A., (1991). On the dual nature of mathematical conceptions: Reflections on processes and objects as different sides of the same coin. Educational Studies in Mathematics 22, 1-36.
Silver, E. A., Ghousseini, H., Gosen, D., Charalambous, C., & Font Strawhun, B. T. (2005). Moving from rhetoric to praxis: Issues faced by teachers in having students consider multiple solutions for problems in the mathematics classroom. Journal of Mathematical Behavior, 24, 287–301.
Swan, M. & Burkhardt, H. (2014). Lesson design for formative assessment. EducationalDesigner,2(7).