Open Peer Review
Discuss this article
(0)
Comments
SOFTWARE TOOL ARTICLE
A Shiny application to enable intuitive resolution of
Crambled:
conflicting cellularity estimates [version 1; referees: 2 approved]
Andy G. Lynch
Cancer Research UK Cambridge Institute, University of Cambridge, Cambridge, UK
Abstract
It is now commonplace to investigate tumour samples using whole-genome sequencing, and some commonly performed tasks are the estimation of cellularity (or sample purity), the genome-wide profiling of copy numbers, and the assessment of sub-clonal behaviours. Several tools are available to undertake these tasks, but often give conflicting results – not least because there is often genuine uncertainty due to a lack of model identifiability.
Presented here is a tool, "Crambled", that allows for an intuitive visual comparison of the conflicting solutions. Crambled is implemented as a Shiny application within R, and is accompanied by example images from two use cases (one tumour sample with matched normal sequencing, and one standalone cell line example) as well as functions to generate the necessary images from any sequencing data set.
Through the use of Crambled, a user may gain insight into why each tool has offered its given solution and combined with a knowledge of the disease being studied can choose between the competing solutions in an informed manner.
Keywords
Cancer , Whole-genome sequencing , Cellularity , Copy number , Sub-clonality , Cell lines , Shiny , R , Bioconductor
This article is included in the
RPackage
gateway.
Referee Status:
Invited Referees
version 1 published 07 Dec 2015
1 2
report report
, Leiden University Medical
Jan Oosting
Center, Netherlands 1
, Uppsala University,
Ingrid Lönnstedt
Sweden 2
07 Dec 2015, :1407 (doi: )
First published: 4 10.12688/f1000research.7453.1
07 Dec 2015, :1407 (doi: )
Latest published: 4 10.12688/f1000research.7453.1
Andy G. Lynch ( )
Corresponding author: [email protected]
No competing interests were disclosed.
Competing interests:
Lynch AG.
How to cite this article: Crambled: A Shiny application to enable intuitive resolution of conflicting cellularity estimates
2015, :1407 (doi: )
[version 1; referees: 2 approved]F1000Research 4 10.12688/f1000research.7453.1
© 2015 Lynch AG. This is an open access article distributed under the terms of the , which
Copyright: Creative Commons Attribution Licence
permits unrestricted use, distribution, and reproduction in any medium, provided the original work is properly cited.
AGL is supported by a Cancer Research UK programme grant (C14303/A20406) to Simon Tavaré and additionally
Grant information:
acknowledges funding from the European Commission through the Horizon 2020 project SOUND (Grant Agreement no. 633974).
The funders had no role in study design, data collection and analysis, decision to publish, or preparation of the manuscript.
07 Dec 2015, :1407 (doi: )
Introduction
The generation of whole-genome sequencing data to investigate tumour samples has become commonplace, thanks in particular to initiatives such as the International Cancer Genome Consortium (ICGC)1. Among the analyses being applied to the data generated are investigations of copy number changes2, structural variants3, and sub-clonality4. These analyses typically require the establish-ment of segestablish-mented copy number profiles for the sample, which in turn rely on estimating the degree of contamination of normal tissue in a sample and the mean ploidy (equivalently the depth of coverage associated with a particular copy number state or the increase in depth associated with an increment in copy number).
Many tools have been developed that allow for the estimation of one or more of sample purity, copy number profile and clonality. These include e.g. ABSOLUTE (www.broadinstitute.org/cancer/ cga/absolute)5, ASCAT (heim.ifi.uio.no/bioinf/Projects/ASCAT)6, CloneHD (github.com/andrej-fischer/cloneHD)7, OncoSNP-SEQ (sites.google.com/site/oncosnpseq/)8 and QPure (sourceforge. net/projects/qpure/)9 (for a more complete review see Yadav and De.10). There are real problems of model identifiability in perform-ing this task, particularly when sub-clonal solutions are allowed, as any errors or discrepancies in the purity, segmentation or identifica-tion of mean ploidy can often be explained as sub-clonal behaviour (many of the issues are discussed in Lonnstedt et al.11). Indeed, many tools acknowledge the inherent uncertainty in the calcula-tions. As a consequence, applying two tools to a data set may return two conflicting solutions.
Contrasting this problem with another common analysis applied to whole-genome cancer sequencing data, that of identifying somatic
single nucleotide variants and indels then there is one striking difference: SNV calls can be easily validated. This can be via a targeted experimental approach, or increasingly commonly through visual assessment using a tool such as the Integrative Genomics Viewer12.
Herein is presented the Crambled tool to enable the visual assess-ment of the alternative purity/depth-of-sequencing solutions that can arise for a tumour sample. Through exploration of the solutions using Crambled one may achieve an appreciation of the reasons for each to have been offered. Coupled with knowledge of the tumour type, and the case history and pathology of the particular patient under examination, it may be possible to then select a preferred solution.
Methods Implementation
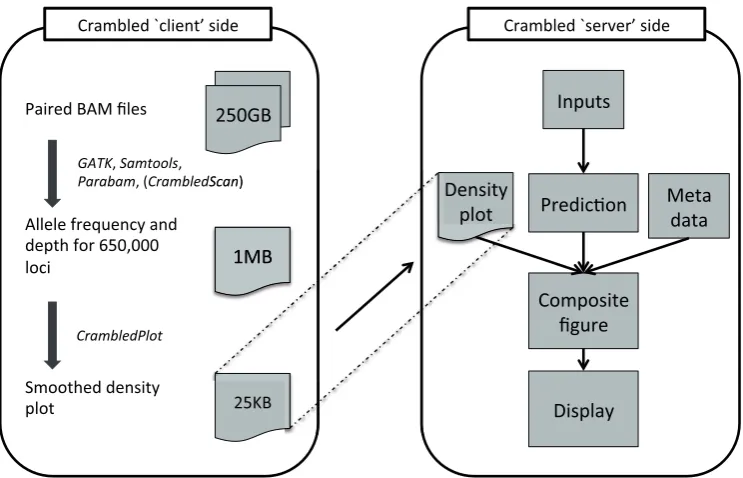
Overview.The Crambled tool is implemented as a Shiny13 applica-tion in R14. In essence it takes in a figure depicting the sequenc-ing data (akin to a patchwork plot15 or grid plot11), constructs a second figure based on a solution for the cellularity/depth condi-tions, and displays them in a superimposed manner. By allowing for a dynamic adjustment of the cellularity/depth solution being considered, Crambled enables an intuitive comparison of compet-ing solutions and a tactile exploration of the solution space that pro-vides insight into why different tools offer different solutions and informs the user in choosing between them.
[image:3.612.121.493.457.696.2]The Crambled tool is divided into two sections as depicted in Figure 1, nominally a ‘client’ side and a ‘server’ side, to avoid having to upload across a network the large BAM files that contain the genome sequencing data.
Even when both ‘client’ and ‘server’ sides are run on the same machine, as is envisaged for a typical user, there are clear benefits to the division of labours. The initial data processing is an expensive operation and should only be performed once, with the output stored for potential repeated and spontaneous investigations in the future.
‘Server’-side tools. The Crambled application consists primarily of a dialogue box for selecting an image representing a sequencing experiment, two sliders for specifying cellularity and the depth of a single copy (that is the depth associated with a single copy present in all cells in a sample or, equivalently, half of the depth of cov-erage in diploid regions), and a display that dynamically updates the selected image with superimposed predictions based on the chosen values.
The display figure is generated by first writing out the predictions to a temporary image before the two image files are combined. For two values, cellularity (C) and single-copy depth (D), the initial predictions for a region with n1 copies of one allele and n2 copies of the second are:
(
)
(
1 2)
Depth= ×D 2× −1 C + n n+ ×C (1) and
(
)
(
1 2 2)
1 1
Minor allele fraction .
2 2
C n
C n n
+ × − =
+ × + −
(2) [image:4.612.96.515.291.682.2]
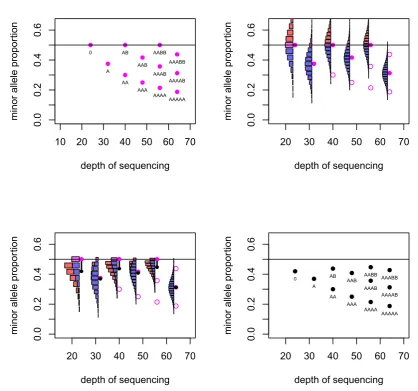
These values are depicted in Figure 2.
For a locus that is heterozygous in the germline sample, the observed minor allele fraction is recorded. If the SNPs are phased, and one is considering a region in allelic balance, then it is possible to take all the allele fractions from one allele and gain a mean fraction of 0.5. Without the phasing information, the minor allele will be taken at each locus and so the mean allele fraction recorded in the region will be below 0.5. Even in regions of strong allelic imbalance, it is possible that the observed allele fraction can exceed 0.5 when the true value does not, and so the mean allele fraction in those regions will also be biased.
Given the true minor allele fraction and depth, the observed fraction of the true minor allele has an estimable probability distribution. The mass of probability for allele fractions greater than 0.5 then ‘folds’ below 0.5 to reflect the distribution of the observed frac-tion of the observed minor allele, which is the value recorded. In this manner, the mean of the distribution is reduced. This effect is greater for small depths of sequencing due to the greater variance in observed allele fraction that comes from having a smaller denomi-nator. The effect is greater also for allele fractions that are close to 0.5 (Figure 2).
The final options available in the server interface allow the user to edit some of the metadata concerning the image loaded into
Cram-bled. Specifically, the user can depict a different range of depths as appropriate for their experimental data, and can specify the size of the image if this is different to the default.
‘Client’-side tools. It may be that the user will already have details
of germline variants, and their depths and allelic fractions in the tumour sample, from which to create an image to load intoCram-bled. Such data may be purposefully sought from tools such as GATK (www.broadinstitute.org/gatk/)16, SAMtools (www.htslib.org/)17, or parabam (parabam.readthedocs.org/). Alternatively, the information may be available as the side effect of running a somatic mutation caller. In the event that such data are not available, functions are supplied with Crambled to enable suitable data to be generated from BAM files.
The function CrambledScan() is accompanied by a file that lists (for Human Genome Issue 19) 177,299 sites that are highly likely to be heterozygous in a sample. This was generated from the “snp138Common” table for hg19 from the UCSC Table Browser18. Rsamtools19 is used to interrogate the BAM files at those locations. At a depth of coverage of about 40×, this typically returns approxi-mately 80,000 heterozygous sites once quality filters have been put in place.
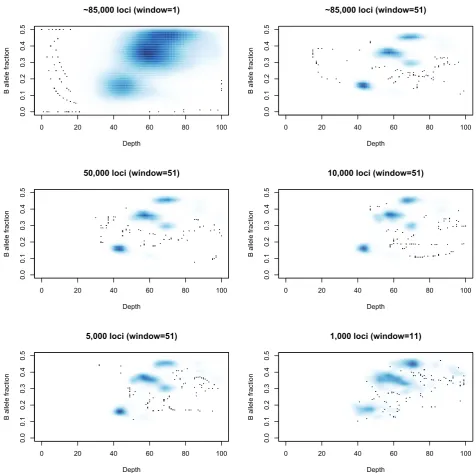
A running median is then applied to the depths and allele fractions at these sites to reduce noise. Note that this is not an attempt to charac-terize the entire genome, but merely to capture the cellularity infor-mation. Thus it does not matter if fine-grain copy number changes are lost in this smoothing. Ideally one would have as many germ-line heterozygous loci as possible (typically 2,000,000 such loci for an individual), but extracting them comes at a computational cost. The approximately 80,000 loci used here will usually suffice for this limited task, and fewer may be feasible as seen in Figure 3.
The need for using a running average is also demonstrated in Figure 3. Note that as the number of heterozygous loci being used decreases, then a window of, e.g., 50 loci represents a much larger genomic region, making it more likely that the values being aver-aged represent several distinct states and that the average will not represent a true state. Reducing that window will increase the noise in the picture and so a balance must be sought that reflects the com-plexity of the genome being studied.
The plotting function (CrambledPlot) takes the output of this approach and produces a standard R plot, but with parameters set to values that the Crambled application will anticipate. Should it be necessary to change these, e.g. to increase the limits on the plot-ting area because a sample has been sequenced to 500× depth of coverage, then the Crambled app needs to be informed via the metadata input options.
Operation
The tool and code presented here are built on top of R14 and Shiny13, and thus will run on a large number of operating systems. The dependencies within R are on the ‘Shiny’ package (obtainable from The Comprehensive R Archive Network [cran.r-project.org]) to run the application, and the ‘Rsamtools’ packages from Bioconductor20 required for the code to prepare images for Crambled. Naturally, if the BAM files have been aligned against a genome other than human genome issue HG-19, then the list of suggested loci for investigation that accompanies the Crambled tool will not be rel-evant and an alternative list must be generated. The user must create an image from the sequencing data of interest (either using the code provided, or independently in the style of the example images) and then load this into the Crambled application. The Crambled appli-cation can be run on a local machine that has R and the R shiny package installed, or it can be run on a Linux machine running the Shiny Server software ( www.rstudio.com/products/shiny/shiny-server/). It has been extensively tested on a Ubuntu 12.04.5 machine running R version 3.2.1, Shiny 0.12.2 and Rsamtools 1.20.5. and an Apple computer running OS X version 10.9.5, R version 3.1.2, Shiny 0.11.1 and Rsamtools 1.18.3.
The code provided with Crambled for creating the images takes approximately 20 minutes to run (using a single processor on a rea-sonable desktop machine) on a single 100GB cell line BAM file, or approximately an hour to run on two 150GB BAM files represent-ing a tumour/normal pair.
Use cases
A tumour/normal pair
The first illustration of Crambled is an application to a previously published tumour/normal pair from an oesophageal adenocar-cinoma (OAC) patient21. Two estimates of cellularity have been suggested in this case: 81% and 68%. While a small variation in estimates is natural, in this case the difference is too great to put down to the (in)stability of the estimate and it warrants investiga-tion with the Crambled tool.
files (here called “SS6003301.bam” and “SS6003302.bam”), within the R environment one types:
> source("crambledfunctions.R")
> CrambledScan(normal="SS6003301.bam", tumour="SS6003302.bam",title="SS6003302")
This produces the file ‘SS6003022-shiny.png’ (available in the ExamplePlots folder at https://github.com/dralynch/crambled.git), that can be loaded into the Crambled application. The application may be operating on a server or, after installing Shiny, within R one can type:
> library(shiny)
> runApp("crambled_app/")
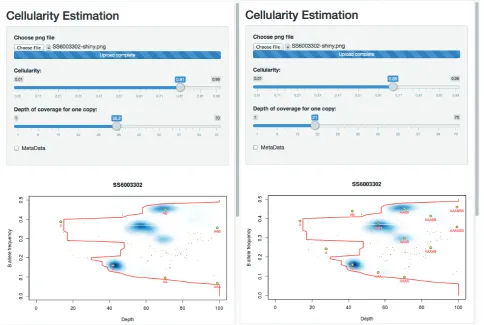
to begin the tool. Uploading the figure, one can then test the two solutions as seen in Figure 4.
One can see that the solution with 81% tumour assumes that the sample is primarily diploid, with some regions of copy number loss and, crucially, some regions of data that lie off of the predicted grid and so must represent ‘sub-clonal’ states. By contrast, the 68%
cellularity solution shows that all of the data lie on the predicted grid (i.e. there is little-to-no evidence of sub-clonality). However this solution suggests that the sample is broadly tetraploid.
Since OAC cases are often tetraploid, and this solution explains away all of the sub-clonality, the 68% cellularity solution seems to be the favourable one. While sub-clonal behaviour is also seen frequently in OAC, and the 81% solution is entirely valid, that the suggested sub-clonality conveniently only occurs at frequencies that can be explained by the tetraploid solution leads to a favouring of 68%.
A cell line
Cell lines present a different problem. Typically one would not be trying to estimate the cellularity of a cell line (which should be pure), but resolving the depth-of-sequencing/copy number can still be an issue, as can confirming that only a single population of cells is present.
[image:7.612.65.550.357.682.2]Commonly, there will be no germline reference sample for a tumour cell line. Coupled with this, due to the (near-)perfect purity of a cell line, it is not possible to distinguish a germline homozygous site
from a heterozygous site that has undergone loss-of-heterozygosity (LOH). Nor is it possible to distinguish a clonal somatic mutation from a germline-heterozygous site.
For the purposes of inferring cellularity, neither of these confusions matters except that in producing a patchwork- or grid- plot the sig-nal from sites with no heterozygosity will drown out any observa-tions from the (more informative) loci that have gained or retained heterozygosity. The purity of the cell line, and the consequent sepa-rating of LOH-representing regions from other regions on the plot allows for separation of the two groups (with a simple threshold on allele fraction) and subsequent down-sampling of the LOH-like regions. Since this case requires different preparation, a separate command is provided for the creation of the plot.
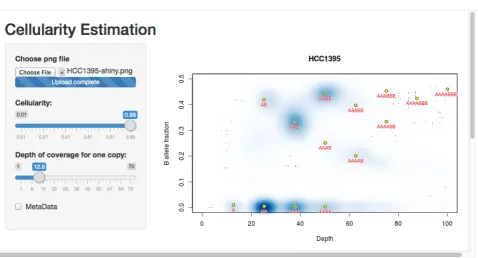
This usage is illustrated using whole genome sequencing from the Genome Modelling System (github.com/genome/gms)22. Three lanes of whole genome sequencing data for the HCC1395 breast cancer cell line (gerald_D1VCPACXX_1.bam, gerald_ D1VCPACXX_2.bam, and gerald_D1VCPACXX_3.bam) were downloaded (via github.com/genome/gms/wiki/HCC1395-WGS-Exome-RNA-Seq-Data) and aligned to the EnsEMBL release 71 assembly of the GRCh37 (hg19) human genome (apr2013.archive. ensembl.org/index.html).
> source("crambledfunctions.R")
> CrambledScanCellline(normal="gerald_D1VCPACXX.
bam",title="HCC1395")
This produces the file ‘HCC1395-shiny.png’ (available in the ExamplePlots folder at https://github.com/dralynch/crambled.git). This image can be loaded into the Crambled application as per the previous use case. Therefore, within R one would type:
> library(shiny)
> runApp("crambled_app/")
The results can be seen in Figure 5. The cell line appears to be a single population of cells, with copy numbers mainly in the 2 to 4 range (with some regions at a copy number of 1, and others at a copy number of 5 but with a four-to-one allele balance). Note that the thresholding of allele fractions may, at low depths, cause an artefactual data cloud to appear in the plot close to the threshold and suggestive of sub-clonality, but that this should be ignored.
Discussion
The code provided to produce the images to load into the Crambled application suffices for the intended purpose, but has shortcom-ings with regard to other tasks. Firstly, it is prohibitively slow if one wishes to search for the complete set of informative loci in the genome, and the resolution that such a set brings to the problem is useful. One of the other tools mentioned in the introduction can be used if this is desired.
[image:8.612.69.548.425.683.2]Secondly, there is no correction either for biases such as GC-related biases in the tumour sample, nor for regions of the normal sample that are polyploid, nor for artefactual mapping. Any of these would
reduce the noise in the figures (particularly that about the depth esti-mate) and could potentially allow fewer loci, or a smaller window for the running average, to be used.
Finally, it should be noted that little effort is required to annotate the uploaded image more than is currently the case. Individual chromosomes could be picked out and highlighted using different colours. Alternatively, if one wanted to know whether e.g. TP53 had undergone LOH, it would be straightforward to mark the location of nearby SNPs and see where they lie in the plot.
Summary
Crambled is a tool that allows for interactive investigation of the
multiple solutions that are possible when inferring the cellular-ity (and related attributes) of a tumour sample that has undergone whole genome sequencing. Implemented as a Shiny application it can be used on most platforms and comes with example files and code to prepare such files from one’s own sequencing data.
Software availability
1. Software available from: https://dralynch.shinyapps.io/ crambled_app (limited usage server - the preference is for the user to download the Crambled application and run it locally)
2. Latest source code: https://github.com/dralynch/crambled. git
3. Link to archived source code as at time of publication: http:// www.dx.doi.org/10.5281/zenodo.3414723
4. License: Lesser GNU Public License 2.0: https://www.gnu. org/licenses/old-licenses/lgpl-2.0.html
Author contributions
AGL conceived and conducted this research.
Competing interests
No competing interests were disclosed.
Grant information
AGL is supported by a Cancer Research UK programme grant (C14303/A20406) to Simon Tavaré and additionally acknowledges funding from the European Commission through the Horizon 2020 project SOUND (Grant Agreement no. 633974).
I confirm that the funders had no role in study design, data collection and analysis, decision to publish, or preparation of the manuscript.
Acknowledgments
The author acknowledges the access to test data provided by the Oesophageal cancer clinical and molecular stratification (OCCAMS) consortium.
References
1. International Cancer Genome Consortium, Hudson TJ, Anderson W, et al.:
International network of cancer genome projects.Nature. 2010; 464(7291): 993–998.
PubMed Abstract |Publisher Full Text |Free Full Text
2. Zack TI, Schumacher SE, Carter SL, et al.: Pan-cancer patterns of somatic copy number alteration.Nat Genet. 2013; 45(10): 1134–1140.
PubMed Abstract |Publisher Full Text |Free Full Text
3. Pleasance ED, Cheetham RK, Stephens PJ, et al.: A comprehensive catalogue of somatic mutations from a human cancer genome.Nature. 2010; 463(7278): 191–196.
PubMed Abstract |Publisher Full Text |Free Full Text
4. Knight SJ, Yau C, Clifford R, et al.: Quantification of subclonal distributions of recurrent genomic aberrations in paired pre-treatment and relapse samples from patients with B-cell chronic lymphocytic leukemia.Leukemia. 2012; 26(7): 1564–75.
PubMed Abstract |Publisher Full Text |Free Full Text
5. Carter SL, Cibulskis K, Helman E, et al.: Absolute quantification of somatic DNA alterations in human cancer.Nat Biotechnol. 2012; 30(5): 413–21.
PubMed Abstract |Publisher Full Text |Free Full Text
6. Van Loo P, Nordgard SH, Lingjaerde OC, et al.: Allele-specific copy number analysis of tumors.Proc Natl Acad Sci U S A. 2010; 107(39): 16910–16915. PubMed Abstract |Publisher Full Text |Free Full Text
7. Fischer A, Vázquez-García I, Illingworth CJ, et al.: High-definition reconstruction of clonal composition in cancer.Cell Rep. 2014; 7(5): 1740–1752.
PubMed Abstract |Publisher Full Text |Free Full Text
8. Yau C: OncoSNP-SEQ: a statistical approach for the identification of somatic copy number alterations from next-generation sequencing of cancer genomes.
Bioinformatics. 2013; 29(19): 2482–2484. PubMed Abstract |Publisher Full Text
9. Song S, Nones K, Miller D, et al.: qpure: A tool to estimate tumor cellularity from genome-wide single-nucleotide polymorphism profiles.PLoS One. 2012;
7(9): e45835.
PubMed Abstract |Publisher Full Text |Free Full Text
10. Yadav VK, De S: An assessment of computational methods for estimating purity and clonality using genomic data derived from heterogeneous tumor tissue samples.Brief Bioinform. 2015; 16(2): 232–241.
PubMed Abstract |Publisher Full Text
11. Lönnstedt IM, Caramia F, Li J, et al.: Deciphering clonality in aneuploid breast tumors using SNP array and sequencing data.Genome Biol. 2014; 15(9): 470. PubMed Abstract |Publisher Full Text |Free Full Text
12. Robinson JT, Thorvaldsdóttir H, Winckler W, et al.: Integrative genomics viewer.
Nat Biotechnol. 2011; 29(1): 24–6.
PubMed Abstract |Publisher Full Text |Free Full Text
13. Chang W, Cheng J, Allaire JJ, et al.: shiny: Web Application Framework for R. R package version 0.11.1. 2015.
14. R Core Team: R: A Language and Environment for Statistical Computing. R Foundation for Statistical Computing, Vienna, Austria. 2014.
Reference Source
15. Mayrhofer M, DiLorenzo S, Isaksson A: Patchwork: allele-specific copy number analysis of whole-genome sequenced tumor tissue.Genome Biol. 2013; 14(3): R24.
PubMed Abstract |Publisher Full Text |Free Full Text
16. McKenna A, Hanna M, Banks E, et al.: The Genome Analysis Toolkit: a MapReduce framework for analyzing next-generation DNA sequencing data.
Genome Res. 2010; 20(9): 1297–303.
PubMed Abstract |Publisher Full Text |Free Full Text
17. Li H, Handsaker B, Wysoker A, et al.: The Sequence Alignment/Map format and SAMtools.Bioinformatics. 2009; 25(16): 2078–9.
PubMed Abstract |Publisher Full Text |Free Full Text
18. Karolchik D, Hinrichs AS, Furey TS, et al.: The UCSC Table Browser data retrieval tool.Nucleic Acids Res. 2004; 32(Database issue): D493–6.
19. Morgan M, Pagès H, Obenchain V, et al.: Rsamtools: Binary alignment (BAM), FASTA, variant call (BCF), and tabix file import. R package version 1.18.3. 2015. Reference Source
20. Gentleman RC, Carey VJ, Bates DM, et al.: Bioconductor: Open software development for computational biology and bioinformatics.Genome Biol. 2004;
5(10): R80.
PubMed Abstract |Publisher Full Text |Free Full Text
21. Weaver JM, Ross-Innes CS, Shannon N, et al.: Ordering of mutations in
preinvasive disease stages of esophageal carcinogenesis.Nat Genet. 2014;
46(8): 837–43.
PubMed Abstract |Publisher Full Text |Free Full Text
22. Griffith M, Griffith OL, Smith SM, et al.: Genome Modeling System: A Knowledge Management Platform for Genomics.PLoS Comput Biol. 2015; 11(7): e1004274. PubMed Abstract |Publisher Full Text |Free Full Text
Open Peer Review
Current Referee Status:
Version 1
19 February 2016 Referee Report
doi:
10.5256/f1000research.8030.r12383
Ingrid Lönnstedt
Department of Immunology, Genetics and Pathology, Uppsala University, Uppsala, Sweden
The article describes "Crambled", an online application to investigate cellularity/ploidy solutions of
genome sequencing copy number data. The easily accessible and soundly developed tool, enabling
informed choices between potential solutions, is the main contribution of this study. It also comprises
additional advances to existing methods, as (i) the naturally occurring bias in minor allele fractions of
heterozygous loci is assessed and adjusted for, and (ii) crambled suggests potentially heterozygous sites
which can add substantially to the information a solution choice is based upon.
These are minor suggestions to improve the article:
I would have enjoyed some performance statistics on Crambled, for example showing the fraction
of samples tried that were successfully resolved, or the fractions of samples tried that had in
practice a good fit to expected cluster centers for at least say 70% of the genome. At the moment I
can only see the overall performance of a couple of of samples, and Figure 2 seems to be based
on simulated data so I cannot assess whether this strategy works out well with real data.
I have only tried the online Crambled application, not the full from bam file setup which requires
source download. Based on the current version of the article, it is not obvious to me whether the full
downloadable version of Crambled returns a list with the copy numbers of a chosen cellularity
solution are assigned to genomic locations, or whether this solutions (which will commonly be a
central desired outcome of the analysis) have to be extracted with a different software.
In the last section before Discussion, I do not understand where the "cloud close to the threshold"
is, which is falsely suggesting subclonality. Could that be explained better?
The png figures to be supplied to Crambled should show "minor allele proportion" versus "depth of
sequencing". Preferably explain that "depth of sequencing" is different from the definition of
"Depth" in equation 1 (assuming you mean the total depth, not just the depth of one copy).
I think many readers would have enjoyed some more instructions on how to play with the cellularity
and depth in the application. What should I try to achieve, what should I try to avoid?
No competing interests were disclosed.
Competing Interests:
I have read this submission. I believe that I have an appropriate level of expertise to confirm that
it is of an acceptable scientific standard.
05 January 2016 Referee Report