1
Small Ring Testing of a Creep Resistant Material
C. J. Hyde1*, T. H. Hyde1, W Sun1, S. Nardone2, and E. De Bruycker2
1 The University of Nottingham, UK 2 Laborelec, Belgium
* Corresponding author: Dr. Christopher J. Hyde (Research Fellow in Materials, Mechanics and Structures), Department of Mechanical, Materials and Manufacturing Engineering, University Park, Nottingham, NG7 2RD,
Christopher.Hyde@nottingham.ac.uk, +44 (0)115 9513735
Abstract
Many components in conventional and nuclear power plant, aero-engines, chemical plant etc., operate at temperatures which are high enough for creep to occur. These include steam pipes, pipe branches, gas and steam turbine blades, etc. The manufacture of such components may also require welds to be part of them. In most cases, only nominal operating conditions (i.e. pressure, temperatures, system load, etc.) are known and hence precise life predictions for these components are not possible. Also, the proportion of life consumed will vary from position to position within a component. Hence, non-destructive techniques are adopted to assist in making decisions on whether to repair, continue operating or replace certain components. One such approach is to test a small sample removed from the component to make small creep test specimens which can be tested to give information on the remaining creep life of the component. When such a small sample cannot be removed from the operating component, e.g. in the case of small components, the component can be taken out of operation in order to make small creep test specimens, the results from which can then be used to assist with making decisions regarding similar or future components. This paper presents a small creep test specimen which can be used for the testing of particularly strong and creep resistant materials, such as nickel-based superalloys.
2 1 Introduction
There is a strong and increasing desire to obtain information on the creep behaviour/failure of pieces of material which are too small to manufacture conventional uniaxial specimens from (see Figure 1). Ideally, standard creep curves (behaviour up to and including fracture) are what are required. This is the case for applications such as operating power-plant steam pipes, from which a small amount of material can be removed and tested in the laboratory. Such small amounts of material are usually extracted via the ‘scoop’ method [1], as shown in Figure 2. These scoop samples can then be manufactured into small specimen form and tested.
Another application of when small specimen creep testing is required is when creep information is required for the airfoil material of heavy-duty gas turbine components. The complex geometry of the internal cooling channels in turbine blades and vanes reduces the available material for creep assessment. These components are often made from Nickel-based superalloys such as Inconel 738. Such materials have been used many times for high temperature application and are detailed in [2].
3 The last application of small-size creep testing technique is when creep assessment of small turbine components, such as from aero-derivative engines, makes the extraction of conventional creep samples impossible.
In those applications, the component must be taken out of service and small specimen/s manufactured from the component, results from which can assist decisions on similar/replacement components. It is especially useful if this information can be used to predict how much longer the component can safely stay in service. Such information is extremely useful for ranking assessments [3]. By enabling the use of smaller samples to determine creep properties, creep testing can be extended to smaller components. The amount of samples that can be extracted out of one single component is increased as well, which enlarges the creep data and refines the integrity assessment.
There are several small specimen test types which can be used for obtaining creep properties from small amounts of material, namely sub-size conventional test specimens, impression creep (IC) specimen tests, small punch (SP) specimen tests and small ring (SR) specimen tests, which is the specimen type, the performance of which is the subject of this paper. Each specimen type has its own unique advantages and disadvantages and in some cases it may not be obvious which one is the most appropriate test method to use. This paper gives a brief description of each specimen and associated test type and describes their practical limitations.
2 Small specimen creep testing
4 2.1 Subsize uniaxial, small punch and impression creep tests
2.1.1 Subsize, uniaxial creep specimen testing
Conventional, sub-size and miniature, uniaxial creep specimens (see part (a) of Figure 3 and Figure 4) can be tested in the same way as full size, conventional, uniaxial creep specimens and results can be expected to be very much comparable [5]. A major advantage of this test type is that it enables the user to obtain not only the creep behaviour of the material but also the fracture/failure time of the sample. Problems with this specimen type include the manufacture of the specimen as it is often the case that the screw-ends have to be electron beam welded onto the gauge section. Also, although it is recommended that the gauge section be at least 1mm in diameter, it is not entirely clear what the minimum value of this dimension should be in order to ensure that ‘bulk’ creep properties are obtained; it is necessary to ensure that enough grains exist through the thickness of the specimen. Also, for small gauge sections of 1 mm, oxide scale formation during long duration creep testing in air can significantly reduce the section. It is therefore recommended to test these creep specimens in protective environment to reduce the influence of oxide formation on the creep lifetime.
2.1.2 Small punch creep testing
5 deformations cause the specimen, which starts as a flat plate, to end up being approximately conical in shape with a part-spherical shaped end and the large strains encountered cause, for most materials tested using the SP creep test method, the corresponding failure strains from uniaxial tests are in excess of roughly 25%. Also, there is often evidence of localised "necking" at or near the edge of contact between the specimen and the punch, at which position the strains are significantly greater than the general strain level in the specimen as a whole. These factors cause the interpretation of the results to be difficult. Although the results of a SP test resemble that of a conventional creep test, due to some of the issues mentioned, the strains occurring during what appears to be a secondary softening region are roughly 15-30% where the uniaxial equivalents are roughly 2-3%. Hence this region must be associated with tertiary creep where the increasing rate in strain (due to tertiary behaviour) is balanced by a coning ‘stiffening’ effect. No analytical, mechanics based solution is available. However, although there are problems with this test type, it has been widely used and a draft Standard [6] for this test type exists. Also this specimen type has an advantage over the other specimen types in that it produces fracture/failure data, and although it may not be the case that this data can be confidently interpreted, it may be used as a ranking method of different materials.
2.1.3 Impression creep testing
IC specimen testing (see part (c) of Figure 3 and Figure 4) has also received extensive attention over previous years and is performed by pushing a flat-faced indenter into a (typically) square specimen. This test method is capable of giving both primary and secondary creep behaviour and results can be seen to be very much comparable to that obtained by conventional uniaxial creep testing [7]. In addition to this, conversion relations (for converting
6 , to the uniaxial creep strain rate, has been established based on the reference stress method (mechanics based and not temperature, load level or material dependant). However, the test deformations from this test are very small and hence accurate deformation measurement apparatus are required and temperature fluctuations and other causes of test noise can greatly affect the quality of the data obtained. A limitation of this test method is that the indenter must have a significantly higher creep strength than the specimen material, and therefore materials which are highly creep resistant, such as nickel-based superalloys, cannot usually be tested using this test type.
2.2 Small ring creep testing
2.2.1 Specimen geometry and conversion relationships
SR creep testing, (see part (d) of Figure 3 and Figure 4), is a relatively new, high sensitivity, type of small specimen creep test which is capable of producing primary and secondary creep data of materials. It has some unique advantages over the other specimen types as are discussed below. The test consists of diametrically loading of a (circular or elliptical) ring and measuring the load line deformation of the specimen (see Figure 5).
For this test geometry, an analytical solution for the load line deformations has been obtained, based on the complementary strain energy approach [8]. A reference stress approach was used to establish the conversion relationships between the applied load and the equivalent uniaxial reference stress and between the experimentally measured load-line creep
deformation rate, , and the equivalent uniaxial creep strain rate, , [8], these conversions are as follows:
𝜎"#$= 𝜂 𝑃𝑎
𝑏*𝑑, (1)
𝜀̇𝑐
7
𝜀. 𝜎 "#$ =
𝑑
4𝑎𝑏𝛽Δ2 (2)
where η and β (conversion factors) are constants and vary with the specimen dimensions, as shown in Figure 6, a and b are the major and minor axis dimensions of the elliptical specimen, as shown in Figure 5, bo is the specimen depth and d is the specimen thickness as shown in
Figure 5.
2.2.2 Experimental procedure
Figure 7 shows a photograph of the experimental set-up shown in Figure 4(d) for the SR specimen test.
The SR specimen is placed into the test machine (Tinius Olsen H25KS machine is used at Nottingham) and a constant load applied diametrically to the specimen via loading pins (see Figure 4d and Figure 7). The resulting deformations are large in comparison to that of the sub-size uniaxial and impression creep test types due to the flexible nature of the SR specimen type resulting in a large equivalent gauge length of the SR specimen type (see Appendix A). These high levels of deformation allow for tests to be performed at lower equivalent stresses than the other specimen types and allows low strains to be obtained from the relatively large deformations.
2.2.3 Advantages of the small ring testing technique
8 to, for example, temperature fluctuations, etc. This is an advantage over all of the other small specimen types.
In addition to this, an analytical solution for the deformation of the specimen has been obtained by use of the complimentary strain energy approach and a mechanics-based (reference stress) method for the conversion from load and deformation to the corresponding uniaxial stress and creep strain rate can be made, and these conversion relationships are material independent and are relatively insensitive to the geometry changes which occur during deformation.
In addition to above, a unique major advantage of the SR type of small specimen creep test is that, any specimen can be tested provided that the loading pins are similarly creep resistant to the specimen. Therefore the loading pins could be made from the same material as the specimen and hence any material can be tested using this test method. Therefore, for components such as power-plant steam pipes, which are usually made from iron-based materials, several small specimen creep methods may be valid. However, for more creep resistant materials such as Inconel 738, a nickel-based superalloy used for many engineering components such as gas turbine blading parts, this is not the case. Below (section 4) are the results of a series of SR creep tests performed on an ex-service Inconel 738 third stage blade from a heavy-duty gas turbine which are compared with equivalent uniaxial (full-size) creep test data.
9 3 Specimen manufacture
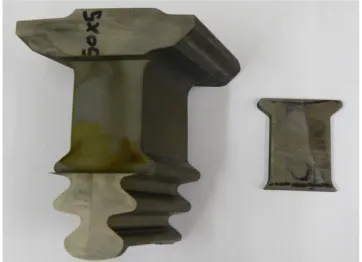
An ex-service Inconel 738 third stage blade from a heavy-duty gas turbine was selected for the testing program (see Figure 8). The blade did not experience any refurbishment. The root of the blade was selected for creep assessment. This area represents the material in its virgin condition, since it is not exposed to high stresses and temperatures. It is common practice to use the root of gas turbine blades as a reference of the as-cast and heat-treated material for metallurgical evaluation.
A small section of the root was extracted along the main direction of the blade using a circular saw and appropriate cooling agents (see Figure 9). Six small rings were then prepared by electron discharge machining (EDM) (see Figure 10).
4 Small ring creep testing results for Inconel 738
Figure 11 shows the results of four SR creep tests taken from the root of an ex-service blade made of Inconel 738, a nickel-based superalloy, exhibiting primary and secondary creep strain regions.
It can be seen from Figure 11 that primary and secondary creep deformations are present in the SR creep test curves. However, at a closer look, a small amount of continual curvature (decreasing deformation rate) is present within the ‘secondary region’ and a completely saturated (constant) strain rate is not quite achieved. This is due to the effect of the specimen deformation which occurs during the test. Equation (1) shows the expression used to calculate the applied test load, P, which remains constant throughout the test, based on a desired test reference stress, σref. As with all of the creep test types discussed within this
paper, this applied load is held constant throughout the test. Whilst bo and d are constant
10 value of a decreases, the corresponding σref also decreases. However, if it is intended that the
data is used to obtain the constants for a material model such as the Norton secondary creep model [9] as shown by equation (3), and for corresponding conventional plots of stress vs. minimum strain rate be made from the SR data, values for the secondary MSRs are required.
𝜀345= 𝐴𝜎5 (3)
These values of MSR have been calculated by considering the data within the secondary (small amount of curvature) creep region. For the 300MPa data, for example, it can be seen from Figure 11 that after 100hours the data has entered into the secondary (small amount of curvature) creep region (i.e. the primary region has been completed). From this point onwards the local values of extension and extension rate at regular time intervals can be
used to calculate the values of and at each interval position. An example of this for the
300MPa data at 500 hours can be seen in appendix B. The averages of the values and the values from each time interval can then be taken in order to give the final values. Using these values a plot of stress vs. MSR on a log-log scale has been produced as shown in Figure 12. Figure 12 also contains the results of equivalent conventional (full-size) uniaxial tests (see Figure 1) for the same material at the same temperature [10-11] and shows that the SR data compares extremely well with the conventional creep test data.
Work is currently being conducted in order to allow for adaptive load tests to be carried out for this SR creep test type in order that the σref be constant throughout the test.
This is expected to result in a clear secondary (constant strain rate) region being present in the resulting creep data (equivalent to Figure 11). This will eliminate the need to interpret the data as shown in appendix B and will allow for interpretation of the data to be identical to that of a conventional creep test in order to produce plots of the data in the form as shown in Figure 12. Further accuracy to the already excellent correspondence between the SR and uniaxial data
𝜎𝑟𝑒𝑓 𝜀𝑐̇
𝜎𝑟𝑒𝑓
11 (see Figure 12) may also be achieved by conducting adaptive load tests as the tests will then be constant σref tests as is the intention.
5 Inconel 738 Material
The nickel-based superalloy Inconel 738 was selected for SR creep testing since this material is one of the first superalloys used for gas turbine hot gas path section. Inconel 738 is considered as a standard reference material in literature and its creep properties have been widely studied, resulting in the consolidation of a large creep database on new and exposed service materials.
Inconel 738 mainly consists of Nickel which provides a high strength at high temperature. Alloying elements such as Chromium, Aluminium, Cobalt, Titanium, Tungsten and Tantalum are also added to further improve the strength properties as well as corrosion and oxidation resistance. The chemical composition of the blade material used for the SR tests was cross-checked with the specifications of Inconel 738 alloy as found in the literature [2]. A scanning electron microscope equipped with an energy dispersive spectroscope provided a semi-quantitative analysis of the base material. The results are given in Table 1.
12 6 Metallographic examination of crept small ring specimens
After being tested, three small ring specimens were visually inspected and prepared for metallographic examination (for example, see Figure 15). Each ring specimen was individually embedded in resin and polished with diamond discs and diamond paste up to ¼ µm. The metallographic cross-sections were then etched using MoO3 to reveal the g’ phase and evaluate the microstructure with particular attention paid to the ageing and creep processes.
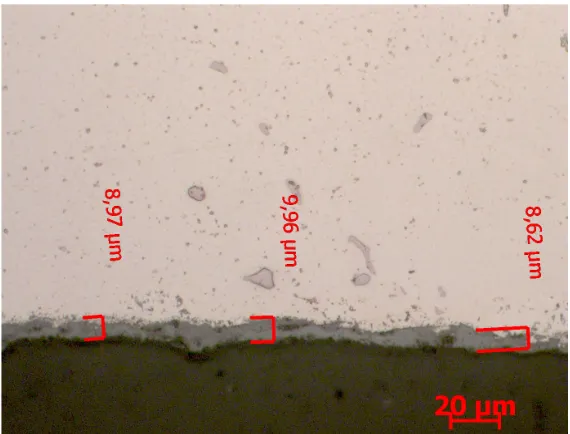
The thickness of the oxide layer measured with the light optical microscope was less than 10 µm along the three investigated ring specimens, which ensures that ‘bulk’ creep properties are obtained (see Figure 16). The three ring specimens showed a conventional g’ microstructure after etching (see Figure 17). No cracks or significant anomalies were observed on the specimens, which is in accordance with the sample being in the secondary creep state as shown in Figure 11.
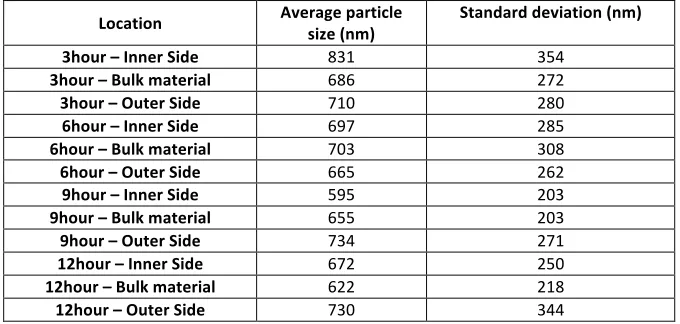
The average particle size of the primary cuboïdal g’ particles was quantified by automated analysis of scanning electron images of the etched ring specimens. For each ring specimen, twelve images were thoroughly investigated. The locations of the image analysis are depicted in Figure 18. The image software outlines the primary cuboïdal g’ particles as depicted in Figure 19 (green line enclosing a g’ particle).
13 7 Conclusions
A number of conclusions have been made during this investigation. These are: • This Small Ring specimen can be used for testing creep resistant materials. • The method for the processing of the data obtained from the current
experimental procedure proposed in this paper provides results which a very comparable to those obtained from standard uniaxial creep testing.
• It has been determined that a test set-up where adaptive loading is possible (in order to maintain a constant σref) would be advantageous in terms of data
accuracy and processing.
• Bulk creep properties are obtained from this test type.
8 Discussion and future work
A useful, small ring creep test method has recently been developed [8, 12]. An analytical method which relates the specimen load and dimensions to the load-line displacement has been obtained. There are many advantages to be gained by using the test method (see section 2), including the fact that any material, including highly creep resistant materials such as nickel-based superalloys, can be tested. The current work, which shows the method applied to the root of an ex-service blade made of Inconel 738 material, is extremely encouraging when compared with conventional uniaxial data.
14 believed that this will further improve the already extremely encouraging results presented in this paper in terms of both a more clear secondary creep region and the comparison of the small ring creep test data with the uniaxial equivalents.
The metallographic examination confirmed the growth of a very thin oxide layer on the ring-specimen, which ensures that ‘bulk’ creep properties are obtained during the SR test. A further improvement of the technique would be to increase the testing temperature in order to simulate the creep conditions of the airfoil of the gas turbine blade in the range of 900°C to 1000°C.
The application of the SR method has showed encouraging results on the conventional cast nickel-based superalloy Inconel 738, which has isotropic creep properties. Most of gas turbine manufacturers, however, equip the first stage rotating blades with directionally solidified (DS) or single crystal (SC) nickel-based superalloys. These materials provide an excellent creep resistance in severe temperature and loading conditions. Since these DS and SC materials present anisotropic creep properties, the orientation of the loading direction is essential for creep assessment purposes. For this reason, a good understanding of the stress field of the SR specimen by finite element calculations would be a relevant topic to investigate further.
The small ring creep test method has now been validated for steel materials [8, 12], and a Nickel-based superalloy material and further validation of the method, for highly creep resistant materials (e.g. other Nickel-based superalloys), is in progress. The airfoil material of the latter ex-service blade will be tested to evaluate the remaining life assessment of this blade.
16 Appendix A: Equivalent gauge length (EGL) explanation
For a conventional uniaxial creep test:
𝜀.= Δ
𝐺𝐿 (A1)
where GL is the gauge length of the specimen. Equation (A1) can be generalised non-conventional small creep test specimens to:
𝜀. = Δ
𝐸𝐺𝐿 (A2)
where EGL is the equivalent gauge length. Following on from this, expressions can be obtained for the EGL of each specimen type as shown in Table A1, where di is the width of the IC test
indenter and ap is the diameter of the gap between the lower dies in the SP test set-up (see
Figure A1). Applying typical specimen values to these expressions, typical EGL values for each specimen type can be determined as shown in Table A2.
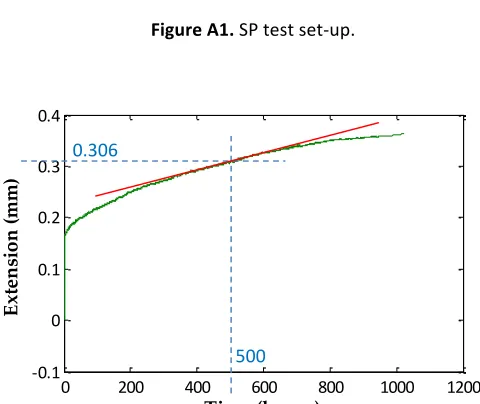
Appendix B: Example calculation of and for the 300MPa data at 500 hours
Figure B1 shows how the extension, , and extension rate, , for the 300MPa data at 500 hours. The values are shown in Table B1.
These values allow for the instantaneous of the major and minor axes of the ring as follows:
a = ai – Δ/2 (B1)
b = bi + Δ/2 (B2)
where ai and bi are the initial values of a and b.
I.e. a = 5 – 0.306/2 = 4.847
b = 5 + 0.306/2 = 5.153
The ratio of or a/b then allows for the instantaneous values of η and β to be obtained (see Figure 6).
𝜺𝒄̇ 𝝈𝒓𝒆𝒇
17
I.e. a/b = 4.847/5.153 = 0.941
η = 0.902 β = 0.431
All values required for calculating the instantaneous and values are then known (see equations (1) and (2)) as follows:
𝜎"#$ = 𝜂 𝑃𝑎
𝑏*𝑑, = 0.902×
1663.5×4.847
2.5×1, = 𝟐𝟗𝟎. 𝟖𝟐𝐌𝐏𝐚
𝜀. 𝜎 "#$ =
𝑑
4𝑎𝑏𝛽Δ2=
1
4×4.87×5.153×0.431×1.839×10MN= 𝟒. 𝟐𝟕𝟓×𝟏𝟎M𝟔𝐬M𝟏
This process is repeated at many intervals throughout the “secondary” (low, decreasing rate curvature region) and the averages taken in order to give the and values of for each test.
𝜎𝑟𝑒𝑓 𝜀𝑐̇
18 References
[1] T. H. Hyde, W. Sun and S. J. Brett, “Some recommendations on standardisation of impression creep testing”, European Creep Collaborative Committee on Creep and Fracture in high Temperature Components – Design and Life Assessment, 21st-23rd April 2009, Dubendorf, Switzerland, p. 1079-1087.
[2] C. T. Sims, N. S. Stoloff, “Superalloys II: High Temperature Materials for Aerospace and Industrial Power”, John Wiley & Sons, USA, 1987.
[3] W. Sun, T. H. Hyde and S. J. Brett, “Application of impression creep data in life assessment of power plant materials at high temperatures”, Proc. of the Inst. of Mech. Eng, Part L , J. of Mat: Des and App222 (2008), p. 175-182.
[4] T. H. Hyde and W. Sun, “Some considerations on specimen types for small sample creep tests”, Mat. at High Temp., 27 (2010), p. 157-165.
[5] M. C. Askins and K. D. Marchant, “Remaining-life estimation of boiler pressure parts: Volume 2, Miniature specimen creep testing: Final report”, Report no. EPRI-CS-5588-Vol.2, 1988, USA, 37 pages.
[6] “CEN CWA 15627 Workshop Agreement: Small punch test method for metallic materials (Part A)”, European Committee for Standardisation, December 2006, p. 6-39. [7] T. H. Hyde, W. Sun and A. A. Becker, “Analysis of the impression creep test method
using a rectangular indenter for determining the creep properties in welds”, Int. J. of Mech. Sci., 38 (1996), p. 1089-1102.
[8] T. H. Hyde, and W. Sun, “A novel, high sensitivity, small specimen creep test”, J. of Str. Anal., 44 (2009), p. 171-185.
[9] F. H. Norton, “Creep of steel at high temperatures”, McGraw-Hill Book Co., New York, 1929, 90 pages, 1st edition.
[10] J. Granacher, T. Preussler, “Creep of some gas turbine materials”, International Conference on Advances in Material Technology for Fossil Power Plants, 1st-3rd September 1987, p. 511-518.
[11] J. Hakl, T. Vlasak, “High temperature properties of selected ni-base superalloys”, 8th Liege Conference: Materials for Advanced Power Engineering Conference, 8th-20th September 2006, Liege, Belgium, p.366 -374.
19 Figures
[image:19.595.167.426.480.643.2]Figure 1. Uniaxial creep test specimen (GL » 30 – 50mm; dGL » 6 – 10mm; L = 100 – 130mm).
Figure 2. Scoop sample (a) Extraction of, (b) Close-up image, (c) Schematic representation of a typical scoop sample and (d) Schematic representation through x-x.
Figure 3. Shapes and typical dimensions of small creep test specimens: (a) Conventional sub-size uniaxial specimen (GL » 5 – 12mm and dGL » 3 – 5mm) and conventional miniature uniaxial specimen (GL >3dGL and dGL < 3mm); (b) SP test specimen (D » 8mm and to » 0.5mm); (c) IC test specimen (w = bi » 10mm, di
» 1mm and h » 2.5mm) and (d) SR test specimen (R » 5mm, d » 1mm and depth bo » 2mm). L
GL
dGL
x x
~ 30mm
View onx-x ~ 3mm
~ 20mm
(a) (b) (c) (d)
(b)
D to
(c)
bi
w di
h
(d)
d
R
(a)
GL
20
[image:20.595.225.371.366.464.2]Figure 4. Schematics diagrams showing the small specimen testing loading arrangements (specimens shown in grey): (a) Uniaxial; (b) SP; (c) IC and (d) SR.
[image:20.595.182.384.520.678.2]Figure 5. Schematic diagram of a SR specimen.
Figure 6. Variation of the η and β parameters with a/b. (a) Uniaxial
P
(d) SRT P
(c) ICT P
P
(b) SPT
P
V V,D D !
d
a b
P
bo- thickness
0.2 0.4 0.6 0.8 1
0.5 1 1.5 2
h
and
b
a/b
Fig. 11Variation of the hand bparameters with a/b.
21
[image:21.595.138.463.318.445.2]Figure 7. Experimental set-up for the SR test.
Figure 8. Third stage gas turbine blade from a heavy-duty gas turbine.
[image:21.595.208.389.496.627.2]22
[image:22.595.172.413.294.468.2]Figure 10. Ring specimens and remains from EDM operations.
Figure 11. SR creep test data for Inconel 738 (nickel-based superalloy) at 800°C.
Figure 12. Data shown in Figure 11 plotted as stress vs. MSR (minimum creep strain rate) on a log-log scale and compared with equivalent uniaxial data (see Figure 1).
0 200 400 600 800 1000 1200 0
0.1 0.2 0.3 0.4 0.5 0.6 0.7
Time (hours)
Ext
en
si
on
(m
m
)
260MPa 300MPa 350MPa 400MPa
Uniaxial [10] Uniaxial [11]
Uniaxial – Laborelec data 260MPa – Ring
[image:22.595.110.488.521.697.2]23
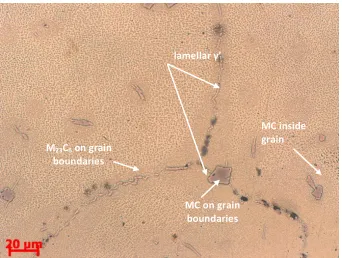
Figure 13. Light Optical Micrograph after etching of the root of the blade showing the g’ distribution and different carbides.
Figure 14. Scanning Electron Micrograph after etching of the root of the blade showing the primary g' morphology (black cuboïdal particles dispersed in the matrix).
lamellar γ’
MC on grain boundaries M23C6 on grain
boundaries
MC inside grain
Cuboïdalprimary γ’ particles
[image:23.595.139.457.402.678.2]24
Figure 15: Overview of ring specimen after SR test by binocular (800°C – 400MPa).
[image:24.595.156.441.348.565.2]25
Figure 17: Standard microstructure of crept ring specimen at 800°C and 400MPa after etching by light optical microscope (x200).
[image:25.595.200.398.367.622.2]26
Figure 19: Scanning Electron Microscope image of ring specimen crept at 800°C and 400MPa (3hour).
[image:26.595.160.439.364.543.2]27
Figure A1. SP test set-up.
Figure B1. 300MPa data indicating the extension (dashed blue lines) and extension rate (red line) at 500 hours.
Rs
Ball
ap
Lower die
Upper die
Load
Disc
Puncher
0 200 400 600 800 1000 1200
-0.1 0 0.1 0.2 0.3 0.4
Time (hours)
Ext
en
si
on
(m
m
)
0.306
[image:27.595.171.411.243.445.2]28 Tables
Table 1. Chemical composition of blade material compared with literature data, semi-quantitative analysis (wt.%).
Ni Al Ti Cr Co Mo Ta W Nb
[image:28.595.128.468.209.371.2]Blade material 60.39 3.13 3.46 17.20 8.58 1.94 1.88 2.52 0.83 IN738 [2] bal 3.40 3.40 16.00 8.50 1.70 1.70 2.60 0.90
Table 2: Average particle sizes of the ring specimen tested at 800°C and 400MPa.
Location Average particle size (nm) Standard deviation (nm)
3hour – Inner Side 831 354
3hour – Bulk material 686 272
3hour – Outer Side 710 280
6hour – Inner Side 697 285
6hour – Bulk material 703 308
6hour – Outer Side 665 262
9hour – Inner Side 595 203
9hour – Bulk material 655 203
9hour – Outer Side 734 271
12hour – Inner Side 672 250
12hour – Bulk material 622 218
[image:28.595.105.492.400.451.2]12hour – Outer Side 730 344
Table A1. Equivalent gauge length (EGL) of small creep specimens [4].
Uniaxial Impression Small Punch* Small Ring
EGL GL ≈ 2di ≈ 2ap 4𝑎𝑏𝛽
𝑑
[image:28.595.105.492.511.604.2]* It is difficult to define material and deformation independent parameters, due to the nature of the test.
Table A2. Equivalent Gauge Length values for typical specimen geometries.
Uniaxial Impression Small Punch Circular Small Ring Elliptical Small Ring
Dimensions (mm)
GL = 10 dGL < 3
bi = 10 di = 1 h = 2.5
D ≈ 8 ap = 2 RS = 1.25
to = 0.5
a = b = 5 d = 1
a/b = 2 a = 5 d = 1
EGL (mm) 10 ≈ 2 ≈ 5* 45 22.5
* Estimated by the first term of the empirical (ε-Δ) relationship [4].
𝜀 = 0.17959∆ + 0.09357∆,+ 0.00440∆W
𝑃 𝜎 = 1.72476∆ + 0.05638∆,+ 0.17688∆W
Table B1. Extension and extension rate values for the 300MPa data at 500 hours.
∆(mm) 0.306