Application of small punch creep testing to a thermally sprayed
CoNiCrAlY bond coat
H. Chen, T. H. Hyde K. T. Voisey and D. G. McCartney*
Division of Materials Mechanics and Structures,
Faculty of Engineering, University of Nottingham,
University Park, Nottingham NG7 2RD UK
Abstract
High velocity oxy-fuel thermal spraying was used to prepare free-standing CoNiCrAlY (Co–31.7%Ni-20.8%Cr-8.1%Al-0.5%Y (wt%)) bond coat alloy samples approximately 0.5 mm thick. Creep tests were conducted at 750 C on these samples using a small punch (SP) creep test method. The samples were characterised before and after creep testing using scanning electron microscopy with electron backscatter diffraction (EBSD). EBSD revealed a two phase fcc -Ni and bcc B2 β-NiAl microstructure with grain sizes ~ 1-2 m for both phases, which did not change significantly following testing. The constant temperature SP test data were characterised by a minimum creep strain rate, , and a total time to failure, tf , at different applied stresses. The data are fitted to conventional power law equations with a stress exponent for creep close to 8 in the Norton power law and between 7 and 10 in the Monkman-Grant creep rupture law. Creep rupture was predominantly due to creep cavitation voids nucleating at both the γ – β interphase boundaries and the -
grain boundaries leading to final failure by void linkage. However, rupture life was
influenced by the quantity of oxide entrained in the coating during the spray deposition process.
Manuscript
Keywords: HVOF thermal spraying; MCrAlY bond coat; mechanical testing; creep; phase transformation
*Corresponding Author. Tel.: +44-115-9513749; Fax: +44-115-9513800. E-mail address: [email protected]
1. Introduction
Ni). Overlay coatings, deposited by low pressure plasma spraying (LPPS), vacuum plasma spraying (VPS) or, more recently by high velocity oxy-fuel (HVOF) thermal spraying, have become more widely used because of advantages such as lower cost, better control of composition and the ability to employ complex alloys very different in composition from the superalloy substrate. MCrAlY alloys are typically complex multi-phase materials and can comprise, for example, fcc -Ni and bcc B2 β-NiAl phases or , β and ordered (Ni3(Al,Ti)) phases and can have a composition which is tailored to achieve specific performance needs in particular applications [10]. Furthermore, the thermally sprayed bond coat microstructure depends critically on the following factors: the alloy composition; the type of thermal spray process used; the process parameters employed and the overall coating thickness deposited. All of these factors can affect the mechanical properties of the coating. It is therefore important to distinguish between the mechanical behaviour of bulk MCrAlY alloys and that of MCrAlY coatings produced by industrially relevant thermal spray processes and with thicknesses relevant to TBC applications (typically ~ 200 m thick). Published work on the high temperature mechanical properties of MCrAlY alloys is somewhat sparse, despite the importance of their creep and yield properties to the durability of TBC systems and failure by spallation. Early work by Smith [11] on a thick free-standing CoCrAlY alloy prepared by LPPS demonstrated that it showed ductile-to-brittle transition behaviour around 700 C but over 70% elongation in a tensile test at 850
C. Later, Hebsur and Miner [12, 13] undertook constant load creep rupture tests on
et al. [14] using bulk MCrAlY alloys prepared by hot isostatic pressing of gas atomised powders to determine creep parameters whereas Clyne and co-workers [15] used the VPS method to make 1.4 mm thick samples of NiCrAlY and CoNiCrAlY alloys for creep testing of miniature tensile samples at 750 and 850 C. Primary, secondary and tertiary creep regimes were noted and steady state creep rates derived from their experiments. Also Taylor et al. [16] reported a method for the evaluation of the creep properties of as-deposited MCrAlY coatings by using a composite tensile specimen in which the overall strain/time response had to be deconvoluted to obtain the creep characteristics of the coating. They claimed that the thin coating behaved differently from a bulk alloy of the same chemistry.
Generally, researchers have fitted their creep data to the well-known power-law creep equation
where is the stress, n is the stress exponent, Q is the apparent activation energy for creep, R is the gas constant, T is the absolute temperature, A is a constant and is the steady state creep rate. However, there is wide variation in the values of n, A and Q that are reported. Bose [17] provides a useful summary of the somewhat limited data on both ductile-to-brittle transition and creep of bond coat materials.
a miniature disc-shaped test specimen typically 8-10 mm in diameter and around 0.5 mm thick. The test is carried out by applying a loaded ball to one surface of the disc which is firmly clamped around its rim. The response to applying a constant load over a period of time is then recorded to obtain creep displacements. The SP test for creep behaviour involves complex deformation processes [19]. Nevertheless, a recent review [20] has indicated that SP creep testing can lead to consistent results providing jig and specimen geometry are carefully controlled. Hitherto, the SP test has been most widely used for assessing creep behaviour of bulk steels used in nuclear and conventional power plant [21] where its ability to characterise in-service materials using only a small volume of material has been of significant benefit. More recently, it has been shown capable of analysing different zones of weldments in both creep resistant steel [22] and a nickel-based alloy[23]. However, SP testing of MCrAlY bond coats does not appear to have been previously reported.
2. Experimental
2.1 Materials, HVOF thermal spraying and heat treatment
The coatings used in the creep experiments were prepared by HVOF thermal spraying using powder with the following nominal composition Co–31.7%Ni-20.8%Cr-8.1%Al-0.5%Y (wt%). The powder was obtained from Praxair (CO-210-24) and had a size range of -45+20 m with a chemically analysed oxygen content of 0.037 wt% O. The coatings were deposited onto mild steel substrates with dimensions 60 × 25 × 1.8 mm using a Met Jet III liquid fuel HVOF gun. The details of the spraying process and procedures are given elsewhere [24]. Two sets of coatings were produced for this study in two separate spray runs and hereafter are referred to as C1 and C2. The primary spray parameters employed were nominally identical for the two runs. Coatings were sprayed to a thickness of approximately 0.5 mm and were then debonded from the mild steel by bending around a mandrel.
Detached coating samples were vacuum heat treated at 1100 °C for 2 h followed by natural cooling, to replicate the initial heat treatment given to bond coat alloys during TBC manufacture. Previous work has shown that such a heat treatment is sufficient to reduce to a minimal level any porosity that might be present in these coatings after HVOF spray deposition [24]. Specimens 8 mm diameter in the form of discs for SP testing were cut from the heat treated coatings by electro-discharge machining. They were ground down from the as-deposited thickness and polished to a final thickness of approximately 430 m using 1 m diamond paste. The final thickness was controlled to within ± 8 m as measured by a digital micrometer.
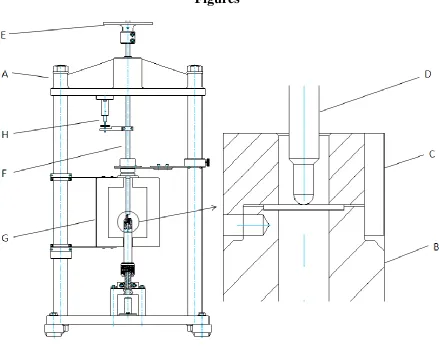
The small punch tests were carried out in line with the guidance provided in the CEN Workshop Agreement, CWA 15627:2006 E [25], using the equipment shown schematically in Fig. 1. It comprises a steel frame, A, a sample holder, B, which supports the sample and a clamping head, C. A hemispherical, high temperature steel, punch, D, is positioned co-axially with respect to the axis of the sample. The load is placed on the pan, E, and is transmitted to the sample via the vertical rod, F. The sample is maintained at a constant temperature by the furnace, G, and displacements are measured through the punch movements and recorded by a LVDT transducer, H, to an accuracy of ± 1 m.
In the present work, SP creep tests were carried out by employing loads ranging from 67.5 to 100 N at 750 °C in air. For each creep test, the displacement of the centre of the disc, , was recorded as a function of time.
Load can be converted to stress using equation (2), derived from membrane stretching theory [25], where ap is the distance between the punch axis and clamping edge, ap=2 mm in all experiments reported in this paper. Rs is the radius of the punch, which is 1.25 mm and t0 is the thickness of the disc, which is 0.430 mm. Ks is a non-dimensional correction factor to take account of localized necking during large strain deformation. It is believed to be material dependent and for steels is typically around 1.2. In the present work load was converted to stress using equation (2) and taking Ks to be 1.
2.3 Material characterisation
The microstructures of coating cross-sections before and after testing were examined. Small samples were cut, mounted in conducting resin, ground and diamond polished to a 1 m finish. In the case of samples taken following testing, these were cut from different regions so that deformed and undeformed sections could be studied i.e. reference samples were taken from the clamped region where the alloy had been at elevated temperature but had not undergone creep.
The oxygen contents of the sprayed coatings were determined by inert gas fusion combustion analysis of debonded material at an external laboratory.
3. Results
3.1 Microstructure of the coatings prior to testing
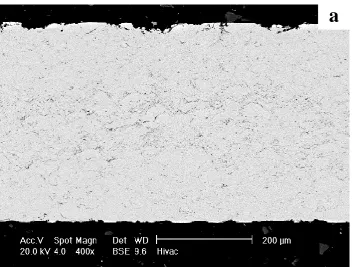
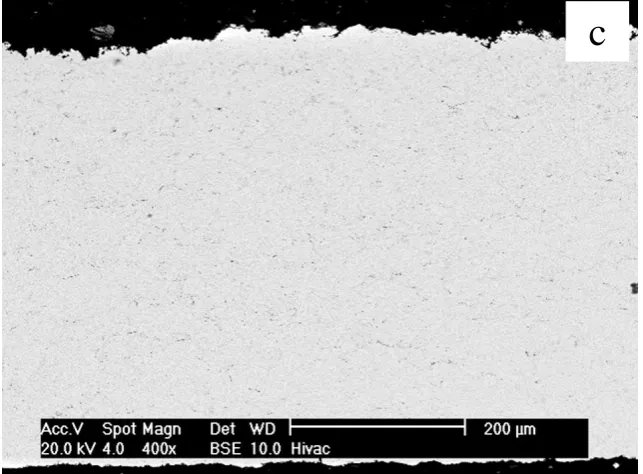
The microstructures of the vacuum heat treated coatings C1 and C2 prior to testing are shown in Fig. 2. It is evident from Figs. 2(a) and (c) that there is very little porosity apparent in both of the samples. As previously reported [24], this CoNiCrAlY coating has a two phase microstructure, consisting of the dark contrast bcc-β (Co,Ni)Al phase and the light contrast fcc-γ Ni-rich matrix phase. The volume fraction of the
uniformly distributed β phase was found by image analysis to be around 33% in both C1 and C2, with an average β-phase size of 1- 2 m.
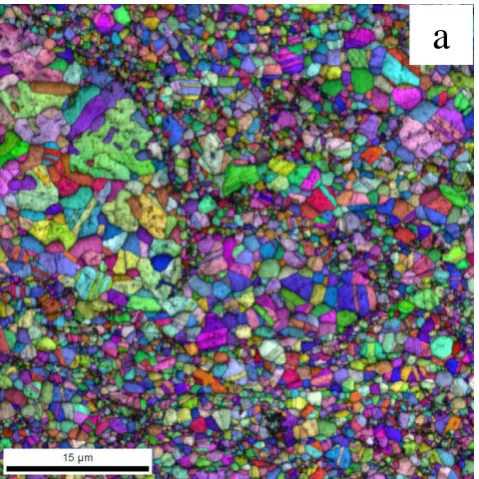
Figure 3 shows EBSD - derived inverse pole figure and phase distribution maps for vacuum heat treated coating C1 prior to testing. These figures reveal that the -phase dimensions are typically 0.8-2 m as noted previously and that - regions appear to be monocrystalline, The -phase is clearly polycrystalline with equiaxed grains that display a wide range of grain diameters typically from 2 m 500 nm or less. Many of the grains are also twinned. There is no evidence for preferred orientation in either the or phases.
3.2 Creep behaviour
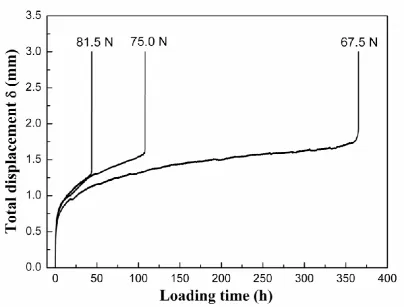
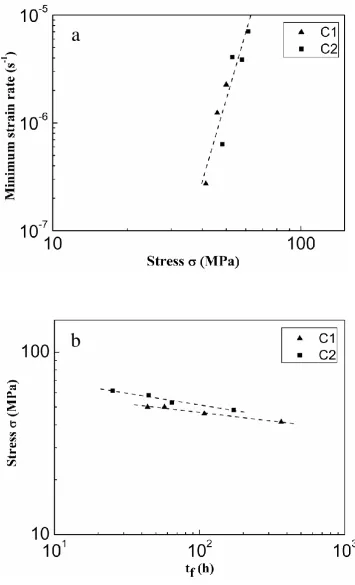
Typical small punch test creep curves from tests of C1, showing the increase in displacement with time, are seen in Fig. 4. It can be observed that there is a large initial and primary component of deformation, an approximately linear, secondary, region with a gradient, , which is the minimum displacement rate. Finally, an accelerating tertiary region leads to fracture. These curves show a similarity to typical uniaxial creep curves which normally exhibit primary, secondary and tertiary creep regions. The constant temperature SP test data can also be characterised by a minimum creep strain rate, , and the total time to failure, tf , at different applied stresses. These values are usually represented graphically on plots of log( ) versus log(σ) and log(σ) versus log(tf), as depicted in Figs. 5(a) and 5(b), respectively; the
and values are obtained using equations (2) – (4). Linear relationships have often been obtained in these types of plots for various steels and other alloys using the Norton power law at constant temperature (Eq. (5)),
In the present case, data for C1 and C2 (Fig. 5(a)) are found to lie on a common Norton power law best fit line and the parameters B and n are given in Table 1. In the case of the rupture power law, there is evidently a displacement of the data sets for C1 and C2 (Fig. 5(b)) and each coating has been separately fitted to the rupture power law (equation 6) with the parameters, M and given in Tables 2; for an equivalent stress level, coating C1 fails at a shorter time.
3.3 Post-test microstructural characterization
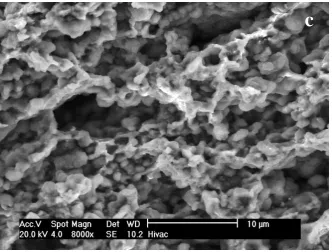
Fig. 6 shows typical secondary electron images of the fracture surface of coating C1 tested at 50 MPa. The dome-shaped nature of the failed disc is evident in Fig. 6(a). There is no evidence for any brittle cracking and extensive deformation is evident which is consistent with the punch displacement of ~ 1.5 mm at this stress. At higher magnification, Figs. 6(b) and (c), there is evidence of cavitation, ductile tearing of the
-matrix and a variety of rounded and angular particles are evident on the fracture
be occurring in material located at approximately the edge of contact between the specimen and the spherical punch.
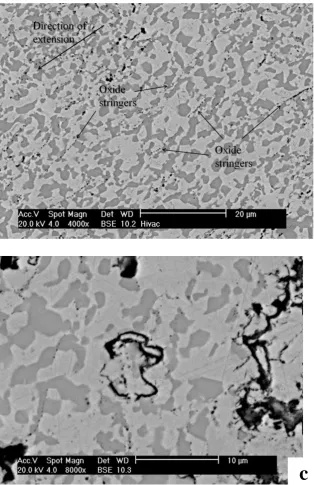
In the clamped region, i.e. to the right of region A, the microstructure was found to be essentially unchanged in terms of the -phase size and morphology and the : phase proportions. This indicates that exposure to 750 C for the duration of the test did not, in itself, induce significant microstructural changes. The grey contrast features in between regions A and B were found to be cavities with extensive internal oxide brought about by oxidation during testing which was undertaken in air, Fig. 7(b).
Higher magnification micrographs of the region A and B are shown in Figs. 7(c) and (d) respectively. There is some evidence that the fine oxides formed during thermal spraying align as a result of the creep deformation as shown by the arrows. In Fig. 7(d) it is evident that local voids are initiated in region B and appear to have linked together to form rather larger cavities seen in Fig. 7(b). 8
Figure 8 shows both an EBSD – derived inverse pole figure and a phase map of a section taken from region B shown in Fig. 7. It is clear that -phase regions have not coarsened significantly during the test and that β has remained monocrystalline with no preferred orientation. Similarly the -phase grains show little change in that they have remained equiaxed, of similar diameter range and have not developed a preferred orientation. Creep failure seems to be occurring predominantly along both
- grain boundaries and - interphase boundaries. There is no evidence for
4. Discussion
4.1 Relationship to uniaxial creep testing
Small punch creep tests at various loads on both C1 and C2 confirm that at 750 C creep deformation occurred and produced displacement curves typical of the SP test [19]. As has been previously stated [19], these curves are only superficially similar in form to those typically seen in uniaxial tests. The tertiary creep region of a uniaxial test typically begins at a creep strain of 1- 5% for most materials. In contrast, the equivalent feature in a SP test, when the minimum deformation rate occurs (at a deformation of 1 mm or more), is seen to be at strains of approximately 30% or more as indicated by equation (3). Hence, the minimum displacement rate in SP tests should not be considered to be directly related to the secondary creep region of a uniaxial creep test. The secondary region in the data from a SP test is a result of a balance between the “stiffening effects” of the reducing cone angle which develops during the test and the increasing contact area between specimen and indenter and “accelerating effects” of the material being in the tertiary creep region as well as the thinning of material in the contact region, as deformation increases. Therefore, the minimum displacement rate, , is related to the tertiary creep region of the
hitherto and that SP creep test data can be usefully used to estimate material creep constants from the well known creep laws (equations (5) and (6)). The log-log plots in Fig. 5 show that the results obtained from SP testing of these HVOF CoNiCrAlY coatings also fall on straight lines, indicating that their constant temperature creep behaviour at 750 C can be described by the Norton and Monkman-Grant laws. Hence, even if there are limitations in relating SP data to uniaxial creep test data the SP method is a valuable tool for assessing and, quantitatively comparing, creep behaviour of thin, thermally sprayed bond coat alloys.
4.2 Creep fracture of the bond coat samples in the SP test
The log-log plot of minimum strain rate versus stress (Fig. 5(a)) shows that results from both coatings fall on the same straight line, indicating very similar material behaviour during creep deformation. This is not, in itself, surprising given the essentially identical microstructures of the two coatings. However, some difference in behaviour of the two coatings is seen in the plot of stress versus time to failure (Fig. 5(b)) where coating C1 fails at shorter times for a given stress. Coating C1 was found to have a marginally higher overall oxygen content by chemical analysis, 0.40 compared with 0.36 wt% O and, as can be seen from Fig. 2(a), there is a visible band of material in the middle of C1 which was particularly rich in oxide stringers which would account for the higher oxygen level in chemical analysis. The formation of such a band is possibly due to a temporary perturbation in the HVOF process. It seems possible therefore that this microstructural difference between the two coatings is somehow responsible for the earlier creep failure of C1 as discussed below.
indicate that deformation in the SP test of the CoNiCrAlY HVOF coating is dominated by creep of the γ-matrix (Figs. 7 and 8). Extensive tertiary creep as seen here is generally due to a high density of mobile dislocations which increases with strain. However, the alloy eventually fractures because of the gradual evolution of grain boundary cavitation. Indeed Figs. 7(c) and 8(b) provide evidence for creep cavitation voids nucleating at γ – β interphase boundaries as well as at - grain boundaries. It is likely that once nucleated the voids continue to grow leading to final failure by void linkage. The extensive internal oxidation of voids seen in Fig. 7(b) supports this view. It is important to recall that at 750 C the -NiAl phase has little ductility [28] and brittle second phase particles have previously been noted as preferential sites of void nucleation during creep of, for example, duplex stainless steel [29], Nimonic 80A [30] and SiC reinforced aluminium [31].
4.3 Comparison with previous studies
5. Conclusions
1. In this work it is shown that the small punch test is a suitable method for determining the creep behaviour of free-standing HVOF thermally sprayed MCrAlY coatings. When compared with the testing of monolithic bulk samples of the coating alloy, this method has an advantage in that the thin samples exhibit similar microstructural features to those of bond coats in service.
2. The Norton power law parameter, n, (equation 5) for two separate coatings (C1 and C2) sprayed in different experiments, but with nominally identical parameters, was determined to be the same within the range of test conditions employed; the value of n is approximately 8.
3. Different rupture power law parameters were determined for C1 and C2 over the range of stress studied at 750 C. The coating C1 with the higher oxide content is found to fail at shorter times for a given stress.
4. The creep rupture is primarily due to creep cavitation voids nucleating at both the γ – β interphase boundaries and the - grain boundaries leading to final failure by void linkage. However, oxide particles could also play a role in creep failure by acting as additional void nucleation sites.
References
[1] A.G. Evans, D.R. Mumm, J.W. Hutchinson, G.H. Meier, F.S. Pettit, Progress in Materials Science, 46 (2001) 505-553.
[2] B.A. Pint, I.G. Wright, W.J. Brindley, J Therm Spray Technol, 9 (2000) 198-203. [3] U. Schulz, C. Leyens, K. Fritscher, M. Peters, B. Saruhan-Brings, O. Lavigne, J.M. Dorvaux, M. Poulain, R. Mevrel, M.L. Caliez, Aerosp. Sci. Technol., 7 (2003) 73-80.
[4] C. Mercer, S. Faulhaber, N. Yao, K. McIlwrath, O. Fabrichnaya, Surface & Coatings Technology, 201 (2006) 1495-1502.
[7] Y.H. Sohn, J.H. Kim, E.H. Jordan, M. Gell, Surface & Coatings Technology, 146 (2001) 70-78.
[8] J. Kameda, T.E. Bloomer, Y. Sugita, A. Ito, S. Sakurai, Materials Science and Engineering A-Structural Materials Properties Microstructure and Processing, 234 (1997) 489-492.
[9] J. Kameda, T.E. Bloomer, Y. Sugita, A. Ito, S. Sakurai, Materials Science and Engineering A-Structural Materials Properties Microstructure and Processing, 229 (1997) 42-54.
[10] J.R. Nicholls, JOM, 52 (2000) 28-35.
[11] R.W. Smith, Thin Solid Films, 84 (1981) 59-74.
[12] M.G. Hebsur, R.V. Miner, Materials Science and Engineering, 83 (1986) 239-245.
[13] M.G. Hebsur, R.V. Miner, Thin Solid Films, 147 (1987) 143-152.
[14] A.A. Wereszczak, J.G. Hemrick, T.P. Kirkland, J.A. Hayes, T.J. Fitzgerald, J.E.Junkin, in: International Gas Turbine and Aeroengine Congress and Exhibition, ASME, Stockholm, Sweden, 1998, pp. ASME Paper No. 98-GT-403.
[15] J.A. Thompson, Y.C. Tsui, R.C. Reed, D.S. Rickerby, T.W. Clyne, Creep of plasma sprayed CoNiCrAlY and NiCrAlY bond coats and its effects on residual stresses during thermal cycling of thermal barrier coating systems, in: J. Nicholls, D. Rickerby (Eds.) High Temperature Surface Engineering, IOM, Edinburgy, 2000, pp. 199-212.
[16] M.P. Taylor, H.E. Evans, C.B. Ponton, J.R. Nicholls, Surface & Coatings Technology, 124 (2000) 13-20.
[17] S. Bose, High Temperature Coatings, Butterworth-Heinemann, 2007. [18] R. Hurst, V. Bicego, J. Foulds, Small Punch Testing for Creep - Progress in Europe, in: Proceedings of the ASME Pressure Vessels and Piping Conference 2007, Vol 9, 2008, pp. 433-438.
[19] T.H. Hyde, M. Stoyanov, W. Sun, C.J. Hyde, Journal of Strain Analysis for Engineering Design, 45 (2010) 141-164.
[20] T.H. Hyde, W. Sun, J.A. Williams, International Materials Reviews, 52 (2007) 213-255.
[21] D.T. Blagoeva, R.C. Hurst, Materials Science and Engineering A-Structural Materials Properties Microstructure and Processing, 510-11 (2009) 219-223. [22] S.-i. Komazaki, T. Kato, Y. Kohno, H. Tanigawa, Materials Science and
Engineering A-Structural Materials Properties Microstructure and Processing, 510-11 (2009) 229-233.
[23] B.J. Kim, Y.B. Sim, J.H. Lee, M.K. Kim, B.S. Lim, Procedia Engineering, 10 (2011) 2579-2584.
[24] S. Saeidi, K.T. Voisey, D.G. McCartney, J Therm Spray Technol, 18 (2009) 209-216.
[25] C.E. CEN Workshop Agreement, "Small Punch Test Method for Metallic Materials", in, 2006.
[26] X. Mao, M. Saito, H. Takahashi, Scripta Metallurgica et Materialia, 25 (1991) 2481-2485.
[27] Y.W. Ma, S. Shim, K.B. Yoon, Fatigue & Fracture of Engineering Materials & Structures, 32 (2009) 951-960.
[28] R.D. Noebe, R.R. Bowman, M.V. Nathal, International Materials Reviews, 38 (1993) 193-218.
[30] D.R. Hayhurst, J. Lin, R.J. Hayhurst, International Journal of Solids and Structures, 45 (2008) 2233-2250.
Figure Captions
Figure 1.
A schematic diagram of the small punch test rig showing an overall view and an enlarged view of the sample holder, B.
Figure 2
Back scattered electron micrographs showing the microstructures of the vacuum heat treated samples prior to testing. (a) low magnification and (b) high magnification of sample C1; (c) low magnification and (d) high magnification of sample C2.
Figure 3.
(a) Inverse pole figure map and (b) phase distribution map derived from ESBD data of heat treated coating C1 prior to creep testing. The -phase is coloured red and the -phase green in (b).
Figure 4.
Typical small punch test displacement curve at 750 C of coating C1 for three different loads
Figure 5
Log-log plots of (a) minimum strain rate versus stress and (b) stress versus time to
Figure 6
Fracture surface of C1 at a stress of 50 MPa and 750 C: (a) overall view of sample fracture. (b) and (c) fracture surface and higher magnification showing evidence of cavitation, ductile tearing and variety of rounded and angular particles.
Figure 7
(a) Low magnification BSE image of a cross section through a sample removed from the test rig prior to final failure ( 40 MPa for 1000 h) showing cavity formation between A and B and final fracture beginning close to B.
(b) Higher magnification image of region near B showing grey contrast features are oxide-filled creep rupture cavities.
(c) and (d) are BSE images of cross sections taken from areas close to regions A and B respectively. The arrows on (c) show some alignment of the micron sized oxides whilst in (d) small voids are visible (early stage creep rupture).
Figure 8.
Figures
Figure 1.
A schematic diagram of the small punch test rig showing an overall view and an enlarged view of the sample holder, B.
[image:22.595.80.520.82.428.2]Figure 2
Back scattered electron micrographs showing the microstructures of the vacuum heat treated samples prior to testing. (a) low magnification and (b) high magnification of sample C1; (c)
a
a
Figure 2
Back scattered electron micrographs showing the microstructures of the vacuum heat treated samples prior to testing. (a) low magnification and (b) high magnification of sample C1; (c) low magnification and (d) high magnification of sample C2.
c
Figure 3.
(a) Inverse pole figure map and (b) phase distribution map derived from ESBD data of heat treated coating C1 prior to creep testing. The -phase is coloured red and the -phase green in (b).
a
Figure 4.
Figure 5. Log-log plots of (a) minimum strain rate versus stress and (b) stress versus time to
failure for C1 and C2 in the small punch creep test. Experiemental data are represented by symbols and best fitting lines obtained using equations (5) and (6)
a
Figure 6 Fracture surface of C1 at a stress of 50 MPa and 750 C: (a) overall view of sample fracture. (b) and (c) fracture surface and higher magnification showing evidence of cavitation, ductile tearing and variety of rounded and angular particles
a
Figure 6 Fracture surface of C1 at a stress of 50 MPa and 750 C: (a) overall view of sample fracture. (b) and (c) fracture surface and higher magnification showing evidence of cavitation, ductile tearing and variety of rounded and angular particles.
Figure 7. (a) Low magnification BSE image of a cross section through a sample removed
from the test rig prior to final failure ( 40 MPa for 1000 h) showing cavity formation between A and B and final fracture beginning close to B. (b) Higher magnification image of region near B showing grey contrast features are oxide-filled creep rupture cavities. (c) and (d) are BSE images of cross sections taken from areas close to region A and B respectively. The arrows on (c) show some alignment of the micron- sized oxides whilst in (d) small voids are visible (early stage creep rupture).
a
[image:30.595.82.456.51.271.2]Figure 7. (a) Low magnification BSE image of a cross section through a sample removed from the test rig prior to final failure ( 40 MPa for 1000 h) showing cavity formation between A and B and final fracture beginning close to B. (b) Higher magnification image of region near B showing grey contrast features are oxide-filled creep rupture cavities. (c) and (d) are BSE images of cross sections taken from areas close to region A and B respectively. The arrows on (c) show some alignment of the micron- sized oxides whilst in (d) small voids are visible (early stage creep rupture).
Figure 8. (a) Inverse pole figure map and (b) phase distribution map derived from ESBD data of a section taken from a creep tested sample corresponding to region B in Fig. 7. The -phase is coloured red in (b) and there is no evidence of preferred orientation in (a).
Table 1
Norton power law parameters for C1 and C2 (combined data sets)
B (s-1 MPa-n) n
C1
6.0 10-20 7.9
C2
Table 2
Rupture power law parameters for C1 and C2 (individual data sets)
M (h-1 MPa-)
C1 3.3 10-20 10.5
C2 1.2 10-15 7.6
[image:33.595.150.441.127.171.2]