The influence of sediment characteristics on the
abundance and distribution of E. coli in estuarine
sediments
Adam James Wyness
This thesis is submitted in partial fulfilment for the degree of PhD
at the
i 1. Candidate’s declarations:
I, Adam James Wyness hereby certify that this thesis, which is approximately 65000 words in length, has been written by me, and that it is the record of work carried out by me, and that it has not been submitted in any previous application for a higher degree.
I was admitted as a research student in September 2012 and as a candidate for the degree of Doctorate of Philosophy (PhD) in September 2013; the higher study for which this is a record was carried out in the University of St Andrews between 2012 and 2016.
Date …… signature of candidate ………
2. Supervisor’s declaration:
I hereby certify that the candidate has fulfilled the conditions of the Resolution and Regulations appropriate for the degree of Doctorate of Philosophy (PhD) in the University of St Andrews and that the candidate is qualified to submit this thesis in application for that degree.
Date …… signature of supervisor ………
3. Permission for publication: (to be signed by both candidate and supervisor)
In submitting this thesis to the University of St Andrews I understand that I am giving permission for it to be made available for use in accordance with the regulations of the University Library for the time being in force, subject to any copyright vested in the work not being affected thereby. I also understand that the title and the abstract will be published, and that a copy of the work may be made and supplied to any bona fide library or research worker, that my thesis will be electronically accessible for personal or research use unless exempt by award of an embargo as requested below, and that the library has the right to migrate my thesis into new electronic forms as required to ensure continued access to the thesis. I have obtained any third-party copyright permissions that may be required in order to allow such access and migration, or have requested the appropriate embargo below.
The following is an agreed request by candidate and supervisor regarding the publication of this thesis:
ii
Acknowledgments
Firstly, I am eternally grateful to all of my supervisors. Thank you to Prof. Dave Paterson and Dr. Emma Defew at St Andrews University for your guidance and supervision, and for always finding time for me during my fleeting visits and the longer discussions going through chapters at a time. Your advice and suggestions on the initial project plan, to your patience reviewing chapters during the write-up was brilliant.
Thank you also to Dr. Lisa Avery and Dr. Marc Stutter at The James Hutton Institute. Lisa- thank you for your constant support and guidance, and encouragement to always ‘give it a go’, and the regular ‘have you got 5 minutes?’ resulting in me emerging from your office an hour later. I also appreciate that you could always find time for me during challenging circumstances. Marc- thank you for jumping in when things got complicated and getting your head round data for a whole chapter within a few minutes to guide me on the analysis.
Thank you to all the staff at The James Hutton Institute for having the time and patience to show me new techniques, answer ‘quick’ questions, and help troubleshoot the inevitable issues along the way. There are too many to mention individually, but I would especially like to thank Duncan for the smooth running of the micro-lab, Nadine for teaching me many new techniques, Claire for putting up with the muddy-ing of her lab and for her help sampling, and Betty for her endless patience discussing my stats work. Also, a big thank you to Matteo and Joe for their assistance with the fieldwork through snow and sun, wearing leaky waders and pushing the car out when it was stuck in mud, it was always a pleasure regardless of the weather!
Thank you to all the members of the Sediment Ecology Research group at St Andrews University for their invaluable expertise in field-work and sediment analysis. Special thanks to Irv and Jack for the early starts and the hard work they put in for the long days trudging from site to site pulling the sledges full of kit and samples. Without them, sampling days would have been far less efficient and enjoyable.
iii light- hearted relief. I wish you the best of luck for your own projects. Also, thank you Sheila for the daily ‘networking’, and Nia for the chocolate.
A massive thank you to my family for supporting me throughout the whole process, from proof-reading CVs before I started, to listening to me complain about why things weren’t working when I came home. I will be coming back a lot more often now! Of course, the biggest thank you of all is to Katie- for putting up with the ups and the downs, the late nights and weekends of working and helping me sample in the wind and rain. I would not have been able to do this without your support. However, please don’t let a 3-legged dog run off with a sample again.
iv
Contents
Acknowledgments ... ii
Contents ...iv
Abstract ... x
1. General introduction ... 1
1.1 Protecting public health ... 1
1.2 Human pathogens in the environment ... 2
1.3 Sedimentation of suspended cells ... 3
1.4 Cell-particle adhesion ... 5
1.4.1 Factors affecting cell adhesion ... 5
1.4.2 First phase of adhesion: the physical forces of attraction ... 5
1.4.3 Second phase of adhesion: irreversible attachment... 7
1.5 Extracellular appendages: facilitating bacterial adhesion to surfaces ... 7
1.6 Occurrence of fecal bacteria in intertidal sediments ... 9
1.7 Survival of fecal bacteria in intertidal sediments ... 9
1.8 Abiotic factors affecting bacterial survival in intertidal sediments ... 10
1.8.1 Particle properties ... 10
1.8.2 Salinity and pH ... 11
1.8.3 Temperature ... 12
1.8.4 Rainfall and hydrodynamics ... 12
1.9 Biotic factors affecting bacterial survival in sediments ... 13
1.9.1 Macrobiota ... 13
1.9.2 Indigenous microbiota ... 13
1.9.3 Extracellular polymeric substances (EPS) ... 14
1.10 Microbial biofilms ... 15
1.10.1 Microbial biofilm formation ... 15
1.10.2 Diatom biofilms ... 16
1.10.3 Bacterial biofilms ... 16
1.11 Sediment transport: the erosion, transport, deposition and consolidation (ETDC) cycle ... 17
1.12 Study sites ... 20
1.12.1 Ythan estuary ... 20
v
1.13 Thesis aims ... 27
2. Materials and methods ... 30
2.1 Intertidal sediment collection ... 30
2.2 Laser particle size analysis ... 31
2.3 Organic and water content ... 31
2.4 Total carbon, total nitrogen and organic carbon analysis ... 32
2.5 Extracellular polymeric substance (EPS) analysis ... 32
2.5.1 Colloidal EPS extraction ... 34
2.5.2 Standard curve construction ... 34
2.5.3 Colloidal carbohydrate analysis... 35
2.5.4 Colloidal protein analysis ... 35
2.6 Erosion resistance of sediments... 36
2.6.1 Sediment stability: cohesive strength meter ... 36
2.6.2 Sediment shear strength: shear vane ... 37
2.7 Interstitial water pH and salinity ... 37
2.8 Culture-based enumeration of FIOs from intertidal sediments ... 38
2.9 Retrieval of environmental data ... 39
2.10 Field sampling designs ... 39
2.10.1 Intensively sampled sediments in the Ythan estuary... 39
2.10.2 Seasonal transect sampling in the Ythan and Eden estuaries ... 40
3. The effect of environmental and sediment characteristics on the spatial and temporal distribution of E. coli in intertidal sediments ... 42
3.1 Introduction... 42
3.1.1 Current water monitoring ... 42
3.1.2 E. coli abundance in intertidal sediments ... 42
3.1.3 Models predicting E. coli abundance ... 44
3.1.4 Aims and hypotheses ... 46
3. 2 Materials and methods ... 47
3.2.1 Sediment collection and analysis ... 47
3.2.2 Statistical analyses ... 47
3.3 Results ... 50
3.3.1 Seasonal and spatial trends of environmental and sediment characteristics ... 50
vi
3.3.1.2 Biogeochemical sediment characteristics ... 51
3.3.1.3 Environmental variables ... 53
3.3.2 Spatial and temporal variability of FIOs ... 53
3.3.3 Co-variance of FIOs with sediment characteristics and environmental variables ... 56
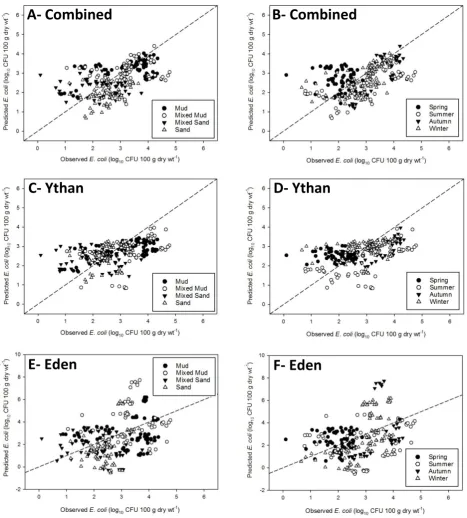
3.3.4 Development of models to explain E. coli abundance ... 57
3.3.5 Efficiency of models across the different datasets ... 65
3.4 Discussion ... 71
3.4.1 The influence of sediment characteristics and environmental variables on the spatial and temporal distribution of E. coli ... 71
3.4.1.1 Physical sediment characteristics... 71
3.4.1.2 Biogeochemical sediment characteristics ... 73
3.4.1.3 Environmental sediment characteristics ... 74
3.4.2 Analysis of best subsets and multiple stepwise linear regression models explaining the spatial and temporal distribution of E. coli at four intensively sampled sites in the Ythan estuary ... 75
3.4.2.1 Intensively sampled sediments in the Ythan estuary... 75
3.4.2.2 Site and season-specific effects ... 77
3.4.2.3 Estuary transect models ... 79
3.4.3 Efficiency of constructed models predicting E. coli abundance in other estuaries ... 81
3.4.4 Conclusions... 83
4. Assessing the resuspension risk of FIOs from intertidal sediments ... 85
4.1 Introduction... 85
4.1.1 Resuspension of FIOs from intertidal sediments ... 85
4.1.2 Factors affecting the stability of intertidal sediments ... 85
4.1.3 Current modelling of resuspension of FIOs ... 87
4.1.4 Relationships between FIO populations in sediments and overlying water ... 88
4.1.5 Hypotheses and aims ... 88
4.2 Materials and methods ... 90
4.2.1 Culture-based enumeration of FIOs from water samples ... 90
4.2.2 Statistical analyses ... 90
4.3 Results ... 91
vii
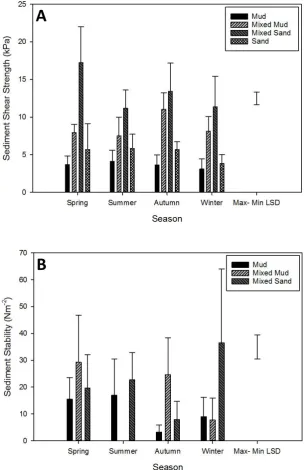
4.3.3 Correlations between E. coli abundance and sediment stability variables ... 95
4.3.3.1 Intensively sampled sediments in the Ythan estuary... 95
4.3.3.2 Ythan and Eden estuary transects ... 96
4.3.4 Correlation of FIO abundance in sediments and the water column ... 99
4.3.4.1 Intensively sampled sediments in the Ythan estuary... 99
4.3.4.2 Ythan and Eden estuary transects ... 101
4.4 Discussion ... 104
4.4.1 Variation of sediment stability with associated sediment characteristics ... 104
4.4.2 Relationships between E. coli abundance and sediment stability variables ... 106
4.4.3 Relationship between FIO abundance in the overlying water and sediment ... 108
4.4.4 Conclusions... 109
5. The effect of changes in the native microbial community on E. coli abundance in intertidal sediments ... 111
5.1 Introduction... 111
5.1.1 Native microbial communities of intertidal sediments ... 111
5.1.2 Variables contributing to changes in native microbial communities ... 113
5.1.3 Interactions between the native microbial community and E. coli ... 115
5.1.4 Aims and hypotheses ... 117
5.2 Materials and methods ... 118
5.2.1 Sediment collection and analysis ... 118
5.2.2 Native microbial community constituent composition... 118
5.2.2.1 DNA extraction and quantification... 118
5.2.2.2 Multiplex TRFLP (M-TRFLP) ... 119
5.2.2.3 PCR product purification ... 121
5.2.2.4 PCR product concentration ... 121
5.2.2.5 Enzyme digest ... 121
5.2.2.6 Fragment size analysis ... 121
5.2.3 M-TRFLP peak identification ... 122
5.2.4 Data manipulation and statistical analysis ... 122
5.3 Results ... 124
5.3.1 TRFLP profiles ... 124
5.3.2 Spatial and temporal variation of microbial population metrics ... 125
viii
5.3.2.2 Intensively sampled sediments in the Ythan estuary... 127
5.3.2.3 Seasonal samples from the Ythan estuary transect ... 129
5.3.2.4 Seasonal samples from the Eden estuary transect ... 133
5.3.3 Relationship between E. coli abundance and microbial population metrics ... 136
5.3.4 Spatial and temporal shift in microbial community constituent composition ... 139
5.3.5 Identification of overlaid TRFs ... 143
5.3.6 Correlations between environmental variables and microbial community constituent composition: RELATE and BEST Analysis ... 144
5.3.7 Modelling the effect of sediment characteristics on microbial community constituent composition: DistLM ... 146
5.3.8 Relationships between E. coli abundance and microbial community constituent composition ... 147
5.4 Discussion ... 153
5.4.1 M-TRFLP method analysis ... 153
5.4.2 Spatial and temporal variation of microbial species metrics ... 155
5.4.3 Spatial and temporal shift in microbial community constituent composition ... 158
5.4.4 Relationships between E. coli abundance and changes in the indigenous microbial community ... 160
5.4.5 Conclusions... 161
6. The role of cell and particle characteristics in the adhesion of E. coli to suspended intertidal sediments ... 162
6.1 Introduction... 162
6.1.1 Cell-particle adhesion ... 162
6.1.2 Derjaguin-Landau-Verwey-Overbeek (DLVO) theory ... 163
6.1.3 Zeta potential ... 164
6.1.4 Zeta potential of E. coli cells ... 166
6.1.5 Aims and hypotheses ... 167
6.2 Materials and methods ... 168
6.2.1 Genotyping of E. coli strains ... 168
6.2.2 DNA extraction ... 169
6.2.3 PCR and sequencing ... 169
6.2.4 Genome sequencing ... 171
6.2.5 BLAST sequence extraction and alignment ... 172
ix
6.2.7 Phenotypic analysis: biofilm assay ... 174
6.2.8 Phenotypic analysis: swarming assay ... 174
6.2.9 Sediment and water properties ... 175
6.2.10 Measurement of zeta potential ... 175
6.2.11 Adhesion of E. coli to suspended intertidal sediments ... 177
6.2.12 Enumeration of E. coli ... 182
6.2.13 Data manipulation and statistical analyses ... 183
6.3 Results ... 186
6.3.1 Genotyping of E. coli strains ... 186
6.3.2 Phenotypic analysis ... 189
6.3.3 Sediment and water properties ... 192
6.3.4 Adhesion of E. coli to suspended intertidal sediments ... 196
6.4 Discussion ... 202
6.4.1 Zeta potential of E. coli strains ... 202
6.4.2 Zeta potential of sediment suspensions ... 203
6.4.3 Adhesion efficiency of E. coli to suspended sediments ... 205
6.4.4 E. coli adhesion efficiency over the salinity gradient ... 209
6.4.5 E. coli adhesion efficiency between sediment types ... 212
6.4.6 Environmental implications ... 214
6.4.7 Conclusions... 216
7. General discussion and future work ... 217
7.1 Summary of main thesis questions ... 217
7.2 E. coli abundance in intertidal sediments ... 219
7.3 The importance of sediment characteristics to water quality ... 221
7.4 Relationship between FIOs and pathogens ... 224
7.5 The native microbial community... 226
7.6 Final conclusions ... 226
References ... 227
Appendices ... 255
Chapters 3 and 4 ... 255
x
Abstract
Microbiological water quality monitoring of bathing waters does not account for faecal bacteria in sediments. Intertidal deposits are a significant reservoir of faecal bacteria and this indicates there is a risk to human health through direct contact with the sediment, or through the resuspension of bacteria to the water column.
This project investigated factors influencing the relative abundance of faecal indicator organisms (FIOs) in intertidal estuarine sediments. The effects of physical, biogeochemical and biological sediment characteristics, environmental variables and native microbial communities were explored through field campaigns on the Ythan and Eden estuaries, Scotland. The contributory role of sediments to adverse water quality was investigated by combining FIO abundance and measurements of sediment stability. The importance of strain and sediment characteristics in the adhesion of E. coli to suspended sediments was also examined using laboratory experiments.
E. coli concentrations up to 5.9 log10 CFU 100 g dry wt-1 were observed, confirming that
intertidal sediments are an important reservoir of faecal bacteria. The variability of E. coli
abundance in estuarine sediments was successfully explained with multiple stepwise linear regression (Adjusted R2 up to 87.4) using easily-obtainable measurements of sediment characteristics and environmental variables, with variability most heavily influenced by salinity and particle size gradients. Native microbial community population metrics and community constituent composition correlated with environmental gradients, but did not influence FIO abundance. The amount of E. coli adhering to suspended sediments ranged from 0.02 to 0.74 log10 CFU ml-1, and was dependant on strain characteristics and sediment type rather than zeta
potential, with higher cell-particle adhesion at 2 and 3.5 PSU than 0 and 5 PSU.
Chapter 1- General introduction
1
1. General introduction
1.1 Protecting public health
Human disease in association with pathogens from wastewater-polluted coastal waters is estimated to cause 120 million cases of gastro-intestinal disease, and 50 million cases of severe respiratory disease worldwide, resulting in an annual cost of three million disability- adjusted life years lost to poor-health and premature death, and approximately 9 billion pounds [1]. In the UK, an estimated 20 million people use the coast each year [2], with an estimated 1.75 million cases of gastrointestinal disease annually in England and Wales from beach and bathing water usage [3]. The most common illness associated with bathing in contaminated water is enteric illness [2], but bacterial skin infections, and eye, ear, nose and throat infections can also be contracted [3]. The risk of contracting gastrointestinal disease was estimated at around 51/1000 bathers, and the risk of other respiratory, ear and eye disease between 20/1000 and 54/1000 bathers in water that met the previous ‘Imperative’ guideline of <2000 faecal coliforms 100 ml-1 [4]. The likelihood of gastrointestinal illness of sea-bathers compared to non-bathing beach goers increases by an alarming 1.76 fold [5]. However, risk is not only associated with bathers, as an increase in enteric illnesses can be a direct result from increased contact with recreational beach sand [6]. The increase of disease in bathers may be because of facilitated infection pathways in water through accidental water ingestion, and also perhaps an increase in exposure to pathogens resuspended from sediments in the swash zone through wave action and human activity.
Chapter 1- General introduction
2
1.2 Human pathogens in the environment
Faecal bacteria enter the environment through point and non-point (diffuse) sources. Point sources are inputs such as improperly-treated sewage and combined sewage overflow systems. Diffuse sources include contamination from recreational beach users, and run-off from septic tanks, landfill sites and agricultural lands. Since the discontinuation of raw sewage outflows, diffuse sources are the predominant contributor to water-way contamination, however high rainfall events can result in raw sewage discharge from combined sewage overflow systems. Faecal contamination is transported down the catchment by surface run-off and groundwater into streams, rivers, and eventually reaches estuaries and the sea. Throughout the transportation process, bacterial cells can be repeatedly sedimented and resuspended to and from bottom sediments, increasing contaminant residence times within waterways compared to water-borne contaminants. The amount of rainfall (in defined periods) and subsequent river flow data is viewed as one of the most important factors causing adverse water quality. Historical correlations between these factors and faecal indicator organism (FIO) abundance are currently used by SEPA in the issuing of real-time bathing water quality advisories [8].
Faecal contamination also derives from domestic animals and wildlife. Animals act as reservoirs for several human pathogens, such as pathogenic serotypes of E. coli and Salmonella
[9], and contamination from bird and dog faeces can contain up to 3.3 x 10⁵ and 3.9 x 10⁷ CFU
g-1 dry weight faeces of enterococci sp. respectively [10]. The presence of FIOs such as enterococcisp. and E. coli, are ubiquitous in the faeces of warm blooded animals, and their presence indicates the extent of recent faecal contamination, and the likelihood of the presence of pathogenic faecal bacteria.
Chapter 1- General introduction
3 shown E. coli and Salmonella sp to survive in non-sterilised/ filtered estuarine water in situ for at least 15 days [17] and the addition of small concentrations of organic matter can support E. coli in seawater for almost 18 weeks [18].
1.3 Sedimentation of suspended cells
Sediments act as a reservoir for bacteria, including human pathogens, with freshwater and marine sediments containing up to 4 times the number of coliforms than the over-lying water [19-22]. Bacteria accumulate in sediments after descending in the water column, particularly when adhered to particles as they flocculate and sink. Bacteria adhere to particles as a medium for protection and survival; numbers of human pathogens are enriched several-fold when associated with suspended flocculated particulates compared to the surrounding water [23].
Two mechanisms occur that associate bacteria and sediment particles; the adhesion of bacteria to sediment particles larger than themselves, and the electrostatic attraction of smaller clay particles to the cell surface [24]. This forms an envelope of smaller colloidal clay particles that has been observed around rhizobia cells [25] and E. coli where this layer increased cell resistance to bacteriophage attack in saline sediment [24].
The speed of the deposition of suspended sediments and associated bacteria is determined by the settling velocity. The settling velocity of particles is chiefly determined by the size of the particle [26], and is calculated using Stokes’ law. Generally, particles larger than 15 µm will take less than one tidal cycle to settle, but particles smaller than 15 µm, such as clay particles, will take longer than one tidal cycle and are also affected by electrostatic forces [27].
Chapter 1- General introduction
4 After association with a particle in the water column, bacteria are incorporated into sediments with the sedimentation of the particle [28]. Muirhead et al. (2006) observed that, in a static system, a mean of 81 % of cells of an environmentally isolated E. coli strainattached to soil particles within 30 minutes of inoculation [29]. This short timescale suggests that when freely suspended cells are present in the water column through large-scale disturbance or input to the estuary, within a short time period they can adhere to particles and are susceptible to deposition.
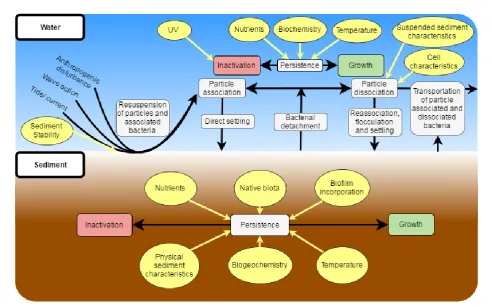
There are various processes that can influence the persistence of bacteria in estuarine systems, many of which depend on whether the bacteria is part of the benthic sediment or in suspension, and in association or not with suspended particles (Fig. 1.1). The mechanisms of these processes are discussed in detail in this chapter.
Figure 1.1 Conceptual diagram of processes that are known or suspected to influence the
[image:15.595.56.549.340.647.2]Chapter 1- General introduction
5
1.4 Cell-particle adhesion
1.4.1 Factors affecting cell adhesion
There are two widely accepted theories of active survival mechanisms used by bacteria. One is to adhere to a surface and produce a biofilm [30], the other is to adopt a dormant state [31] known as a viable but non-culturable (VBNC) state. A cell that is metabolically active, but incapable of the mitosis required to grow upon the media typically used for the detection and enumeration of that bacteria [32] is classified as VBNC.
The attachment of bacteria to surfaces is complex, and dependant on many factors including the properties of the surface, the cell, and the environment around them [33]. Cells are initially weakly (reversibly) associated with particles before they become strongly (irreversibly) associated [34]. The growth phase of the cell effects its adhesion, with log-phase bacterial cells having increased hydrophobicity [35], and adhesion rates [36] compared to stationary phase cells. Before the initial adhesion of a bacterial cell to a surface, there are changes in gene expression [37, 38], suggesting cells may sense a surface, and initiate a gene signal cascade [39]. Many changes in bacterial adhesion occur in response to environmental stresses [40] such as starvation, where extracellular polymeric substance production [41] and the formation of extracellular appendages [30] increase, and cell hydrophobicity changes to favour adhesion to surfaces [31].
1.4.2 First phase of adhesion: the physical forces of attraction
Chapter 1- General introduction
6 DLVO theory shows that adsorption is affected greatly by the electrostatic potentials of the surface or cell, therefore the difference between the surface charge and surrounding medium, known as the zeta potential, is an important measure. The surface charge of particles in suspension in estuaries [48] and indeed most natural surfaces, including that of bacteria [49], is negative, so cells with a less negative zeta potential or surface charge would have a smaller repulsive force to overcome when adhering to a surface. The zeta potential of E. coli,
Salmonella and Pseudomonas sp. have been shown to vary with nutrient availability, starvation
[50] and growth phase [40]. High electrolyte solutions have also been shown to supress the double layer of counterions [51], allowing the Van der Waals forces to act strongly, facilitating attachment. Conditioning films cover almost every surface in aquatic environments [52]. They are formed mostly from proteinaceous substances that are found ubiquitously in natural waters, especially that of high production environments such as estuaries. It is suggested that they could neutralise any physico-chemical features of the surface, including surface charge [52]. This would mask the negative charge of a surface, allowing greater adhesion than realised in abiotic laboratory experiments. The compression of the double layer of counterions also affects bacterial desorption; E. coli remains adhered to sediment particles at high salinities, but with decreasing salinity comes a critical concentration where the cells become detached from the sediment particles [24].
Laboratory experiments show substratum surface charge greatly affects E. coli adhesion [53], with 23 times greater cell density and enhanced biofilm structure by a factor of 37.5 on positively charged polyethene sheets compared to negatively charged polyethene sheets [53]. After high shear exposure, 40 % of biomass was retained on the positively charged sheet compared to 0 % on the negatively charged sheet. Some surfaces may also have a bactericidal effect, however dead or damaged cells can provide a structure for live cells to form a stable biofilm [53].
Chapter 1- General introduction
7
1.4.3 Second phase of adhesion: irreversible attachment
During the first phase, only inter-particle attraction forces are holding the cell to a surface; therefore cells are easily dispersed by shear forces. To create an irreversible attachment, cells will attach through extracellular appendages [54], or the exudation of extracellular polymeric substances [55], leading to biofilm formation. Biofilm synthesis initialises as bacteria sense the range of physical or chemical cues associated with surface contact such as an increase in available nutrients [37].
1.5 Extracellular appendages: facilitating bacterial adhesion to surfaces
Many types of extracellular appendages have been reported to be advantageous to bacteria during the initial adhesion or biofilm formation process. Fimbrae and pili are similar structures, the difference in nomenclature arising from their frequency; only one or two pili are found on a cell, whereas fimbriae are more numerous. Type 1 pili are composed of several proteins, one of which is FimH adhesin, and is associated with cell adhesion whereas type IV pili are usually associated with cell motility. Type 1 pili are essential for initial adhesion of E. coli to abiotic surfaces, while type IV pili are involved with movement along the surface [56], augmenting biofilm formation. Flagella are whip-like appendages used primarily for movement and there is contrasting evidence on whether they are essential to biofilm formation by E. coli [56-58], as they are for P. aeruginosa [59]. Curli fimbriae are extracellular proteinaceous amyloid fibres exuded by enteric pathogens to adhere to surfaces and other cells in order to facilitate biofilm formation [60]. However, the genes for curli fimbriae production are not expressed under medium to high osmotic pressure, temperatures below 30°C and during stationary growth phase [61].
Flagella are suggested to aid biofilm formation in several ways [56]. They could be used for initial anchorage to the surface before initiation of biofilm synthesis. It is suggested that the motility from flagella is required to overcome surface repulsion before initial contact with the surface, and also motility is required after surface contact to spread over the surface and develop a biofilm [56].
Chapter 1- General introduction
8 are monotrichous (have one flagella at a polar end of the cell) and move in a ‘straight movement, then stop, then turn’ routine [63]. Single type-IV pili are used by P. aeruginosa to ‘slingshot’ itself before pulling itself in a crawling movement with many pili [64]. The slingshot movement is 20 times faster than the crawling, and is an efficient mode of motility through a viscous medium, such as a biofilm. E. coli mutants lacking type-IV pili show impaired biofilm formation compared to wild types [65].
Pseudomonas fluorescens mutants lacking flagella took longer to adhere to glass surfaces in
high and low fluid shear than those with flagella due to lack of mobile attachment [66].
Acinetobacter calcoaceticus mutants not expressing genes for thin fimbriae also demonstrated
how the presence of fimbriae were a crucial bacterial adhesion to polystyrene and hydrocarbon surfaces, and that fimbriae were important in the agglutination of cells [67]. Despite some contrasting views, the consensus is that the presence of several and different types of extracellular appendages and exudates are advantageous to surface adherence and consequential biofilm production (Table 1.1). Pratt [56] identified the connection between this and the evidence that large numbers of pili and presence of flagella have been associated with increased pathogenicity in enterobacteria [68, 69]. Thus, pathogens most likely to persist within the environment are also ones most likely to induce illness.
Table 1.1 Selected fecal bacteria and pathogens and their cellular appendages that are known
to increase adhesion rates.
Appendage Species Reference
Pili Gram - & + Bacteria [65, 70]
F1C fimbriae Escherichia coli [71]
Curli Escherichia coli [57]
Type I pili Escherichia coli [56]
Thin aggregative fimbriae (Curli) Salmonella enteritidis [72]
Type I pili Klebsiella pneumoniae [73]
Flagella Pseudomonas sp. [58]
Type IV pili Pseudomonas aeruginosa [59]
Type IV pili Vibrio sp. [74]
Chapter 1- General introduction
9
1.6 Occurrence of fecal bacteria in intertidal sediments
Reported abundances of faecal bacteria in intertidal sediments varies considerably between sediment types, which results in difficulties comparing studies when sediment characteristics have not been comprehensively analysed, in addition to difficulties arising from sampling of different sediment depths. Nevertheless, total coliforms have been recorded in intertidal [77] and subtidal [78] estuarine sediments with up to 2.4 x 10⁶ Most Probable Number (MPN) 100 ml-1, and 1.3 x 10⁵ CFU 100 g-1 found, respectively, and faecal coliforms up to 1.6 x 10⁵ MPN 100 ml-1 [77] and 8.0 x 10⁴ MPN 100 g-1 dry wt [79] for intertidal and subtidal estuarine sediments found, respectively. E. coli has been recorded in benthic estuarine sediments at a mean of 5.9 x 10³ CFU 100 g-1 in the Conwy estuary (UK) [78] and up to ~8.0 x 10⁴ CFU 100 g-1 in the Neuse River estuary (NC, USA) [80].
1.7 Survival of fecal bacteria in intertidal sediments
There is a necessity for further assessing the ecology and survival of FIOs and pathogens in sediments and sediment-associated transport in order to fully characterise potential risks to water quality and public health [28, 81]. Pathogen persistence has been generalised by many authors as being a first order inactivation constant [82], however the exact value of the constant varies considerably between species, and the ambient temperature and nutrient availability [82].
Chapter 1- General introduction
10 Fecal bacteria have demonstrated the ability to reproduce in environmental conditions [77], therefore the question arises, is a pathogen population in the environment replicating, or are the same cells persisting? Genetic fingerprinting found that in Lake Michigan sediments relatively few isolates were replicates, indicating that E. coli were more likely to persist in that environment than replicate [91]. The native environment for faecal coliforms is the gastrointestinal tract of warm blooded animals. During environmental phases of transmission prior to colonising new hosts, cells are likely to experience unfavourable conditions for a considerable time [92]. Although these conditions are not optimal for the growth of faecal bacteria, they will not necessarily kill the cell, allowing for environmental persistence and cross infection. As discussed by Rozen and Belkin (2001), environmental conditions that support growth may not be the optimum conditions for persistence [93].
1.8 Abiotic factors affecting bacterial survival in intertidal sediments 1.8.1 Particle properties
The particle size of sediments has a significant effect on the survival of inoculated faecal coliforms, with the persistence being greater at smaller particle sizes [85, 89], and with lower temperatures [94]. It is suggested that this is because smaller particle size often comes with increased organic matter and nutrient concentrations [88]. Sediments have been shown to contain nutrient concentrations at least 4-6 times that in the overlying water [95]. At the solid-liquid interface there is likely to be a higher concentration of nutrients than the surrounding water, due to the adherence of nutrients to the surface, or other organisms degrading the surface, making resources available [96]. Bacteria associated with particles are also more metabolically active than their planktonic equivalents [97, 98].
In beach sands with differing particles sizes, inoculated E. coli O157:H7 was exposed to simulated tidal flushing, and sand with the smallest particle size yielded the largest recovery of cells after 5 days [99]. E. coli also preferentially adheres to soil particles of a diameter between 30 µm and 16 µm by almost 4 fold than any other size fraction in clay-loam soil (when adjusted for particle surface area) [100], with up to 99.2 % of E. coli reported to adhere to particles larger than 1 µm [101]. Mud-sediment has been demonstrated to support higher numbers of
Chapter 1- General introduction
11 102]. It has been suggested that sediments with higher clay fractions support higher faecal coliform numbers because of the difference in particle charge and surface area [103].
The size and distribution of particles in a sediment effects cohesion, porosity, permeability, and chemical potential [104]. It has been shown that higher numbers of heterotrophic bacteria exist in sediments with high mud (silt and clay fractions) content, with 3.8 x 10⁵ CFU g-1 of dry weight of sandy sediment compared to 6.0 x 10⁵ CFU g-1 in mud [105]. Total bacterial production also positively correlates with organic matter inputs [106] that are usually associated with these finer sediments.
The mineralogy of the clay fraction (<63 µm diameter) also affects the cation exchange capacity and water retention of the sediment [107]. Clay mineralogy can affect bacterial metabolism, with the presence of montmorillonite increasing respiration rates in several species of bacteria [108]. The presence of clay in contaminated sediments may also prevent predation by protozoans by increasing ‘protective microhabitats’ for bacteria [109].
Coliform-containing secondary effluent passed through an 8 µm filter membrane (non-particle associated) was more sensitive to disinfection by UV compared to effluent not passed through (particle associated) the membrane [110], as was the case when ultrasonication was used to disperse bacteria from the UV protecting properties of particles in wastewater [111]. UV damage from sunlight to coliform cells is greater when associated with smaller particle sizes due to decreased shadowing compared to a larger particle [112]. This effect is greater when cells and particles are in suspension [113], as consolidated sediments give the necessary protection to cells from UV, therefore the damaging effect of UV on pathogens in sediments is likely to be less influential than other factors [99].
1.8.2 Salinity and pH
Chapter 1- General introduction
12 bacteria with the ability to survive in an estuarine environment are a proportion of the total load entering the estuary. The pH of seawater ranges from 7.5 to 8.5 [114] and is dependent on temperature, and microbial activity [117]. Higher survival rates of E. coli have been observed at lower pH (5 and 6) than 7 and above [114].
1.8.3 Temperature
Increased persistence of FIOs in sediment correlates with lower temperatures in estuarine water [17, 118] and sediments [77], with survival inversely related to temperatures between 1 °C and 28.2 °C [17, 119, 120]. This seems counterintuitive as it is well known that optimum growth conditions for enteric pathogens is the internal temperature of their preferred host, such as ~40.5 °C for E. coli strains [121]. Higher levels of coliforms were found in canal sediments during winter than in summer, attributed to an increase in die-off rates during summer [21], however, frequent flushing of sediments in winter caused higher coliform counts in summer than winter [122]. There was no seasonal variation detected in thermophilic
Campylobacter in a study on English bathing waters despite higher abundance in the overlying
water during the winter months [123], whereas a study on the same estuary revealed very strong seasonality of Campylobacter with higher abundance during the winter months, and negligible detection during summer [124].
1.8.4 Rainfall and hydrodynamics
Chapter 1- General introduction
13
1.9 Biotic factors affecting bacterial survival in sediments 1.9.1 Macrobiota
Faecal coliforms can persist in the environment for at least 18 weeks [18], which is ample time for bacteria to be ingested by filter-feeding organisms. This can lead to marine mussels bioaccumulating E. coli, V. cholera and E. durans to concentrations of up to two orders of magnitude higher than the overlying water [132]. This suggests filter feeders could be a significant reservoir for pathogens within the estuarine environment [133], prolonging system contamination, and presenting a major risk to human health.
In freshwater sediments, macro-invertebrates serve as transport vectors of bacteria to [134], from [135] and through [136] sediments. Detritivores such as larval chironomids in freshwater acquire faecal coliforms and carry them through their instar stages to emergence as adults and could transfer the pathogens to uncontaminated areas [15]. This can be due to the unintended ingestion of bacteria by grazers or predators with their intended quarry [137] and their passage through the digestive system intact [138]. Invertebrate exoskeletons can also be colonised by a rich and diverse microbiota [139], which may be shed through abrasion with surfaces, or when the exoskeleton is shed [136].
Macroalgae such as Cladophora [140, 141] and samples of mixed species [142] have been identified as an environmental reservoir for E. coli and enterococci, and can support their growth [141]. This is of great importance as extensive beds of Ulva spp. occur seasonally in many estuaries, and after storm events where many pathogens may be resuspended, macroalgae often collect on beaches, creating a potential health hazard.
1.9.2 Indigenous microbiota
Chapter 1- General introduction
14 addition of cycloheximide) allowed enhanced faecal coliform persistence and possibly allowed for growth [28].
1.9.3 Extracellular polymeric substances (EPS)
EPS are biosynthetic polymers exuded by bacteria, micro-flora and fauna that can aid in formation of microbial aggregates [146] when associated with surfaces or particles [147], and also increase erosion thresholds of sediments [148, 149]. EPS occur in many aquatic environments when bacteria are associated with detritus [150], sands [151], and fine sediments [152]. EPS production in bacteria can be a direct response to environmental stresses such as temperature [153] and light [154]. The primary function of EPS production is to maintain a constant environment for the cell and to protect it from environmental stresses rather than being an extracellular energy store [155]. However, EPS may be important in many ecosystems as it could have a key role in carbon cycling, acting as a carbon source for other microbiota and invertebrates [147, 156, 157]. The EPS produced by bacteria is usually higher in proteins than carbohydrates, whereas microalgae secrete mostly carbohydrates [158-161]. The carbohydrate composition of EPS and amount produced differs between diatom species, cell growth phase and nutrient availability [161], and the relative composition of these may influence the cohesive properties of EPS [162]. EPS is lost from sediments by erosion during the tidal cycle, and dissolution by its metabolism by heterotrophic bacteria [163]; bacteria dissolve EPS using hydrolases, but only assimilate a small fraction of the products [164]. Sediments containing high EPS concentrations may provide protection from environmental stresses to faecal bacteria, as well as possibly providing a nutrient source.
Chapter 1- General introduction
15 The physical state of EPS has been described as a continuum ranging from colloidal material to a gel-like state where molecules may form ‘covalently crosslinked networks’ [148] that can incorporate sediment particles as part of the biofilm. These networks of thread-like EPS have been suggested to contribute to the erosion resistance of intertidal sediments [149]. Addition of Xanthan gum (a substance emulative of diatom EPS) increases stabilisation of cohesive sediments through a strengthening and gluing action similar to that of EPS strands on particles [166].
1.10 Microbial biofilms
1.10.1 Microbial biofilm formation
Biofilms are a complex matrix of abiotic substances such as sediment grains, organic matter, and organisms such as diatoms, other algae, phototrophic and heterotrophic bacteria, fungi and protozoa [167] and of course, EPS [168]. Within biofilms, many interactions occur between the different groups of organisms [169]. Faecal coliforms are present in higher numbers in lotic biofilms than overlying water by 1-3 log units [170] as, similarly to particle-association, association with biofilms has many benefits to a bacterium including access to higher nutrient concentrations, protection from passive grazers and predators, and a medium for promoting quorum sensing [43]. Biofilms originating from microphytobenthos are found in the majority of photic-aquatic habitats [163, 171, 172]. In natural cohesive sediments, biofilms with epipelic diatoms as the dominant microbiota are common [168, 171, 173], especially with decreasing salinity [171].
Chapter 1- General introduction
16
1.10.2 Diatom biofilms
The relative abundance of bacterial species within diatom-associated populations is a direct consequence of the diatom species present and their physiological state, due to changing selection pressures to highly-adapted bacteria [174]. Diatom exudates form a phycosphere around the cell [175] that is colonised by marine bacteria because of increased nutrient levels [175] with the polysaccharide and glycoprotein-rich diatom EPS providing a significant carbon source for bacteria [176]. The specific community assemblage for a diatom biofilm is determined through a selection process between facultative bacteria [175] best adapted to the specific species of organic carbon exuded by the diatom [177]. A non-indigenous pathogen occurring in the foreign environment of a marine epipelic ecosystem will therefore experience great competition for resources in diatom dominated biofilms.
Extracellular secretions from bacterial cells have significant effects on the amount and contents of EPS produced by epilithic freshwater diatoms [178]. The effect is species dependant, with an increase of diatom EPS of up to 10 x with the presence of Pseudostaurosira
sp compared to axenic cultures. The changing constituent concentrations affects EPS properties [179], in turn affecting biostabilisation. There are many different interactions between diatoms and bacteria [178, 180] that will affect the formation, composition and biochemical characteristics of diatom-associated aggregated material, and may depend on bacterial community composition [174], and varying temperature and light conditions [180].
1.10.3 Bacterial biofilms
Chapter 1- General introduction
17
1.11 Sediment transport: the erosion, transport, deposition and consolidation (ETDC) cycle
Natural Cohesive Sediments (NCS) are a definitive feature of most estuaries [27]. NCS show cohesive properties due to electrostatic interparticle forces between particles of the mud fraction of the sediment, resulting in higher resistance to erosion than sediments with a larger particle distribution. Generally, sediments with >10 % fine particle (<63 µm) proportion will start to display cohesive properties [182]. Sediments are rarely formed from uniformly sized particles in a homogenous bed, and with an increasing mud fraction, the erosive properties of sand will differ. When the sediment consists of particle sizes >63 µm, the erosion threshold increases with particle size, but below 63 µm, erosion thresholds are inversely correlated with particles size (Fig. 1.2) due to increased packing, or consolidation of the sediment allowing for strong cohesive interparticle forces [27]. The relationship between increasing mud fraction and erosion threshold is complex and depends on many variables, presenting difficulties in predicting sediment erosion and transport.
Figure 1.2 Mean water velocities at which erosion and deposition of sediment occurs at
[image:28.595.125.476.385.640.2]Chapter 1- General introduction
18 Cohesive sediments in estuarine systems are exposed to processes of ‘erosion, advection, dispersion, aggregation, settling, deposition, and consolidation’, referred to as the erosion, transport, deposition and consolidation, or ETDC cycle [182] (Fig. 1.2). Water content (highly correlated with bulk density or consolidation) also affects the velocity needed to resuspend the smaller particle diameters. The erosion or entrainment of sediment is determined by the current shear forces, and the resistance of the sediment through cohesion. The lower the water content, the more interparticle forces dominate, creating cohesive sediment displaying erosive properties similar to larger particles.
Chapter 1- General introduction
19 interrelated, such as particle size and organic matter, but all have individual differences independent of other factors that may change the cohesion of the sediment. Historically, physical and geochemical factors were viewed as most important [189, 190] in controlling sediment dynamics, partly due to the difficulty in categorising and quantifying biogenic influences [191], but the influence of biology on sediment stability such as the actions of bacteria [151, 152] diatoms [192, 193], invertebrates [194], and macrofauna [195] has been demonstrated, and the importance of micro-organisms that mediate transport pathways, known as ‘ecosystem engineers’, was recognised [181, 196]. As previously discussed (1.10.3), EPS considerably increases erosion resistance and is one of the major driving forces in intertidal sediment stability.
Table 1.2 Factors effecting sediment erodibility, after Grabowski et al. (2011).
Physical Factors Geochemical Factors Biological Factors
Particle Size Clay Mineralogy Disturbance
Particle Size Distribution Water Chemistry Feeding and Egestion Bulk Density/ Water Content Organic Content Biogenic Structures
Temperature Salinity EPS and Biofilms
Effects of macrobiota on sediment stability can be defined as stabilisation, destabilisation, or bioturbation (a change in sediment structure that can stabilise or destabilise the sediment) [197]. Stabilising influences include: sediment compaction and increased drainage as a cause of burrowing networks; increase in sediment EPS content; induction of skimming flow through extension of feeding tubes into the water column; deposition of sediment through faeces and pseudofaeces of filter-feeders; and flattening the surface of the sediment to reduce near-bed turbulence [197]. Destabilising effects include blistering, where air is trapped beneath a biofilm surface, giving it buoyancy that pulls it from the sediment surface, burrowing of invertebrates to loosen sediment, and the increase of bed roughness through surface disturbance that increases boudnary turbulence, increasing erosion [197]. Macrobiota can cause destabilisation through grazing [197, 198], and through increasing water content and predation of diatoms, and decreasing micro-topography [195]. Decreased populations of oligochaetes, Nereis
Chapter 1- General introduction
20 Sediment cohesion increases with increasing salinity, as does the stabilising effect of EPS due to the high ionic concentrations. Low salinities (<1 PSU) such as freshwater cause clay particles to be dispersed, whereas salinities occurring within estuaries and beyond (>2-3 PSU) cause particle flocculation [199] as the double layer of counterions are compressed allowing the repulsion force to be overcome by the attracting Van der Waals forces [200]. High salinity increases the cohesive effect of EPS through counterion compression [201] as the increase in ionic strength results in higher availability of cations for adsorption [202]. Rainfall also has direct influence upon sediment stability, with simulated rainfall reducing erosion thresholds through surface disruption, and changing biogeochemical properties such as electrolyte distribution, and chlorophyll and carbohydrate contents [203].
1.12 Study sites 1.12.1 Ythan estuary
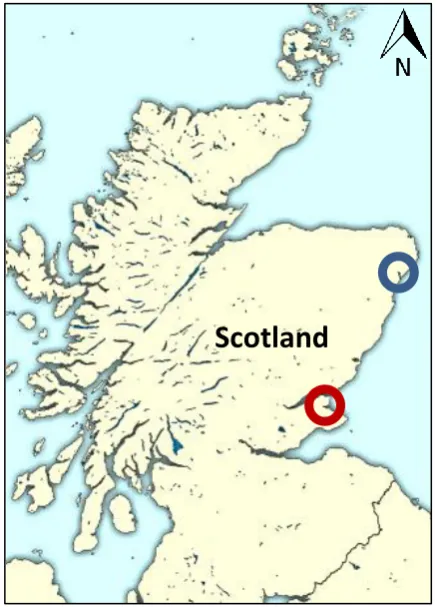
The Ythan estuary is situated approximately halfway between the city of Aberdeen, and the town of Peterhead on the North East coast of Scotland (NK 00304 2621) (Fig. 1.4). The estuary has been described as a shallow, tidally driven, well mixed estuary [204]. The estimates of the flushing time of the estuary vary between 1.15 tidal cycles [204] 6.5 days [205], and 5-12 days [206]. The lower estimate of 1.15 days was justified by the low amount of freshwater entering the estuary compared to the strong tides encountered in the estuary [204].
Chapter 1- General introduction
21 High wind speeds in excess of Gale Force 5 are common, and often from a southerly direction, which forces extra water inside the estuary creating conditions favourable to the resuspension of intertidal sediments and erosion of intertidal flats.
The area of the intertidal sediments has been estimated at 1.85 km2, with the estuary typically being ~300 m wide, with the widest point being at the Sleek of Tarty at 620 m [204].The tidal range in the Ythan estuary has been estimated to be between 8 km [204] and 10 km [207] from the mouth of the river, approximately up to the town of Ellon, but has been shown to vary with seasonal differences of rainfall [204]. To describe the estuary, it was divided into three distinct sections by Leach [204]; the lower ~1.5 km stretch is characterised by high salinities, high currents and intertidal sediments being dominated by sand and mussel beds. The middle ~5.5 km stretch between the Foveran Burn and 500 m upstream of the Forvie Burn is characterised by a variable salinities present and slower currents allowing large mudflats to develop. The Upper stretch of the estuary from 500 m upstream of the Forvie Burn upwards to the tidal reach is characterised by a narrower estuary boundary, with slow currents and low salinities.
The highest freshwater contributor of suspended sediments to the estuary is the Ythan River at 66 % of all freshwater inputs [205]. The highest contributing tributary of suspended sediments from freshwater is the Auchmacoy Burn at 13 %, followed by the Forvie Burn at 10 %, the Foveran Burn at 6 %, and the Tarty Burn at 5 % [205]. Particulate organic matter entering the estuary has been shown to be primarily of marine origin [204].
Sedimentation rates within the estuary have been reported to be over 4 g m-2 hour-1 at sites in the lower estuary, and between 0.15 and 0.7 g m-2 hour-1 at sites between Newburgh Quay and the Logie Buchan Bridge [205]. The higher rate of sedimentation at sites in the lower reaches of the estuary were due to the sediment settling being of a medium sand, compared to the finer sediments that settled in the upper estuary. The intertidal flats on the South bank of the estuary are much more extensive than the North bank. This has been reported to be a result of the hydrology of the estuary directing suspended sediments during the tidal cycle towards the South bank [205].
Chapter 1- General introduction
22 Common Seals reside at the estuary mouth, with smaller sub-colonies inhabiting the lower reaches of the estuary on the North bank. As a result of the biodiversity found in the estuary and its surrounding area, the site is designated as a National Nature Reserve (NNR) of Scotland, a Special Area of Conservation (SAC), a wetland of international importance (RAMSAR site), a Site of Special Scientific Interest (SSSI), and a Special Protection Area (SPA) under the European Union Directive on the Conservation of Wild Birds [209]. The estuary is an important sea trout river, attracting ~200 day ticket anglers a year, and ~40 season ticket holders annually, and the area attracts 15,000-20,000 visitors each year, and is a regular dog walking site [209].
Chapter 1- General introduction
[image:34.595.144.454.85.351.2]23 Figure 1.3 Seasonal macroalgal bloom in the Ythan estuary.
Chapter 1- General introduction
[image:35.595.158.377.144.448.2]24 The Ythan estuary has long been a study site for biodiversity and ecosystem ecology [131, 204, 211, 213, 221, 222] and as a result is ‘one of the best-documented catchments in the UK’ [223].
Figure 1.4 Study sites used in this thesis. Blue circle- Ythan estuary, Red circle- Eden estuary.
1.12.2 Eden estuary
The Eden estuary is situated approximately 120 km South of the Ythan estuary between the town of St Andrews and the City of Dundee (NO 48288 19319) and is located 10 km South of the much larger Tay estuary (NO 47738 29771) (Fig. 1.4). The Eden estuary has been described as a tidally-driven shallow estuary [224, 225]. The catchment is mainly agricultural land [201] and covers approximately 307 km2 [225], with approximately 76 % of the catchment reported to be ‘prime agricultural land’ [226]. Under average flow conditions, the estuary is ‘vertically homogenous’, and partially mixed when under periods of high rainfall [225].
The tidal range of the estuary is approximately 7 km to the West of the mouth of the estuary, although the low tide channel meanders both North and South down the estuary to create a ~9 km long channel. At the widest point, the estuary is 2 km wide just inside the mouth of the
Chapter 1- General introduction
25 estuary. Further upstream there is a well-developed sandy spit forming a narrowing of 500 m in the estuary 3.5 km from the mouth, with the estuary widening again to 1 km. Five km from the mouth, the estuary narrows to a width of 80 m to 20 m at the tidal limit. The intertidal area of the estuary is comprised of approximately 8 km2 of mudflats, and 0.11 km2 of saltmarsh [225].
The mean freshwater input from the river Eden is approximately 2 m3 s-1 [224], with high precipitation in winter increasing the discharge up to 5.5 m3 s-1 [225]. Data collated by Eastwood (1977) [225] showed the contribution of freshwater to the estuary from the river Eden to be highly dependent on rainfall. There is one major tributary entering the Eden estuary. The Motray Water stream enters ~4.75 km from the mouth of the estuary at Guardbridge. The catchment for this tributary is approximately 52 km2 [225]. Motray water had a mean contribution of freshwater to the estuary of 0.38 m3 s-1 between October 1969 and September 1972 [225]. The closest weather station to the Eden estuary is at Leuchars. Between 1981-2010, the average annual rainfall was 691 mm [227].
2011-Chapter 1- General introduction
26 2014 [219]. Sources of possible faecal contamination are similar to that of the Ythan estuary, with the site being important for waterfowl and seals, although the absence of a sandy upper shore throughout the majority of the estuary restricts most visitors and dog-walkers to the outer estuary on West Sands.
Similarly to the Ythan estuary, the Eden estuary has historically been affected by eutrophication, with some research having been performed on its affects regarding seasonal macroalgal growth [228, 229]. The Eden estuary has recently been the focus of extensive research on the effect of macroalgal and microbial assemblages on sediment stability [181, 201, 230], and saltmarsh restoration as a coastal defence mechanism [231].
Figure 1.5 Looking North over the lower and mid-sections of the Eden estuary, with the Coble
Chapter 1- General introduction
27
1.13 Thesis aims
As recognised by Burton et al. [88], difficulties in drawing comparisons between the large number of studies done on pathogen survival within the environment are encountered due to differences in physical, chemical and biological characteristics of the water, soils or sediments examined. This is still the case, with no widely accepted, validated method for bacterial enumeration of fecal bacteria or pathogens in different types of sediments, and many studies not analysing a full suite of sediment properties. Extensive field monitoring with comprehensive sediment and microbe analyses combined with focused laboratory experiments can help identify sediment-microbe associations and facilitate model development and water quality policy adjustments.
The erosion of cohesive sediments is surrounded by multifaceted mathematics [232], and is affected by many factors such as grain size, water content, salinity, pH, and porosity of the sediment [192], with strong correlations between sediment properties and cohesive strength often absent due to the complexity of the system [233]. This is further complicated with notoriously hard to quantify biogenic influences [197]. As Jamieson et al. [51] concluded, sediment-microbe interactions need to be monitored further and new data acquired so affects can be incorporated and developed into existing and new models, making them more useful as water quality monitoring tools.
In the first year-long field study, samples were collected from 4 distinct sediment types in the Ythan estuary every 4 weeks for 12 months. In the second field study, samples from estuary-long transects in the Ythan and Eden estuaries were collected seasonally. Samples from these two sampling campaigns were used to analyse the effect of environmental and sediment characteristics (Chapter 3) and changes in the native microbial community (Chapter 5) on E.
coli abundance. The resuspension of E. coli due to low erosion resistance of sediments
coinciding with high E. coli abundance was investigated in Chapter 4. The final experiment (Chapter 6) investigated the adhesion rates of E. coli to different types of suspended sediments to identify whether the prevalence of high E. coli abundance was partly caused by a preference
of E. coli to adhere to certain types of sediments in suspension in higher abundance for these
sediment types. The effect of E. coli strain characteristics on particle adhesion was also investigated in Chapter 6.
Chapter 1- General introduction
28 distribution in estuarine and coastal waters. This is achieved through year-long field studies of two estuaries, and a factorial laboratory experiment.
Questions addressed in this thesis:
1. Identify key physical, biogeochemical, biological and environmental factors influencing spatial and temporal variation in the abundance of faecal bacteria in intertidal sediments (Chapter 3).
Hypotheses:
a) E. coli abundance in the Ythan estuary can be predicted using sediment
characteristics and environmental variables.
b) Explanatory models of the variation of E. coli with sediment characteristics and environmental variables are generic.
2. Investigate whether intertidal sediments with a high risk of supplying a large number of faecal bacteria can be identified by combining erosion thresholds and E. coli abundance (Chapter 4).
Hypotheses:
a) Sediments that pose a risk to human health through easily-resuspendable faecal bacteria can be spatially and temporally identified by combining E. coli abundance and sediment stability measurements.
b) E. coli abundance in the overlying water will correlate with the abundance of E. coli
Chapter 1- General introduction
29 3. Determine whether or not E. coli abundance in intertidal sediments is affected by the
native microbial community (Chapter 5).
Hypotheses:
a) The salinity gradient drives spatial variation in microbial species metrics (species abundance, diversity and evenness) in estuaries.
b) Microbial community constituent composition is similar in the Ythan and Eden estuaries.
c) E. coli abundance is affected by changes in microbial population metrics.
d) E. coli abundance is affected by microbial community constituent composition.
4. Examine the role of zeta potential in the adhesion of E. coli to suspended intertidal sediments, and investigate how salinity, sediment characteristics and E. coli strain characteristics influence adhesion efficiency (Chapter 6).
Hypotheses:
a) Different E. coli strains will exhibit different zeta potential profiles over the salinity gradient.
b) Sediments will exhibit different zeta potential profiles over a salinity gradient
c) E. coli strains will show different adhesion efficiencies with ionic strength (salinity).
d) E. coli strains will show different efficiencies in adhesion to different sediment types.
Chapter 2- Materials and methods
30
2. Materials and methods
The methods defined here describe the materials, equipment and methodologies used in many of the sampling campaigns for this thesis. Methodologies relevant to specific chapters are described there in further detail.
2.1 Intertidal sediment collection
Sediment was sampled using a coring method similar to that of Lubarksy [234]. Twenty ml BD DiscarditTM Eccentric Luer-Slip Two-Piece plastic disposable syringes (Fisher Scientific, UK) were cut off above the luer-slip tip (Fig. 2.1). 10 mm was measured from the end and marked. Polyethylene Snap Caps (Fisher Scientific, UK) were used to cap the syringe after a core was removed from the sediment surface. Syringe cores taken were 10 mm deep, and had a diameter of 20 mm, resulting in a core volume of 3.14 cm3. Prior to sampling, the syringes and caps were machine washed, rinsed with 70 % ethanol and air-dried to ensure sterility for culture-based bacterial enumeration. Samples used for culture-based bacterial enumeration were stored at 4 °C before enumeration within 24 hours. Samples used for bulk density and subsequent analysis were stored at -20 °C.
Figure 2.1 Twenty ml cut-off syringe corers with caps. Each syringe contains 3.14 cm3 of
sediment sample ready for analysis.
Chapter 2- Materials and methods
31
2.2 Laser particle size analysis
Lyophilised samples were homogenised by hand inside the ziplock bag, and particle size analysis performed by laser diffraction with a Malvern Mastersizer 2000. Silica gel was used as a control with a median particle size of 220 µm. The sample was added to the water bath and sonicated for 30 seconds before the first analysis. Samples were analysed a minimum of twice, and repeatedly run until subsequent runs were satisfactorily alike. Particle size distribution was reported as proportion of fine particles (% fines), mean particle diameter (D (0.5)), and volume weighted mean particle diameter.
2.3 Organic and water content
Syringe cores were ejected into pre-weighed crucibles (Fig. 2.2). The crucibles were then weighed to allow calculation of bulk density (Equation 1). Crucibles were then oven dried at 105 °C for 24 hours and re-weighed to allow calculation of water content (Equation 2). The same crucibles were then ignited in a furnace at 450 °C for 12 hours and re-weighed to allow for calculation of organic content by loss on ignition (Equation 3). Except for the weighing of the initial core, samples were allowed to cool to room temperature in a desiccator before being weighed. Sediment cores were analysed in triplicate for each individual site.
Equation 1 Bulk Density (g / cm3) = SedW / V
Where SedW is the mass (g) of the wet sediment core and V is the core volume (3.14 cm3).
Equation 2 Water Content (%) = ((SedW – SedD) / SedW) * 100
Where SedW is the mass (g) of the wet sediment core and SedD is the mass (g) of the sediment
core post-drying.
Equation 3 Organic Content (%) = ((SedD – SedI) / SedD) * 100
Where SedD is the mass (g) of the sediment core post-drying and SedI is the mass (g) of the