INTRODUCTION
Killer whales Orcinus orcaL. have a cosmopolitan distribution (Ford 2009), and their diet comprises a wide array of prey, including fish, cephalopods, pin-nipeds, cetaceans, birds, and even moose Alces alces L. (Smith et al. 1981, Matkin & Leatherwood 1986, Ford 2009). Killer whales often show site fidelity, returning to geographic locations on a seasonal basis, and can be relatively diet-specialized in these areas (Heimlich-Boran 1988, Similä 1997a, Ford et al. 1998, Saulitis et al. 2000, Bolt et al. 2009, Foote et al. 2010). In the Northeast Atlantic (NEA), herring Clupea harengusL. has long been considered to be the main prey of killer whales throughout their entire annual
season. This assumption is based on studies per-formed along the coast of Norway and Iceland using visual surface photo and behavioral observation methods of whales and acoustics and underwater video recordings to document predator−prey inter -actions (Sigurjónsson et al. 1988, Similä et al. 1996, Simon et al. 2007). In addition to herring, large stocks of several million tons of NEA mackerel Scomber scombrusL. and blue whiting Micromesistius poutas-sou R. occupy these waters (Iversen 2004, Monstad 2004, Prokopchuk & Sentyabov 2006, ICES 2011, Utne et al. 2012), and both of these species are impor-tant components of killer whale diets elsewhere (Bloch & Lockyer 1988, Luque et al. 2006, Ford 2009). In more offshore areas of the NEA, killer whales are
© The authors 2014. Open Access under Creative Commons by Attribution Licence. Use, distribution and reproduction are un -restricted. Authors and original publication must be credited. Publisher: Inter-Research · www.int-res.com
*Corresponding author: leif.nottestad@imr.no
Prey selection of offshore killer whales Orcinus
orca
in the Northeast Atlantic in late summer:
spatial associations with mackerel
Leif Nøttestad
1,*, Lise Doksæter Sivle
1, Bjørn A. Krafft
1, Lise Langård
1, 2,
Valantine Anthonypillai
1, Matteo Bernasconi
1, 3, Herdis Langøy
1, Anders Fernö
1, 21Institute of Marine Research, PO Box 1870 Nordnes, 5817 Bergen, Norway 2Department of Biology, University of Bergen, PO Box 7800, 5020 Bergen, Norway
3Pelagic Ecology Research Group, Scottish Oceans Institute, University of St Andrews, St Andrews, Fife KY16 8LB, UK
ABSTRACT: The traditional perception of prey species preference of killer whales Orcinus orcaL. in the Northeast Atlantic has, to a large extent, been linked to herring Clupea harengusL. Few studies have investigated the feeding ecology of killer whales from the offshore parts of this eco-system. We conducted 2 summer-season ecosystem-based surveys in the Norwegian Sea, when it is most crucial for these animals to build up their energy reserves, using observational, acoustic, oceanographic, plankton net, and pelagic trawl haul data to quantify any spatial overlap between killer whales and the 3 most common and abundant pelagic fish species: herring, mackerel Scomber scombrusL., and blue whiting Micromesistius poutassouR. No spatial relationships were found between killer whales and herring or blue whiting. However, there was a significant rela-tionship and spatial overlap between killer whales and mackerel. Feeding on this epipelagic schooling fish species during summer may incur lower migration costs and higher energetic gain than feeding on alternative prey. Killer whale group size was also correlated to the size of mack-erel trawl catches, indicating active group size adjustment to available prey concentrations.
KEY WORDS: Feeding ecology · Spatial overlap · Northeast Atlantic mackerel · Norwegian spring-spawning herring
O
PEN
PEN
more commonly observed around vessels fishing for mackerel than for herring (Luque et al. 2006). Photo identification studies of killer whales from sites close to the coast of Norway, Iceland, and the British Isles indicate that they forage on herring, but also that mackerel are important and that the whales also prey on seals in certain parts of their range (Foote et al. 2010). Foote et al. (2008) suggested that there are populations of killer whales in the NEA that do not follow the annual herring migration. Morphological and genetic differences have been found among killer whales residing this region, suggesting that several populations may exist as a result of separa-tion through resource specializasepara-tion (Foote et al. 2009, 2010, 2011, 2012).
The aim of the present study was to quantify and test the spatio-temporal overlap of the distribution between killer whales and the major pelagic plankti -vorous fish species by covering the offshore areas of the NEA during summer. No studies to date have focused on the prey preference and ecology of killer whales in these waters during their summer feeding period, a crucial period to build up energy reserves. Previous investigations have had a more narrow scope and focused either on whales or fish. Direct feeding observations or prey studies based on stom-ach analysis of killer whales can be difficult to achieve in representative numbers, but their poten-tial prey preferences can be studied indirectly by investigating the spatial associations and overlap between the predator and various potential prey
organisms with visual sightings, hydro-acoustics, and biological methods (Similä & Ugarte 1993, Nøtte-stad & Axelsen 1999, NøtteNøtte-stad et al. 2002, Foote et al. 2012).
MATERIALS AND METHODS
Continuously recorded acoustic data and marine mammal observations, as well as biological and oceanographic data from sampling stations every 50 to 60 nautical miles (n miles; 92−111 km) were ob -tained along predefined survey lines in the Norwe-gian Sea and surrounding waters (Fig. 1). The sur-veys were conducted from 15 July to 6 August in both 2006 and 2007 with 3 vessels: the MV ‘Libas’ (2006 and 2007), MV ‘Endre Dyrøy’ (2006), and MV ‘Eros’ (2007).
Killer whale observations
[image:2.612.43.541.468.683.2]Killer whale observations were made during a total of 670 h, with few exceptions during daylight hours (~06:00−22:00 h) by 2 trained scientific personnel on each vessel, all with previous experience of whale sighting surveys. Weather conditions were extraordi-narily calm in the Nordic Seas during the 2 study sea-sons; in both seasons, the Beaufort scale showed 0 to 4 (representing calm to moderate sea conditions) for 40 out of 44 d (91% of the survey time). Only 4 d were
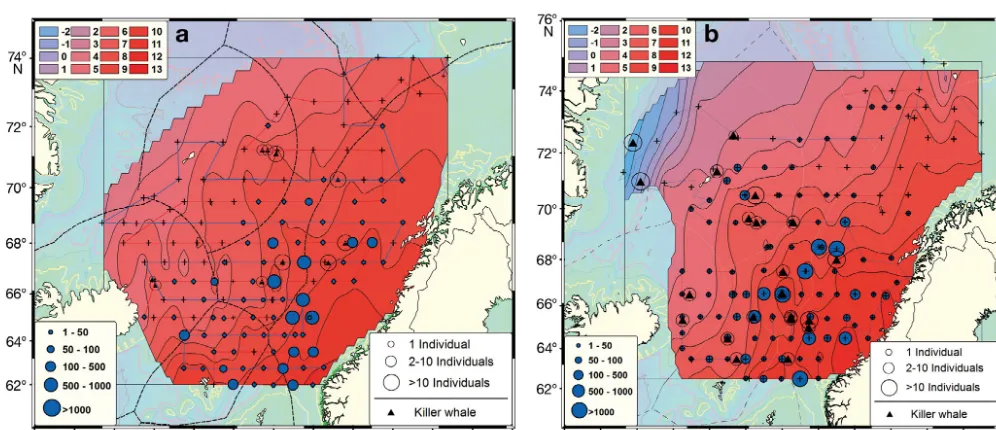
Fig. 1. Orcinus orcaand Scomber scombrus.Norwegian Sea and surrounding waters in July and August (a) 2006 and (b) 2007, including cruise tracks (lines) and logged temperatures (°C) in the background (color scale top left). Killer whale observations (black triangles) showing the number of individuals (open circles) and catch rates (kg nautical mile−1) of Northeast Atlantic
classified as Beaufort 5 to 6 (rough and very rough seas). The dominant wind direction was northeasterly, followed by southwesterly. The visibility measured by radar generally ranged between 1000 and 10 000 m. Fog and fogbanks were experienced only in the west-ernmost area into the Greenland Sea, south of Jan Mayen, and around Bear Island, occasionally restrict-ing visibility to 100−1000 m. Takrestrict-ing visibility range distance due to varying weather conditions into ac-count, the survey covered about 1 × 10⁴km2of the sea
surface in total. Precipitation was low, wave height was mostly <1 m (maximum = 3−4 m), and swells were experienced only along the shelf breaks. Sightings were made from a platform at the wheelhouse rooftop whenever the weather permitted (Beaufort < 4 and no or moderate rain), otherwise from the bridge (Beaufort > 4). Ob servations were made applying the TNASS observation regime (Palka & Hammond 2001, Lawson & Gosselin 2009), including recordings of date, time, position, species, and group size. Most marine mam-mal observations were digitally photographed and/or video-recorded to confirm species identification and group size estimates.
Acoustic sampling
The vessels were equipped with 2 fishery sonars: a Simrad SH 80 (110−122 kHz), which provided the best resolution at close range, and a Simrad SP 90 (20− 30 kHz), with optimal frequencies for longer de -tection ranges (up to 1200 m) of pelagic schooling fish. The multibeam sonars were used mainly for detecting and counting schools of pelagic fish at a distance and in proximity to the surface above the operating transducer depth of the echosounder (cov-ering the acoustic blind zone close to the surface). Detections of whales on the sonar were used to con-firm visual surface observations and to study predator− prey interactions (Nøttestad & Axelsen 1999, Nøtte-stad 2001, Knudsen et al. 2008, Bernasconi et al. 2011, Brehmer et al. 2012).
Continuous data-recordings at 18, 38, 70, 120, and 200 kHz were made with a Simrad EK60 echo sounder from a transducer depth of 8 to 10 m underneath the surface down to 500 m depth, using standard acoustic settings (Korneliussen & Ona 2002) on board the MVs ‘Libas’ and ‘Eros,’ whereas 38 and 200 kHz were used onboard the MV ‘Endre Dyrøy.’ Acoustic data focus-ing on Norwegian sprfocus-ing spawnfocus-ing (NSS) herrfocus-ing from 2006 and 2007 were scrutinized by 2 experi-enced scientists with the software program Large Scale Survey System (Korneliussen et al. 2009), and
Nautical Area Scattering Coefficient (NASC) values enabled confident allocation to herring.
Data from pelagic trawl catches were used to ground-truth the interpretations of the acoustic data on herring. Mackerel have a shallow distribution during the summer feeding period, predominantly swimming in the upper 30 m and also above the echosounder transducer depth, and display weak acoustic properties due to lack of a swimbladder. In addition, scarce information on in situtarget strength (TS) measurements is available for this species (Kor-neliussen & Ona 2002, 2003). Consequently, proper quantitative acoustic data on NEA mackerel were not available in our study, and the density estimates were calculated on the basis of data on catch rates (catch per unit effort) from standardized pelagic trawling from predetermined stations.
Biological sampling
Fish were sampled on all vessels and surveys with a large commercial blue whiting pelagic trawl net (Egersund trawl): mouth width ranging between 45 and 63 m and opening height between 50 and 55 m when applying 200 to 220 m wire length. Towing speed was 4.0 to 5.3 knots (~7.5−10 km h−1), depend-ing on current speed and direction as well as wind and wave conditions. The catch weight (kg) of mack-erel, herring, and blue whiting was recorded for all stations. Catch rates (kg n mile−1) from standardized
pelagic trawling close to the surface were calculated for mackerel from all survey vessels. A random sam-ple of up to 100 individuals from each fish species was taken from the stations. Zooplankton was sampled at each pelagic trawl station using a standardized WP2 plankton net with a diameter of 56 cm and mesh size of 180 µm. A total of 68 and 116 WP2 hauls were car-ried out in July to August 2006 and 2007, respectively.
Oceanography
Statistical analysis
We used 2 different statistical approaches in this study. Pearson’s product-moment correlation test was used to compare concentrations of pelagic fish spe-cies with killer whale observations. These statistical correlations did not strictly meet the assumptions of normality after more detailed exploring of the data sources. A generalized linear model (GLM), using a quasi-Poisson family and log link, was used to model the positive occurrence of killer whales:
Whales = βe+ βhherring + βmmackerel
+ βbblue whiting + ∑ (1)
where β= beta describing the model, and ∑ = the sum and weight of herring (h), mackerel (m), and blue whiting (b) from trawl surveys; e is the error term. This model was used as an index of relative abun-dance. Killer whale data were transformed by the Box-Cox method (Box & Cox 1964) because the data were highly skewed and did not fulfill the assump-tions of heteroscedasticity.
RESULTS
Water surface temperatures in the study area ranged between 15 and 16°C along the coast of Nor-way to cold Arctic water masses in the NW with sur-face temperatures of 2 to 4°C around Jan Mayen and
−0.2 to 2.0°C in the Denmark Strait and Greenland Sea close to the ice edge (Figs. 1 & 2). The surface water in the Norwegian Sea was generally warmer in 2007 than in 2006 (Figs. 1 & 2). The temperature in the central Atlantic water masses ranged from 10 to 14°C. Salinity varied from 28.5 to 35.0 (PSU) within the study area.
From 33 visual sightings, a total of 271 individual killer whales were observed during the 2 years (Figs. 1 & 2, Table 1). Group sizes ranged from 1 to 40 individ-uals (mean ± SD = 8.2 ± 5.8). Altogether, 42.5% of the killer whales were observed in Atlantic waters, 42.5% in Arctic waters, and 15.0% in coastal waters. Obser-vations of killer whales in Arctic waters were often associated with frontal areas between Atlantic and Arctic water, and only 2 observations of killer whales were made in a true Arctic area, along the ice edge in the westernmost part of the study area (Figs. 1 & 2).
NEA mackerel was the dominant species in At -lantic water masses and was caught mostly in the central Norwegian Sea from 63° to 70° N up to the Arctic front (Fig. 1) during both years. NSS herring were caught in the trawl samples at predetermined stations and recorded by continuous acoustics in most regions of the study area, with the largest catches located in Arctic water masses (Fig. 3). Blue whiting were distributed mostly in Arctic waters, especially along the fronts in the northwestern parts of the Norwegian Sea during both years.
The fish species showed no tendency to occur together with a close spatial overlap, as their
[image:4.612.43.541.472.687.2]dances were not statistically correlated (Table 2). The distribution and concentration of NSS herring, based on acoustic data and biological sampling, were not correlated with the killer whale distribution for either of the study years (p = 0.48, df = 254, both years com-bined, Table 2). Using regression analyses with the GLM, no relationship between killer whales and her-ring was found (F22= 0.022, p > 0.05, GLM). The
dis-tributions of blue whiting and killer whales were also not statistically correlated (p = 0.34, df = 254, both years combined), and no relationship was found using regression analyses with the GLM (F22 = 0.084,
p > 0.05, GLM).
On the other hand, the results for distribution and aggregation based on standardized catch rates of NEA mackerel (Fig. 1) showed that the highest con-centrations overlapped with the predominant num-ber of killer whale sightings in both 2006 and 2007,
and this distribution overlap was significantly posi-tively correlated (2006, p < 0.001, df = 125; 2007, p < 0.001, df = 127; Table 2). The same pattern was found when merging the data from 2006 and 2007 (p < 0.01, df = 254). Using regression analyses with the GLM, we also found a significant relationship between killer whales and mackerel (F22 = 11.306, p < 0.002,
GLM). In addition, killer whale group size was also positively correlated with the total catch and catch rate of mackerel at the station closest to the whale sightings (Fig. 4a) when merging the data from 2006 and 2007 (p < 0.001, t= 4.62, df = 22). Such a positive correlation was not found between killer whale group size and herring (Fig. 4b) or blue whiting (Fig. 4c). Killer whale group size was significantly positively correlated with total mackerel catches in 2007 (p < 0.001, t= 4.84, df = 14), but not in 2006 with its lower sample size (p = 0.09, t= 1.98, df = 6). Acoustic obser-Date Time Latitude Longitudea Group size Mackerel Herring Blue whiting Plankton (dd/mm/yyyy) (UTC) (n) (kg) (kg) (kg) (g m−2)
21/07/2006 14:55 66.35° −11.86° 10 0.0 3.5 60.0 8.30 21/07/2006 15:32 66.35° −11.84° 1 0.0 3.5 60.0 8.30 21/07/2006 16:45 66.58° −12.15° 1 2.0 970.0 529.0 5.304 23/07/2006 06:00 67.25° 0.92° 15 4000.0 0.0 0.0 5.96 23/07/2006 18:36 67.24° 5.51° 20 4000.0 0.0 0.0 3.29 01/08/2006 10:49 70.27° 6.48° 12 1.2 250.0 0.0 3.50 26/07/2006 02:40 68.00° 7.23° 11 500.0 1.0 0.0 2.47 01/08/2006 10:40 71.12° 0.27° 12 0.0 10.4 0.0 2.26 01/08/2006 13:00 71.25° −0.58° 6 0.0 10.4 0.0 2.26 01/08/2006 14:00 71.25° −1.12° 4 0.0 10.4 0.0 7.58 23/07/2006 05:20 66.48° −1.17° 5 5.1 0.3 0.0 4.14 16/07/2007 20:15 63.30° 0.40° 4 250.0 0.0 0.0 10.90 17/07/2007 09:55 63.30° −5.00° 5 500.0 1000.0 100.0 6.90 18/07/2007 15:45 65.21° −10.58° 5 90.0 60.0 0.0 7.03 19/07/2007 09:50 65.30° −3.10° 5 250.0 19.7 25.0 10.02 20/07/2007 16:00 65.30° 0.59° 5 7.4 0.3 0.0 3.07 20/07/2007 19:55 65.25° 0.59° 10 7.4 0.3 0.0 3.07 21/07/2007 10:22 65.01° 2.57° 3 2000.0 2.1 0.0 4.37 21/07/2007 10:34 65.20° 2.59° 18 2000.0 2.1 0.0 4.37 26/07/2007 20:39 69.29° 1.14° 4 380.0 5.6 0.0 7.99 27/07/2007 06:35 69.28° −2.48° 2 25.1 28.1 0.0 7.22 27/07/2007 08:10 69.38° −3.40° 7 60.0 50.0 0.0 7.22 29/07/2007 14:30 71.00° −15.35° 12 0.0 0.0 0.0 2.51 29/07/2007 22:52 72.21° −16.25° 20 0.0 0.0 0.0 8.02 31/07/2007 07:45 72.36° 5.22° 1 0.0 0.0 0.0 6.43 17/07/2007 15:24 64.48° −6.00° 2 350.0 37.2 0.0 8.33 18/07/2007 07:09 66.50° −10.19° 3 13.2 24.0 140.0 5.00 21/07/2007 13:23 67.98° 6.02° 40 5000.0 0.0 0.0 4.41 22/07/2007 08:40 67.49° 0.11° 10 6.0 0.3 0.0 2.07 22/07/2007 14:53 66.57° 0.00° 2 1600.0 5.0 0.0 2.26 22/07/2007 15:09 66.52° 0.00° 1 1600.0 5.0 0.0 2.26 28/07/2007 17:14 70.50° −2.95° 12 750.0 2250.0 0.0 5.52 29/07/2007 07:19 71.37° −7.17° 3 0.0 105.0 0.0 5.58
[image:5.612.62.538.111.488.2]aNegative sign represents western latitude
vations of killer whale carousel feeding (see Similä & Ugarte 1993) on NEA mackerel schools swimming close to the surface were also confirmed by visual observations and documented by digital video-record-ing and photographs (n = 6 sightvideo-record-ings).
Zooplankton biomass calculated from 200 to 0 m vertical hauls varied from 0.2 to 21.2 mg m−2 with a mean ± SD of 6.5 ± 3.89 mg m−2in 2006, and from 0.6
to 13.1 mg m−2with a mean of 5.2 ± 2.38 mg m−2in
2007. When testing for relationships between zoo-plankton biomass and the 3 pelagic fish species included in this study, only blue whiting were found to be significantly correlated (Spearman correlation coefficients rho = 0.161, p = 0.02), while no significant correlation was found for NEA mackerel or herring (rho = −0.123, p = 0.08 and rho = −0.037, p = 0.60, respectively). Also, there was no correlation between biomass of plankton and observations of killer whales (GLM: F = 0.10, p = 0.75, df = 162, Spearman correlation coefficients rho = −0.389, p = 0.099, df = 18). Furthermore, no significant correlation was found between small group size (N = 1−5) and large group size (N = 6−40) of killer whales and plankton bio-masses (GLM: F= 2.48, p = 0.13, df = 18).
DISCUSSION
This large-scale study brings new knowledge of the feeding ecology and prey selection of killer whales in offshore areas of the Nordic Seas. Data on distribution and spatial associations collected at the same time over 2 consecutive years strongly indicate
that killer whales are associated with the occurrence of NEA mackerel schools during the summer months of July and August. The results of this study, which indicate a killer whale prey preference for NEA mackerel, are in contrast to the contention that her-ring represent the preferred prey duher-ring all seasons (e.g. Similä et al. 1996). However, these previous studies were limited to more coastal regions repre-senting different water masses; moreover, the densi-ties and diversity of prey species are different in those regions compared to offshore conditions. Some of the more coastal studies were performed during other seasons and assumed that the same pattern applied for summer foraging (Christensen 1982, Sim-ilä & Ugarte 1993, SimSim-ilä et al. 1996, SimSim-ilä 1997b, Nøttestad 2001). Our results strengthen the assump-tion made by Foote et al. (2009, 2010, 2011), based on photo identification and genetic studies, that there is resource specialization in the NEA amongst the resi-dent killer whales at least during the summer season. Extensive numbers of pelagic planktivorous fish enter the Norwegian Sea during spring and summer to feed (Nøttestad et al. 1999, Skjoldal et al. 2004, Prokopchuk & Sentyabov 2006), with an estimated biomass of 17 million tons of At lantic mackerel, NSS herring, and Atlantic blue whiting in July and August (Huse et al. 2012, Utne et al. 2012). The den-sities of NEA mackerel and Atlan tic blue whiting are stable in the area, feeding in July and August (Utne et al. 2012), while NSS herring have already passed their peak feeding period at that time (Langøy et al. 2012). Mackerel are associated to a greater extent with warmer water than herring are (Utne et al. 2012,
2006 2007 Together
Species df p CC df p CC df p CC
Weight
Mackerel−herring 125 0.546 −0.054 127 0.773 −0.026 254 0.491 −0.043
Mackerel−blue whiting 125 0.431 −0.070 127 0.643 −0.041 254 0.362 −0.057
Herring−blue whiting 125 0.577 −0.050 127 0.654 −0.040 254 0.477 −0.045
Killer whale−mackerel 125 0.001 0.304 127 < 0.001 0.430 254 < 0.001 0.352
Killer whale−herring 125 0.530 −0.053 127 0.656 −0.040 254 0.477 −0.045
Killer whale−blue whiting 125 0.596 −0.047 127 0.121 0.137 254 0.340 0.060
Number
Mackerel−herring 125 0.581 −0.049 127 0.648 −0.041 254 0.496 −0.043
Mackerel−blue whiting 125 0.410 −0.074 127 0.772 −0.026 254 0.636 −0.297
Herring−blue whiting 125 0.531 −0.056 127 0.729 −0.031 254 0.652 −0.028
Killer whale−mackerel 125 0.001 0.284 127 0.004 0.253 254 < 0.001 0.266
Killer whale−herring 125 0.560 −0.052 127 0.621 −0.044 254 0.471 −0.045
[image:6.612.61.539.118.305.2]Killer whale−blue whiting 125 0.556 −0.053 127 0.760 −0.027 254 0.662 −0.027
Table 2. Scomber scombrus, Clupea harengus, Micromesistius poutassou, and Orcinus orca. Results from Pearson’s product-moment correlation test comparing weight of trawl catches with number of killer whales for different pelagic fish and killer
this study), with their main summer distribution cov-ering central parts of the Norwegian Sea associated with Atlantic water (Iversen 2002, 2004, Godø et al. 2004), whereas we found herring and blue whiting mostly in Arctic water in the present study.
Generally, all 3 fish species were abundant and available as prey for killer whales during our study period. Based on the observed spatial associations, killer whales showed a clear preference for NEA mackerel over NSS herring and blue whiting within the same ecosystem. This may be caused by one or more interacting factors: NEA mackerel are typically distributed in smaller schools in the upper water column, both day and night (Godø et al. 2004, Prokop -chuk & Sentyabov 2006), whereas NSS herring
[image:7.612.46.542.83.299.2]per-form diurnal vertical migrations to deeper waters (Langøy et al. 2012), and blue whiting have a more pronounced mesopelagic distribution down to 300− 500 m with occasional migrations to shallow waters, and only at night (Monstad 2004, Prokopchuk & Sentyabov 2006). Killer whales are mainly visual pre -dators (White et al. 1971) and seem to depend on day-light when hunting (Similä & Ugarte 1993, Similä 1997b, Nøttestad & Axelsen 1999, Nøttestad et al. 2002). Hunting re sources available at the surface throughout the day will be energetically cost effec-tive for this air-breathing predator that depends on contact with the surface. The surface-related swim-ming and feeding be havior of mackerel is thus likely to be a contributing factor for the killer whale feeding Fig. 3. Orcinus orcaand Clupea harengus. Norwegian Sea and surrounding waters in July and August (a) 2006 and (b) 2007. Killer whale observations (black triangles) from MV ‘Libas’ (blue line) and MV ‘Endre Dyrøy’ (red line) showing the number
of individuals (open circles) and acoustic densities (determined by NASC) of herring as colored squares
[image:7.612.68.523.351.495.2]pattern. Mackerel schools were also available to killer whales at a shorter migration distance from their pre-ferred coastal feeding habitats earlier in the season, resulting in lower swimming and migrating costs. In addition, mackerel have the highest annual nutritional value and fat content of the 3 species (Slotte 1999, Hamre et al. 2003), which should provide killer whales feeding on mackerel with a higher energetic gain than is the case with herring and blue whiting.
It may be argued that mackerel are faster swimmers than herring (Jobling 1994) and blue whiting (Nøtte-stad et al. 1999) and may therefore avoid predator at-tacks more easily, thereby increasing the energy costs of hunting and capture. However, killer whales are known to prey effectively on schooling plankti -vorous fish and circumvent their anti-predator be -haviors (Nøttestad et al. 2002). Groups of killer whales feeding on herring schools use advanced co-ordinated hunting tactics including sound production (Similä 1997a,b, Simon et al. 2007) and synchronized attacks, with carousel feeding probably be ing the most common hunting tactic (Similä & Ugarte 1993, Similä et al. 1996, Nøttestad & Axelsen 1999, Nøtte-stad et al. 2002). Mackerel and herring are pelagic schooling fish of about the same size (Nøttestad et al. 1999, Holst et al. 2002, Iversen 2004). The observed killer whale hunting behaviors when feeding on mackerel were circular and coordinated swimming and diving, coinciding with previously ob served co-ordinated hunting behavior used for attacking schools of herring (Similä & Ugarte 1993, Nøttestad et al. 2002). Given that mackerel are occupied with active feeding most of the time close to the surface (Langøy et al. 2012), they may also be less vigilant than her-ring, as the main feeding period for herring is 1 to 2 mo earlier than that of NEA mackerel. At the time of the study from 15 July to 6 August, the main NSS her-ring feeding season had ended, with herher-ring initiating migration to the overwintering area (Holst et al. 2002), while NEA mackerel were still actively feeding on zooplankton (see Langøy et al. 2012). Mackerel may therefore be more accessible and more easily captured by killer whales than the ‘well-fed,’ more vigilant, and deeper-swimming herring.
Killer whale group size was positively correlated with total mackerel catches. This could be explained partly by an ideal free distribution (Fretwell & Lukas 1969), where a higher number of killer whales in areas with high concentrations of prey resulted in larger groups but could also reflect an active adjust-ment of group size to the biomass and school size of their fish prey. A larger group size may be needed to hunt cost-efficiently in a coordinated manner for
larger concentrations or schools of pelagic fish pos-sessing advanced anti-predator strategies (Pitcher & Parrish 1993, Vabø & Nøttestad 1997, Nøttestad et al. 2002). Such variations in killer whale group size have been observed when killer whales hunt for herring schools of various sizes in winter (Nøttestad & Axelsen 1999, Nøttestad et al. 2002).
Acknowledgements.This project was financed by the Nor-wegian Ministry of Fisheries and Coastal Affairs and the Institute of Marine Research, Bergen, Norway. We thank the skippers and crew onboard the MV ‘Libas,’ MV ‘Eros,’ and MV ‘Endre Dyrøy’ for excellent collaboration and practical assistance during the ecosystem surveys in the Norwegian Sea. We are also grateful to J. Devine and K. Helge Jensen from the University of Bergen, Norway, for statistical assis-tance, and to K. Utne for assistance in scrutinizing the acoustic herring data.
LITERATURE CITED
Bernasconi M, Nøttestad L, Axelsen BE , Krakstad JO (2011) Acoustic observations of dusky dolphins Lagenorhyncus obscurushunting Cape horse mackerel Trachurus capen-sisoff Namibia. Mar Ecol Prog Ser 429:209–218
Blindheim J (2004) Oceanography and climate. In: Skjoldal HE, Misund OA, Sætre R, Fernø A, Røttingen I (eds) The Norwegian Sea ecosystem. Tapir Academic Press, Trond-heim, p 65–95
Bloch D, Lockyer C (1988) Killer whales (Orcinus orca) in Faroese waters. Rit Fiskid 11: 55−64
Bolt HE, Harvey PV, Mandleberg L, Foote AD (2009) Occur-ance of killer whales in Scottish inshore waters: temporal and spatial patterns relative to the distribution of declining harbor seal populations. Aquat Conserv 19: 671–675 Box GEP, Cox DR (1964) An analysis of transformations. J R
Stat Soc Ser B 26: 211−252
Brehmer PE, Josse E, Nøttestad L (2012) Evidence that whales (Balanenoptera borealis) visit drifting fish aggregating devices: Do [sic] their presence affect the processes underlying fish aggregation? Mar Ecol 33: 176−182
Christensen I (1982) Killer whales in Norwegian coastal waters. Rep Int Whaling Comm 32: 633−641
Foote AD, Vikingsson G, Øien N, Bloch D and others (2008) Distribution and abundance of killer whales in the North East Atlantic. Rep SC/59/SM5. International Whaling Commission, Cambridge
Foote AD, Newton J, Piertney SB, Willerslev E, Gilbert MTP (2009) Ecological, morphological and genetic divergence of sympatric North Atlantic killer whale populations. Mol Ecol 18: 5207−5217
Foote AD, Simila T, Vikingsson GA, Stevick PT (2010) Move-ment, site fidelity and connectivity in a top marine preda-tor, the killer whale. Evol Ecol 24: 803−814
Foote AD, Vilstrup JT, de Stephanis R, Verborg P and others (2011) Genetic differentiation among North Atlantic killer whale populations. Mol Ecol 20: 629−641
Foote AD, Vester H, Vikonsson GA, Newton J (2012) Dietary variation within and between populations of northeast Atlantic killer whales Orcinus orcainferred from δ13C and
δ15N analysis. Mar Mamm Sci 28: E472−E485
Ford JKB (2009) Killer whale Orcinus orca. In: Perrin WF,
➤
➤
➤
➤
➤
Würsig B, Thewissen JGM (eds) Encyclopedia of marine mammals. Academic Press, San Diego, CA, p 650−657 Ford JKB, Ellis GM, Barrett-Lennard LG, Morton AB, Palm RS,
Balcomb KC (1998) Dietary specialization in two sympatric populations of killer whales (Orcinus orca)in coastal British Columbia and adjacent waters. Can J Zool 76: 1456−1471 Fretwell SD, Lukas HL (1969) On territorial behavior and
other factors influencing habitat distribution in birds. I. Theoretical development. Acta Biotheor 19: 16−36 Godø OR, Hjellvik V, Iversen SA, Slotte A, Tenningen E,
Torkelsen T (2004) Behaviour of mackerel schools during summer feeding migration in the Norwegian Sea, as ob-served from fishing vessels. ICES J Mar Sci 61: 1093–1099 Hamre K, Lie Ø, Sandnes K (2003) Seasonal development of
nutrient composition, lipid oxidation and colour of fillets from Norwegian spring-spawning herring (Clupea haren-gusL.). Food Chem 82: 441−446
Heimlich-Boran JR (1988) Behavioural ecology of killer whales (Orcinus orca)in the Pacific Northwest. Can J Zool 66: 565−578
Holst JC, Dragesund O, Hamre J, Misund OA, Østvedt OJ (2002) Fifty years of herring migrations in the Norwegian Sea. ICES Mar Sci Symp 215: 352−360
Huse G, Holst JC, Utne KR, Nøttestad L and others (2012) Effects of interactions between fish populations on ecosys-tem dynamics in the Norwegian Sea — results of the INFERNO project. Mar Biol Res 8: 415−419
Iversen SA (2002) Changes in the perception of the migration pattern of Northeast Atlantic mackerel during the last 100 years. ICES Mar Sci Symp 215: 382−390
Iversen SA (2004) Mackerel and horse mackerel. In: Skjoldal HR, Misund OA, Sætre R, Fernø A, Røttingen I (eds) The Norwegian Sea ecosystem. Tapir Academic Press, Trond-heim, p 289−300
Jobling M (1994) Fish bioenergetics. Chapman & Hall, London Knudsen FR, Gammelsæter OB, Kvadsheim PH, Nøttestad L (2008) Evaluation of fisheries sonar for whale detection in relation to seismic survey operations. Bioacoustics 17: 327–328
Korneliussen RJ, Ona E (2002) An operational system for pro-cessing and visualizing multi-frequency acoustic data. ICES J Mar Sci 59: 293−313
Korneliussen RJ, Ona E (2003) Synthetic echograms gener-ated from the relative frequency response. ICES J Mar Sci 60: 636−640
Korneliussen RJ, Heggelund Y, Eliassen IK, Johansen GO (2009) Acoustic species identification of schooling fish. ICES J Mar Sci 66: 1111−1118
Langøy H, Nøttestad L, Fernö A, Broms C, Skaret G (2012) Overlap in distribution and diets of Atlantic mackerel
(Scomber scombrus), Norwegian spring-spawning herring
(Clupea harengus) and blue whiting (Micromesistius poutassou)in the Norwegian Sea during late summer. Mar Biol Res 8: 442−460
Lawson JW, Gosselin JF (2009) Distribution and preliminary abundance estimates for cetaceans seen during Canada’s Marine Megafauna Survey — a component of the 2007 TNASS. Res Doc 2009/031. Canadian Science Advisory Secretariat, Fisheries and Oceans Canada, Ottawa Luque PL, Davis CG, Reid DG, Wang J, Pierce GJ (2006)
Opportunistic sightings of killer whales from Scottish pelagic trawlers fishing for mackerel and herring off North Scotland (UK) between 2000 and 2006. Aquat Liv Resour 19: 403−410
Matkin CO, Leatherwood S (1986) General biology of killer whale, Orcinus orca, a synopsis of knowledge. In: Kirkevold BC, Lockard JS, Alan R (eds) Behavioural
biol-ogy of killer whales. Liss, New York, NY, p 35−68 Monstad T (2004) Blue whiting. In: Skjoldal HR, Misund OA,
Sætre R, Fernø A, Røttingen I (eds) The Norwegian Sea ecosystem. Tapir Academic Press, Trondheim, p 263−288 Nøttestad L (2001) Killer whales attacking schooling fish: Why force herring from deep water to the surface? Mar Mamm Sci 17: 343−352
Nøttestad L, Axelsen BE (1999) Herring schooling maneuvers in response to killer whale attacks. Can J Zool 77: 1540−1546 Nøttestad L, Giske J, Holst JC, Huse G (1999) A length-based hypothesis for feeding migrations in pelagic fish. Can J Fish Aquat Sci 56: 26−34
Nøttestad L, Fernö A, Axelsen BE (2002) Digging in the deep: killer whales’ advanced hunting tactic. Polar Biol 25: 939−941
Palka DL, Hammond PS (2001) Accounting for responsive movement in line transect estimates of abundance. Can J Fish Aquat Sci 58: 777−787
Pitcher TJ, Parrish JK (1993) Functions of shoaling behaviour in teleosts. In: Pitcher T (ed) Behaviour of teleost fishes, 2nd edn. Chapman & Hall, London, p 363−439
Prokopchuk I, Sentyabov E (2006) Diets of herring, mackerel, and blue whiting in the Norwegian Sea in relation to
Calanus finmarchicusdistribution and temperature condi-tions. ICES J Mar Sci 63: 117−127
Saulitis E, Matkin C, Barrett-Lennard L, Heise K, Ellis G (2000) Foraging strategies of sympatric killer whale (Orci-nus orca) populations in Prince William Sound Alaska. Mar Mamm Sci 16: 94−109
Sigurjónsson J, Lyrholm T, Leatherwood S, Jónsson E, Viking-son G (1988) Photoidentification of killer whales off Ice-land 1981 through 1986. Rit Fiskid 11: 1185−1189
Similä T (1997a) Sonar observations of killer whales (Orcinus orca) feeding on herring schools. Aquat Mamm 23: 119−126 Similä T (1997b) Behavioural ecology of killer whales in
northern Norway. PhD thesis, University of Tromsø Similä T, Ugarte F (1993) Surface and underwater
observa-tions of cooperatively feeding killer whales in northern Norway. Can J Zool 71: 1494−1499
Similä T, Holst JC, Christensen I (1996) Occurrence and diet of killer whales in northern Norway: seasonal patterns relative to the distribution and abundance of Norwegian spring-spawning herring. Can J Fish Aquat Sci 53: 769−779 Simon M, McGregor PT, Ugarte F (2007) The relationship between the acoustic behaviour and surface activity of killer whales (Orcinus orca) that feed on herring (Clupea harengus). Acta Ethol 10: 47−53
Slotte A (1999) Differential utilisation of energy during win-tering and spawning migration in Norwegian spring-spawning herring (Clupea harengus L). J Fish Biol 54: 338−355
Skjoldal HR, Misund OA, Sætre R, Fernø A, Røttingen (2004) The Norwegian Sea ecosystem. Tapir Academic Press, Trondheim, p 559
Smith TG, Siniff DB, Reichle R, Stone S (1981) Coordinated be -haviour of killer whales, Orcinus orca, hunting a crab eater seal Lobodon carcinophagus.Can J Zool 59: 1185−1189 Utne KR, Huse G, Ottersen G, Holst JC and others (2012)
Hor-izontal distribution and overlap of planktivorous fish in the Norwegian Sea during summer 1995–2006, re lated to water temperature. Mar Biol Res 8: 420−441
Vabø R, Nøttestad L (1997) Individual based model of fish schooling reactions: prediction of antipredator behaviour as observed in nature. Fish Oceanogr 6: 155−171
White DO, Cameron N, Spong P, Bradford J (1971) Visual acuity of the killer whale (Orcinus orca). Exp Neurol 32: 230−236
Editorial responsibility: Per Palsbøll, Groningen, The Netherlands
Submitted: January 25, 2013; Accepted: November 3, 2013 Proofs received from author(s): January 29, 2014