It matters which class you are in: student-centred teaching and the
enjoyment of learning mathematics
Andrew Noyes
University of Nottingham
The 2007 Trends in International Mathematics and Science Survey highlighted
how attitudes to mathematics had declined sharply for students in many of the
high attaining countries in the survey, England being no exception. There is a
notable drop in positive attitudes to mathematics between 9 and 14, as well as a
remarkable decline for 14 year olds over time. This paper explores survey data
collected from over 3000 11-year-olds in 16 schools during 2008 with the goal of
exploring possible factors that might be contributing to this attitudinal decline.
The association between student-centred teaching and enjoyment of learning
mathematics is reported as part of a multi-scale analysis that shows the extent to
which student experiences differ between schools and between classes within
schools.
Keywords: grouping, learner attitudes, student-centred pedagogy, classroom
culture
Introduction
The two survey points in the Trends in International Mathematics and Science Survey
(TIMSS), age 9 and 13, are bisected in England by the transition from primary to
secondary school, which has long been identified as a critical phase in young peoples’
educational trajectories (Nisbet and Entwistle 1969, Measor and Woods 1984, Galton et
al. 1999, Noyes 2006). There has been a great deal of research over the years aimed at
better understanding the challenges faced by students moving from primary to
secondary school at the age of 11. At this transition, students move from being taught
move to specialist teaching, there have for some time been political concerns about the
apparent hiatus in student progress in Years 7 and 8 (age 11-13) (Galton et al. 1999,
Ofsted 2002) following the transition. What is of particular interest herein is how young
people start their secondary school mathematics journeys; how this is mediated by
school and teacher and what impact this has on declining attitudes to mathematics.
The educational, social and political importance of mathematics in the school
curriculum remains high (DfEE 1999, DfE 2010). The main political drivers for its
curricular centrality are analyses of the economic return of mathematics qualifications,
both to the individual and the economy as a whole: success at advanced level has been
linked to future earning potential (Wolf 2002) whilst lack of basic mathematical skills
(‘numeracy’) has been shown to be the strongest indicator of unemployability (Bynner
and Parsons 1997). Such arguments are not unique to England (Gutstein 2009) and
necessarily contribute to the unique way in which school mathematics contributes to the
structuring of educational, social and economic hierarchies, both within and between
nations. This sociologic power of school mathematics is aptly described by Bourdieu
(1998, 28) when he writes about,
...the logic of furious competition which dominates the school institution, especially the effect of a final verdict or destiny that the educational system exerts over teenagers. Often with a psychological brutality that nothing can attenuate, the school institution lays down its final judgements and its verdicts, from which there is no appeal, ranking all students in a unique hierarchy of all forms of excellence, nowadays dominated by a single discipline, mathematics.
Nowadays, this ‘logic of furious competition’ is deeply embedded in England’s school
system through the invidious use of league tables, which since 2008 have had an
increased emphasis on English and mathematics. This has further entrenched the
pedagogic performativity (Ball 2003) that promotes the teaching to the test that has
been noted by Ofsted (2008) and in a major recent evaluation of 14-19 mathematics
that are the focus of this work they are transforming the cultures of mathematics
classrooms generally and the pedagogic repertoire of all teachers of mathematics.
Research on mathematics education has not focussed heavily on the transition
into secondary school, particularly on the formation and transformation of learner
attitudes. We know that by the time students reach the later years of high school most
are disengaged (Nardi and Steward 2003) and England has one of the lowest
participation rates in post-compulsory, i.e. post-16, mathematics (Hodgen et al. 2010).
But these attitudes can be traced back through young people’s educational careers and
into the general cultural antipathy to mathematics in the UK.
This paper considers the extent to which performative pedagogies, which are
generally teacher-centred, are prevalent at the start of secondary schooling. Secondly, I
will examine whether pedagogies that are student-centred are associated with more
positive attitudes to mathematics. But arguably more important than both of these I will
show that significant differences in such measures exist between classes: it matters a
great deal which class you are in. To focus on the headline statistics alone, even from
the 16 schools in this study, is to miss the very important variations in student
experiences that accrue from being in a different school or class. This is important, as
any policy or school intervention needs to take account of variation at different scales in
the data analysis. I will return to this point below.
From the studies of primary-secondary transition that have focused on
mathematics we know that learning trajectories are socially differentiated at the
primary-secondary interface (Noyes 2006), due in large part to the differential cultural
and social resources that students carry in what Thomson (2002) calls their ‘virtual
school bags’. Elsewhere Rice (2001) has shown that transition is a point of inflection in
small scale survey study (Galton et al. 2002) children in the final months of junior
school (aged 10/11, with the exception of high attaining boys) listed mathematics as
either first or second in a list of things least looked forward to in moving to secondary
school. These studies point to the importance of understanding students’ attitudes,
experiences and mathematics learning trajectories at this age.
The 2007 Trends in International Mathematics and Science Survey (Sturman et
al. 2007) highlighted the declining attitudes to mathematics between 9 and 13. Year 7
falls half way through this time period and given the research in the area of school
transfer, and the increased pressure on learners in the final years of primary education as
they are prepared for national examinations, it seems unsurprising that these structural
factors have an impact on learners’ attitudes to mathematics. The TIMSS study was
generally good news for mathematics attainment in England and was celebrated
accordingly by the government at the time. Only students from five countries – all from
the Pacific Rim – significantly outscored the sample from England, and England’s
overall score has been rising over time, largely due to increased attainment of middle
attaining students. However, the gap to these countries had increased from that found in
Year 5 (age 9/10).
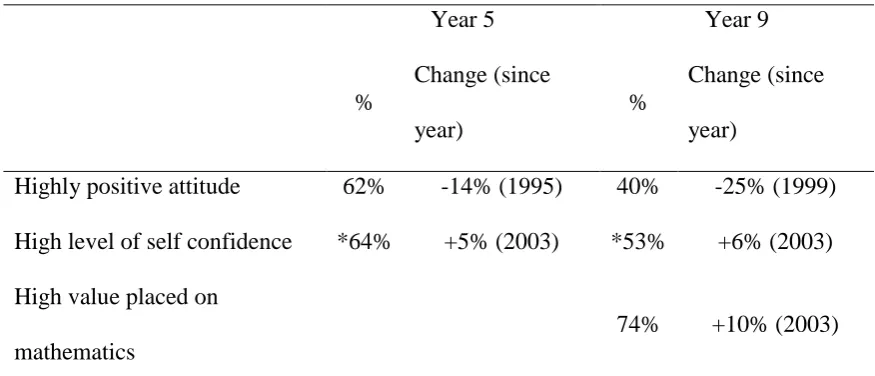
Despite the good news there was a concern about the changing attitudes to
mathematics, although this did not receive as much media attention or political
comment. Table 1 summarises the key attitudinal data and highlights from the survey.
Table 1: Summary of key attitudinal findings from England’s response to TIMSS 2007
(Sturman et al. 2007)
concerning, particularly in the light of research that indicates how attitudes relate to
likely participation later in the school career (Brown et al. 2008). The more dramatic
decline at Year 9, and the drop between Years 5 and 9, is related, at least in part, to what
is happening in schools in the intervening four years. Given the major transition that
happens at age 11 that exposes the structuring of educational trajectories and
distinctions between learning mathematics in primary and secondary phases,
considering the attitudes of learners of mathematics in the first year of secondary
schooling seems worthwhile.
Although the TIMSS data is analysed and reported at a national level, one of the
aims of the research reported here is to consider variations at finer levels of granularity,
i.e. between schools and teachers. There is growing evidence from school effectiveness
research that within-school variation in school effects is larger than between-school
effects. In other words, it matters more which teacher you have and class you are in than
which school you attend when it comes to considering the relationship between learner
progress and educational impact (Opdenakker et al. 2002). This seems to be common
sense and would probably not come as a surprise to teachers, parents or students.
However, what is remarkable is the emphasis by government on the school as the unit
of analysis in managing educational quality and how this level of granularity in the
league tables can obscure significant within-school variation in teacher quality, student
engagement and learning outcomes. Opdennakker et al conclude that “the most
important differences between teachers (with respect to explaining differences in
mathematics achievement) exist in their effect on the learning climate in the class” (p.
418). The following analysis will examine something of this learning climate and will
drill down through the full data set to explore the extent of these differentiations
The GMAP study
The data presented herein were collected in 2008 through surveys conducted in sixteen
11-18, state-funded, co-educational comprehensive schools in the Midlands of England.
This was one part of the Geographies of Mathematical Attainment and Participation
(GMAP) project, a mixed method study of post-14 mathematics education funded by
the Economic and Social Research Council (ESRC). The data was collected from these
11-year-olds in order to build up a clearer picture of the departmental curricula and
pedagogy and the general attitudes of students to mathematics.
The larger study integrated three levels of data collection and analysis:
(1) Descriptive statistical analysis and multilevel modelling was conducted using
data from the Department for Education’s National Pupil Database. This strand
of the work resulted in general statements regarding patterns in learner
performance and progression and identified some differences in learner progress
made in schools across a large region of England (Noyes 2009);
(2) From all of the schools across the region, sixteen 11-18 schools were identified
for further investigation representing different school types and catchments (see
Table 2). Students in years 7, 11 and 12 (age 11/12, 15/16 and 16/17) were
surveyed in middle of the year in order to explore school and classroom cultures,
attitudes to mathematics, future aspirations, etc. The statistical and survey
analyses indicated important between-school differences (Noyes 2012, Noyes
and Sealey 2012);
(3) Small groups (8-10) of students in eight of the survey schools were tracked
through years 11 and 12 (aged 15-17) in order to explore subject choice
strategies and mathematics learning trajectories.
teachers during lessons in order to maximise the response rate (see Table 2). The
investment in the research by the heads of department and their colleagues was helpful
in this regard but did also raise the possibility of interference in the completion of the
questionnaires. Prior meetings with staff and clear instructions for the completion,
packaging and return of the surveys were planned to mitigate any undue influence on
the data collection process. However, despite this best effort there remains some degree
of bias in the responses due to the presence of the teacher and the non-random absence
of students. Careful checking of class level measures was undertaken throughout the
analysis in order to identify any suspect response patterns.
In keeping with the broader, multi-scale design of the study, it was important to
not smooth out the variations between schools and classes as there are considerable
differences in the mathematical experiences and attitudes of these students. In this paper
I want to use the data in an exploratory way to highlight some key features of the
landscape and I am working mostly at the scale of schools and classrooms. I have
elsewhere focused in great detail on the individual learner’s trajectory at this age (Noyes
2008) and my method here is to zoom in and out of the data to explore the terrain at
different scales (whole sample, schools and groups). This process of zooming in and
out, rather as one would do with an online map, means that details appear more
prominently at certain levels. So in taking this approach I am trying to hold the big
picture together with the local detail. In (social) science research that uses multi-scale
approaches, for example ecology or urban studies, there is a concern to not smooth out
the local detail by working at too large a scale.
scale corresponds to one’s ‘window of perception’. More exactly, scale refers to the spatial dimensions at which entities, patterns, and processes can be observed and characterized. Thus, if one changes the scale at which a scene is viewed, one effectively changes (perceived)
The counter problem is how and where to focus so that analysis at a finer scale can
work with that at larger scales to develop more comprehensive understandings. This
scale-bridging is an on-going methodological/ analytic challenge (for a more detailed
methodological discussion see Noyes 2012, in press).
The 16 schools
The total sample of students is N=3058 and the response rate from schools was
generally very high (mean 84%), with the exception of schools F and K (see Table 2).
Table 2 includes a short description of the school type and approximate level of
attainment at age 16 in order to highlight the variation in schools types. Responses
from students in some schools have greater amounts of missing data in certain fields
suggesting that they deviated from the agreed approach to conducting the survey.
However, this missing data has very little impact upon the items used in this analysis.
Considerable time was spent cleaning the dataset and inferring missing data where it
was important and possible to do so, in particular with regard to students’ mathematics
group. All of the schools put students into ability groups at the outset of year 7, based
on attainment at the end of the primary school.
The survey included several scales that used Likert-type data to measure either attitudes
to school in general or mathematics in particular. One section of the survey examined
the teaching and learning styles experienced in mathematics lessons and was based on
items developed by Swan (2006) and I will return to this below. Clusters of items were
designed to form scales by converting ordered categorical responses (e.g.almost
always, most of the time, about half of the time, occasionally, almost never) to numeric
scores and summing the responses, reverse coding where appropriate. In doing this a
transformation appears to be taking place from ordered categorical data to interval data.
individual items. Of more interest here are the resulting scales. The nature of such
scales continues to be misunderstood and debated (Jamieson 2004) but there is support
for treating the scales as interval data (Pell 2005) that are robust in later parametric
analysis (Norman 2010). The items in the surveys used both 4- and 5-point Likert
scales and despite the long-running discussion on this (see Adelson and McCoach 2010,
for a recent summary) the difference through not having a neutral midpoint is marginal
and does not affect the broad conclusions of this analysis.
Table 2 Response rates of participating schools and indicative demographic description
Favourite and least favourite subjects
Early in the survey students were asked to report their favourite and least favourite
subjects. This is a problematic measure, as discussed below, but does raise some
interesting issues, not only in relation to the TIMSS study’s concerns about attitudes
(and enjoyment) but also in regard to the impact of teachers and between-school
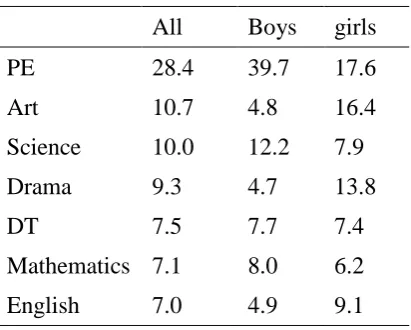
differences. Firstly, for the cohort as a whole, Table 3 shows the highest ranked
favourite subjects.
Table 3: Percentage of students reporting each subject as their favourite; top 7 subjects by ‘all’ percentage.
It is perhaps not surprising that the likes of PE and Art are high on the list due to their
practical nature and the expanded opportunities from the primary school. Neither is it
unexpected that clear differences exist between boys and girls. That said, 1 in 14 (~7%)
of these year 7 students list mathematics as their favourite subject, the gender difference
is not that great and these students are representative of the whole ability range. In
this to the pattern for these students’ least favourite subject (Table 4). Those citing
maths as their least favourite are more likely to have lower prior attainment1.
Table 4: Percentage of year 7 students reporting each subject as their least favourite
Both of these tables do not constitute an attitude score as clearly the identification of a
subject is not simply about that one subject but is made in relation to others. Whilst a
student who really enjoys mathematics, but not as much as, say, PE, would not show up
here, an attribution of ‘least favourite’ is more likely to reflect a genuinely negative
attitude to mathematics. Although the favourite subject measure is not altogether robust,
it is striking that 1 in 5 11-year-olds lists mathematics as their least favourite subject,
and that girls are much more likely to do so as boys. Nearly one quarter of the girls in
this sample cite mathematics as their least favourite subject in year 7. Whether this is
an absolute or relative measure, the fact that this many young people are willing to
express their relative dislike of mathematics is concerning, but not surprising. Despite
its shortcomings the ‘favourite subject’ measure does have some exploratory value so I
use it whilst remaining aware of its limitations.
Over one third of 11 year old girls in this study reported that mathematics or
science was their least favourite subject and although these attitudes are not fixed these
are worrying early signs given the emphasis that has been, and continues to be placed
on these subjects in education policy. The recent Royal Society (2010) ‘State of the
Nation’ report on 5-14 mathematics and science education notes the trend in girls’
declining attitudes to mathematics in the later years of primary education and clearly
this is an area that needs to be better understood and tackled.
Interesting though these figures are, it would be instructive to know what, if
differences. Does it matter which school you go to? Is one mathematics department
more likely to inspire interest than another? Schools C, F and L have over 10% of their
students listing mathematics as their most favourite (13.4, 10.8 and 10.2% respectively)
whereas G, A, P and K all have fewer than 5% in the same category (4.9, 4.6, 3.8 and
0% respectively). These are not the differences of social backgrounds as these seven
schools are very different in catchment (see Table 2). However, it would be incorrect to
conclude that these differences are simply about schools. Other findings from the wider
study highlight the significant impact of one or two classes or teachers upon findings.
For example, the ten year 7 classes in school C (i.e. the school with the highest number
of students listing mathematics as their favourite subject) have the following
percentages of students listing the subject as their favourite, in order: 0, 0, 0, 7, 9, 12,
15, 19, 33 and 44. Admittedly these percentages can vary dramatically with the
responses of a few students but this shows that comparisons between schools might hide
far greater variations within schools. School C is particularly interesting in this regard
but such within-school variations can be seen across the sample, albeit without those
high values.
Similar patterns occur with the findings about least favourite subjects. Again, as
would be expected there is a range, from schools P and M with 33 and 32% of students
reporting mathematics as their least favourite subject, down to N and G at 11 and 8%
respectively. Notwithstanding the problematic nature of these measures, having one
third of a school cohort of students citing mathematics as their least favourite subject at
the start of secondary school is concerning. These differences between schools, as with
the percentages in the previous paragraphs, are statistically significant. In both schools
P and M groups range from below 10 to over 50% of students citing mathematics as
should be exercised in reading too much into these numbers but the point remains that
these variations are not simply random but might well have something to do with what
is happening in classrooms.
Focusing on school C again shows classes that feature prominently in each of these lists
as shown in Figure 1. Although this analysis is progressively building on a rather shaky
foundation measure (favourite/least favourite) there would seem to be some merit in
investigating the differences between classes CC2/7 and CC1/4/9/10 so I will return to
this later in the paper.
Figure 1: percentage of students reporting maths as favourite/least favourite (or neither) for the ten year 7 groups in school C.
Students’ views of teaching and learning
The questionnaire explored the kinds of mathematical activities that were typically
encountered in lessons. The first column in the table indicates whether these items are
more student (S) or teacher-centred (T). The notion of student-centred teaching and
learning is not new (Miller-Allen 1978) and has received recent attention in secondary
(Hernandez-Martinez et al. 2011, e.g. DeBoer 2002) and higher education contexts
(Hockings 2009, e.g. Berry and Sharp 1999). Hockings argues that “student-centred
learning has the potential to engage a more academically diverse student body than the
more conventional teacher-centred approaches” (p. 83) but arguably it is an
oversimplification to argue for one form of centredness over another. For the purposes
of this analysis, student and teacher-centredness are defined by the statements in Table
5 and these are discussed in more depth in Swan (2006). Pampaka et al. (2011, in press)
have also taken up Swan’s items, employing a Rasch analysis to explore similar
the teacher items rather than the student items used herein. Teacher-centred pedagogy
is typically of a transmission style and in contrast to student-centred approaches which
prioritise discussion, collaboration and an ethic of inquiry.
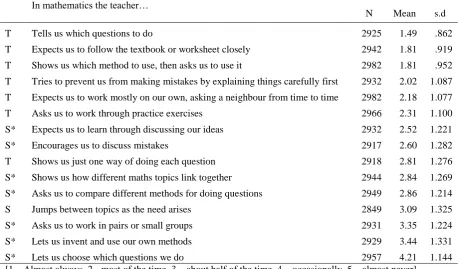
Table 5: Responses to range of items on mathematics pedagogy
The items in Table 5 have been ordered from those most commonly reported to those
least commonly reported. In doing this the student-centred items filter out as less
commonly experienced. The school inspectorate, Ofsted (2008), has recently noted that
the performative culture of schools is leading to too much emphasis on atomised
curriculum dominated by test preparation. Although the focus of that report was for
older children this culture is all pervasive and it is no surprise that teacher-centred
pedagogies are predominant and student-centred approaches are less common. Analysis
of variance (ANOVA) suggests that schools in this sample are significantly different
from one another in terms of the extent of student-centred teaching but as shown above,
there are likely to be within-school differences. Whether the between-school
differences here are replicated across the wider population of schools is impossible to
say.
Rather than look at each of these items separately they were designed to form a scale of
student-teacher centredness (see Swan 2006). After reverse coding the relevant items,
the scale was found to not be sufficiently reliable. However, the student-centred items
(marked with * in Table 5) do comprise a scale (Cronbach’s alpha = 0.81)2
of
centred teaching. The full scale is from 7-35 with lower scores signifying more
student-centred teaching. Whether student-student-centred and teacher-student-centred teaching can be expected
the balance view (i.e. classrooms that are more student centred are less teacher-centred,
and vice versa) is common in practice-oriented literature their statistical analysis did not
support that theory. They proposed alternative models of the relationship between these
two modes of teaching and learning. For example, the independent view suggests that
the two types of activity could be mutually exclusive and that learning environments
should be developed that include high quality teaching of both types. This will have
implications for the conclusions below.
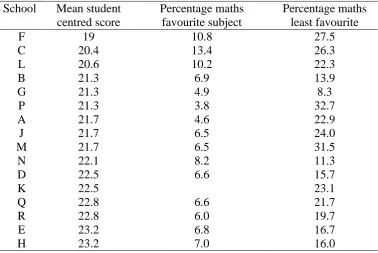
Table 6: Mean response at school level on student-centred scale.
The mean scale scores for each school are shown in Table 6. Even at the whole school
level there is a reasonable correlation (r = 0.53, statistically significant at the 0.05 level)
between the proportion of students listing mathematics as their favourite subject and the
extent of student-centred pedagogy (as reported by the students). Although we cannot
say with any confidence that this is a causal relationship, any causality would be best
understood in the direction of pedagogy influencing enjoyment. Students in school C
report relatively high levels of student-centred teaching but, following the earlier
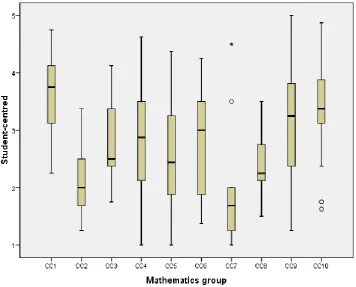
analysis, this might vary between classes. In Figure 2, the student-centred measure has
been scaled (from 7-35, down to 1-5) for easy comparison with the survey response
levels [1 – Almost always, 2 - most of the time, 3 – about half of the time, 4 –
occasionally, 5 – almost never].
Figure 2: Box plot of student-centred responses for ten groups in school C
There appears to be a strong relationship between the students’ identification of
Indeed the correlation (r=0.81, statistically significant at the 0.001 level) is now very
strong with two thirds of the variation in the proportion of the class having maths as a
favourite subject explained by the extent of student-centred pedagogy. Given the
inherent problems with the ‘favourite’ measure this correlation is arguably not a
statistical fluke but is actually quite remarkable. Groups 2 and 7 are apparently the
most student-centred whilst the four groups with the highest median scores, indicating
the least student-centred teaching are in fact the four groups with the high proportion of
students saying that it is their least favourite subject. Zooming back out to all of the 127
classes in the dataset to see the relationship between the measures of student-centred
teaching and proportion of students citing mathematics as favourite we find a
statistically significant (at the 1% level) correlation of r=0.43. Assuming that different
attitudes can result from teaching styles (otherwise why would anyone bother) it seems
that one way of increasing highly positive attitudes to mathematics (in this case, maths
as favourite subject) would be to increase the amount of student-centred teaching, but
that would of course also require a concomitant change in the beliefs and habits of
teachers.
Teacher quality and class culture
The survey included other items about students’ perceptions of the quality of the
teaching in mathematics and working climate within the group. Responses were on a
four point scale (strongly agree, agree, disagree, strongly disagree) and a quick survey
of the scale means and standard deviations suggest that here too there is considerable
variation between classes and schools.
The first of these two scales is concerned with the perceived quality of the
My maths teacher knows the subject matter well
My maths teacher helps me if I don't understand something
My maths teacher explains things clearly
My maths teacher gives me useful feedback on how I am doing
My maths teacher gets me interested
The second scale is measuring the mathematics classroom culture and is not quite as
reliable as the first scale (α = 0.76). However, given the typically accepted threshold for
scale reliability of 0.8, combined with the large sample, all of the items are retained.
In my maths group students can cope with the work
In my maths group we help each other
In my maths group most students like the teacher
In my maths group most students are interested
In my maths group pupils are well behaved
A scale measure was constructed for each student by summing the responses to the set
of items and then means were found for each of the 127 classes in the study. Each scale
were tested for normality3. With such a small number of items, attempts to extract a
number of factors simply confirms the unidimensionality of the scale, so this analysis
retains them as a scale, assuming some underlying latent variable is being measured.
This does not give the subtlety of the factor loadings that arise from principle
component analysis but given that these groups of questions were intended to act as
scales, and that they have sufficiently strong scale reliability, this decision is justified.
Table 7 shows reasonable correlations between these scales (aggregated at the class
level) and the proportion of the class citing maths as ‘favourite’ or ‘least favourite’,
Table 7: Correlation matrix (all correlations are statistically significant at the 0.01 level)
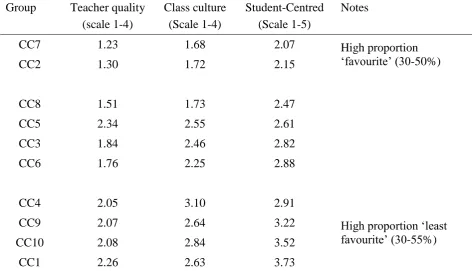
Returning to school C, Table 8 indicates how these measures relate for the ten
classes in this particular school.
Table 8: Comparison of scales with positive and negative attitudes to mathematics.
The associations here are clearly laid out and suggest that it matters a great deal
which teacher you get in this school as to how you feel about your learning of
mathematics. This might also have something to do with the class as a whole so it
would be fairer to say that both the teacher and the class make a difference, although
these are not independent, which is one of the reasons why exploring causality in school
effects is so problematic. As pointed out earlier, this is hardly a revelation but is a
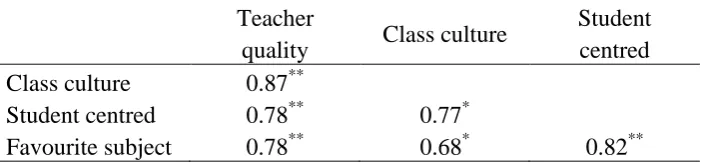
reality of which most school children are all too aware. The correlation matrix for
school C shows strong correlations between all of these measures.
Table 9: Correlation matrix of key measures at class level [**statistically significant at the 0.01 level. *statistically significant at the 0.05 level]
The analysis has zoomed in and out of the scales embedded in this dataset with a
particular focus on school C. Analysis between schools reveals far less variation in
these measures than within-school. School C is of particular interest because of the
range, and generally high score on the favourite subject response. So, whilst it is a case,
Finally, Table 10 presents the correlations after zooming back out to consider how some
of these variables are connected at the student level across the whole sample in sixteen
schools. It shows small but statistically significant correlations between many of these
variables but the effect sizes are generally small. Student-centred teaching is important
but at this individual level accounts for about one sixth of the variation in whether
students consider their maths lessons to be interesting. This is not unimportant.
Table 10 Correlation matrix (Pearson) for all variables, at student level [** Correlation is statistically significant at the 0.01 level. * Correlation is statistically significant at the 0.05 level]
It is notable that there is a negative correlation, albeit small, between prior
attainment (Year 6 NC test), which is a proxy for the ability group, and reporting
of student-centred teaching. This raises the question of whether lower ability
groups are getting different teaching and learning experiences, i.e. less
student-centred, which might further exacerbate their generally more negative attitudes to
mathematics. Where mathematics lessons are considered to be interesting
students are much less likely to cite the subject as their least favourite, which
makes sense.
Conclusions
The overarching aim of this paper was to investigate how aspects of students’
perceptions and attitudes to mathematics teaching and learning vary between schools
and classes at the start of secondary school, the midpoint of the two age points included
in the TIMSS assessments. From this exploratory analysis of responses from 3058
students within 127 classes in 16 schools, different features are clear at different scales
As expected there are a high number of 11/12 year olds citing mathematics as
their least favourite subject although the impact of the class, and to a lesser extent the
school, is evidently very important. This scaled approach cautions against
place-independent analyses of student attitudes to mathematics and opens up possibilities for
understanding the conditions in which students might become more engaged in
mathematics. When considering teacher pedagogy and classroom culture it becomes
clear that the practices of teachers have a very real impact upon the attitudes of students,
both positively and negatively. What this survey cannot do is separate out the character
and beliefs of those teachers so it would be wrong to conclude that student-centred
teaching is all that is needed; pedagogy cannot be separated from the pedagogue.
However, the findings offer support for the long-term development of more
student-centred approaches to learning mathematics in an attempt to increase positive attitudes
to mathematical study (see Pampaka et al. 2011, in press). Across the whole cohort of
students, teacher-centred pedagogies are far more common than student-centred ones
but again this is very much dependent upon the school and class in which the student
finds him or herself. For these students, quality teaching is explained in part by the
extent to which it is student-centred and both of these measures are well correlated with
mathematics lessons being described as interesting. Although the relationship between
student-centred and teacher-centred teaching has taken a turn (Elen et al. 2007) in the
literature the conclusion remains that there needs to be an increase in the quantity and
quality of student-centred learning in mathematics classrooms. However, in adopting
Elen et al’s independent view of the relationship between student- and teacher- centred
teaching means that student-centred teaching should not be advocated at the expense of
both, albeit the need for improving student-centred teaching is arguably more pressing.
More research on this relationship in mathematics classrooms would be helpful.
What is concerning in all of this, both from an equity and professional
development perspective, is the extent of variation within schools. Further multi-scale
studies are required in order to relate close-up analysis of classroom practice to patterns
in pupil outcomes (affective, aspiration and attainment) that these reinforce and/or
produce. One particularly example of within-school variation is school C, in which
students seem to have a very different pedagogical experience depending upon which
group they are in and which teacher they have. In order for this not to become some
kind of mathematical lottery in which only some can work with the most student-
centred teachers there is clearly work to be done on collaborative development of
pedagogy and curriculum – within schools as well as between them. Although this
analysis cannot confirm whether such differences exist elsewhere it is almost certainly
the case that they do, but not in all schools.
These findings are important at a time when there is a push towards more
traditional, teacher-centred approaches to curriculum and pedagogy. On the basis of the
evidence herein, actions leading to a reduction in student-centred teaching through a
push to encourage teacher-centred instruction would reduce variation in experiences but
only because some of the most motivating methods would get squeezed out of
classrooms. This form of standardising would be regressive and would probably lead to
even more students developing negative attitudes to their mathematics. Instead,
strategies need to be found for supporting teachers to develop these modes of
student-centred pedagogy.
This analysis says little about measured student progress. However, based on
learning is likely to have a positive benefit on outcomes (Marsh 1986) , more
student-centred learning would lead to increased engagement and attainment in mathematics
classrooms in England. In addition, such an approach might mitigate against the trends
reported in TIMSS, reducing the drift to disengagement with mathematics between the
ages of 14 and 18 in the UK.
Acknowledgements
The Geographies of Mathematical Attainment and Participation project was funded by the
Economic and Social Research Council (RES-061-25-0035). I would like to thank the editors
and anonymous reviews for their careful, critical and constructive comments on earlier drafts of
this paper, in particular their patience with (though not necessarily the endorsement of) my
approach to measurement.
Endnotes
1
Student citing maths as their least favourite subject are more likely to have lower prior
attainment. For example, of the boys in this sample obtaining level 3/4/5 (the latter being
the highest) in the Key Stage test for 11 year olds, there were 32/20/11 percent reporting
maths as least favourite. The comparable data for girls is 33/26/16 percent. There is no
suggestion of a causal relationship here.
2
Although what I have called ‘scales’ have acceptably high Cronbach’s alphas (>0.7) the
analysis is undertaken in the knowledge that a high ‘score’ is not a guarantee of
unidimensionality (see Field 2005, p 668, for a discussion). The sets of items were
designed as scales and factor analysis does not identify a more complex factor structure.
3
Each of the scales was tested for normality in SPSS using standard tests: Kolmogorov-Smirnov
and Shapiro-Wilkinson. Under both tests, all three scales used in the analysis (teacher
quality, class culture, student-centred) were significant (p<0.01) at student level. This
indicates deviation from the normal distribution. However, as pointed out by Field (2005,
93), large sample sizes can lead to significant deviations from normality when in fact the
distribution is close enough to be assumed normal. Closer inspection of Normal Q-Q plots
for the three scales suggests sufficient alignment with the normal distribution for the
calculated and tested they are not significantly different (p>0.05) to the normal
distribution.
References
Adelson, J. & Mccoach, B. 2010. Measuring the Mathematical Attitudes of Elementary Students: The Effects of a 4-Point or 5-Point Likert-Type Scale. Educational and Psychological Measurement 70, 796-807.
Ball, S. 2003. The teacher's soul and the terrors of performativity. Journal of Education Policy 18, 215-228.
Berry, J. & Sharp, J. 1999. Developing student-centred learning in mathematics through co-operation, reflection and discussion. Teaching in Higher Education 4, 27-41. Bourdieu, Pierre. 1998. Practical Reason. Cambridge, Polity Press.
Brown, M., Brown, P. & Bibby, T. 2008. "I would rather die": reasons given by 16-year-olds for not continuing their study of mathematics. Research in
Mathematics Education 10, 3-18.
Bynner, J. & Parsons, S. 1997. Does Numeracy Matter? Evidence from the National Child Development Study on the Impact of Poor Numeracy on Adult Life. London: Basic Skills Agency.
Deboer, G. 2002. Student-centred teaching in a standards-based world: finding a sensible balance. Science and Education 11, 405-417.
DfE 2010. The Importance of Teaching. London: HMSO.
DfEE 1999. A Fresh Start - improving literacy and numeracy London: Department for Education and Employment.
Elen, J., Clarebout, G., Léonard, R. & Lowyck, J. 2007. Student-centred and teacher-centred learning environments: what students think. Teaching in Higher Education 12, 105-11.
Field, Andy. 2005. Discovering statistics using SPSS. London, Sage Publications Ltd. Galton, M., Comber, C. & Pell, T. 2002. The consequences of transfer for pupils:
attitudes and attainment. In: Hargreaves, L. & Galton, M. (eds.) Transfer from the primary classroom: 20 years on. London: RoutledgeFalmer.
Galton, M., Gray, J. & Rudduck, J. 1999. The Impact of School Transitions and Transfers on Pupil Attainment and Progress, Norwich, HMSO.
Gutstein, E. 2009. the politics of mathematics education in the United States: dominant and counter agendas. In: Greer, B., Mukhopadhyay, S., Powell, A. & Nelson-Barber, S. (eds.) Culturally Responsive Mathematics Education. Abingdon: Routledge.
Hay, G. J. 2005. Bridging scales and epistemologies. International Journal of Applied Earth Observation and Geoinformation 7, 249-252.
Hernandez-Martinez, P., Williams, J., Black, L., Davis, P., Pampaka, M. & Wake, G. 2011. Mathematics coursework as facilitator of formative assessment, student-centred activity and understanding. Research in Mathematics Education 13, 197-212.
Hockings, C. 2009. Reaching the students that student-centred learning cannot reach. British Educational Research Journal 35, 83-98.
Hodgen, J., Pepper, D., Sturman, L. & Ruddock, G. 2010. Is the UK an Outlier? London: Nuffield Foundation.
Marsh, H. 1986. Verbal and Math Self-Concepts: An Internal/External Frame of reference model. American Educational Research Journal 23, 129-149. Measor, L. & Woods, P. 1984. Changing Schools: pupil perspectives on transfer to a
comprehensive, Milton Keynes, Open University Press.
Miller-Allen, H. 1978. Analysing teaching in a student-centred classroom. . British Journal of Teacher Education 4, 37-46.
Nardi, E. & Steward, S. 2003. Is Mathematics T.I.R.E.D? A Profile of Quiet Disaffection in the Secondary Mathematics Classroom. British Educational Research Journal 29, 345-367.
Nisbet, J. & Entwistle, N. 1969. The Transition to Secondary Education, London, University of London Press Ltd.
Norman, G. 2010. Likert scales, levels of measurement and the ‘‘laws’’of statistics. Advances in Health Science Education 15, 625-632.
Noyes, A. 2006. School Transfer and the Diffraction of Learning Trajectories. Research Papers in Education 21, 43-62.
Noyes, Andrew. 2008. Mathematics learning trajectories. Saarbrucken, VDM.
Noyes, A. 2009. Exploring social patterns of participation in university-entrance level mathematics in England Research in Mathematics Education 11, 167-183. Noyes, A. 2012. The effective mathematics department: adding value and increasing
participation? School Effectiveness and School Improvement, in press.
Noyes, A. 2012, in press. Scale in education research: considerations for a multi-scale methodology. International Journal for Research and Method in Education. Noyes, A., Drake, P., Wake, G. & Murphy, R. 2010. Evaluating Mathematics Pathways:
Final Report, December 2010 London: Department for Education. Noyes, A. & Sealey, P. 2012. Investigating participation in Advanced level
mathematics: a study of student drop out Research Papers in Education 27, 123-138.
Ofsted 2002. Changing Schools: Evaluation of the effectiveness of transfer arrangements at age 11. London: Office for Standards in Education.
Ofsted 2008. Understanding the Score. London: Office for Standards in Education. Opdenakker, M. C., Van Damme, J., De Fraine, B., Landeghem, G. & Onghena, P.
2002. The Effect of Schools and Classes on Mathematics Achievement. School Effectiveness and School Improvement 13, 399-427.
Pampaka, M., Williams, J., Hutcheson, G., Wake, G., Black, L., Davis, P. &
Hernandez-Martinez, P. 2011, in press. The association between mathematics pedagogy and learners’ dispositions for university study. British Educational Research Journal.
Pell, G. 2005. Uses and misuses of Likert scales. Medical Education 39, 970.
Rice, J. K. 2001. Explaining the negative impact of the transition from middle to high school on student performance in mathematics and science. Educational Administration Quarterly 37, 372-400.
Royal Society 2010. Science and Mathematics Education 5-14: a state of the nation report. London: The Royal Society.
Sturman, L., Ruddock, G., Burge, B., Styles, B., Lin, Y. & Vappula, H. 2007.
England’s achievement in TIMSS 2007: National report for England, Slough, NFER.
Swan, Malcolm. 2006. Collaborative learning in mathematics: a challenge to our beliefs and practices. London, NIACE.
Tables
Year 5 Year 9
% Change (since year) % Change (since year)
Highly positive attitude 62% -14% (1995) 40% -25% (1999)
High level of self confidence *64% +5% (2003) *53% +6% (2003)
High value placed on
mathematics
74% +10% (2003)
[image:25.595.78.516.120.308.2]*significantly more boys than girls reported a high level of self confidence
Table 1: Summary of key attitudinal findings from England’s response to TIMSS 2007
(Sturman et al. 2007)
School* School Type
% 5 or more A*-C
grades inc. English
and Maths (2008)
responses % of cohort
A Village, largely white British 70 177 88.1
B Suburban, ethnically diverse catchment 65 216 91.5
C Suburban, ethnically diverse 45 221 88.8
D Suburban, ethnically diverse 75 242 96.4
E Medium town, Voluntary aided, white British 70 192 93.2
F Small town, ex-mining, white British 40 102 47.4
G Small town, agricultural, white British 65 206 96.7
H Suburban, white British 75 244 94.6
J Small town, industrial, white British, 45 200 88.1
K Commuter village, largely white British 70 65 48.1
L Village, ex-mining, white British 45 167 84.3
M Village, white British 40 171 76.7
N City, voluntary aided, ethnically diverse 60 159 88.3
P Small town, ex-mining, white British 30 212 73.1
Q Suburban, ethnically diverse 50 198 85.3
R Rural, ex-mining, white British 45 286 90.8
Table 2 Response rates of participating schools and indicative demographic description
All Boys girls
PE 28.4 39.7 17.6
Art 10.7 4.8 16.4
Science 10.0 12.2 7.9
Drama 9.3 4.7 13.8
DT 7.5 7.7 7.4
Mathematics 7.1 8.0 6.2
[image:26.595.196.402.199.364.2]English 7.0 4.9 9.1
Table 3: Percentage of students reporting each subject as their favourite; top 7 subjects by ‘all’ percentage.
All Boys girls Mathematics 19.9 16.7 23.0
English 11.3 15.3 7.4
RE 9.8 10.9 8.8
Science 9.0 5.5 12.4
Geography 8.9 8.0 9.7
French 7.6 8.5 6.7
[image:26.595.196.401.524.684.2]History 5.6 4.7 6.5
In mathematics the teacher…
N Mean s.d
T Tells us which questions to do 2925 1.49 .862
T Expects us to follow the textbook or worksheet closely 2942 1.81 .919
T Shows us which method to use, then asks us to use it 2982 1.81 .952
T Tries to prevent us from making mistakes by explaining things carefully first 2932 2.02 1.087
T Expects us to work mostly on our own, asking a neighbour from time to time 2982 2.18 1.077
T Asks us to work through practice exercises 2966 2.31 1.100
S* Expects us to learn through discussing our ideas 2932 2.52 1.221
S* Encourages us to discuss mistakes 2917 2.60 1.282
T Shows us just one way of doing each question 2918 2.81 1.276
S* Shows us how different maths topics link together 2944 2.84 1.269
S* Asks us to compare different methods for doing questions 2949 2.86 1.214
S Jumps between topics as the need arises 2849 3.09 1.325
S* Asks us to work in pairs or small groups 2931 3.35 1.224
S* Lets us invent and use our own methods 2929 3.44 1.331
[image:27.595.80.542.72.341.2]S* Lets us choose which questions we do 2957 4.21 1.144 [1 – Almost always, 2 - most of the time, 3 – about half of the time, 4 – occasionally, 5 – almost never]
Table 6: Mean response at school level on student-centred scale School Mean student
centred score
Percentage maths favourite subject
Percentage maths least favourite
F 19 10.8 27.5
C 20.4 13.4 26.3
L 20.6 10.2 22.3
B 21.3 6.9 13.9
G 21.3 4.9 8.3
P 21.3 3.8 32.7
A 21.7 4.6 22.9
J 21.7 6.5 24.0
M 21.7 6.5 31.5
N 22.1 8.2 11.3
D 22.5 6.6 15.7
K 22.5 23.1
Q 22.8 6.6 21.7
R 22.8 6.0 19.7
E 23.2 6.8 16.7
Student-centred Favourite Least favourite Teacher quality
Favourite 0.429
Least favourite -0.279 -0.355
Teacher
quality 0.431 0.447 -0.653
[image:29.595.72.531.106.204.2]Class culture 0.360 0.354 -0.700 0.780
Table 7: Correlation matrix of variables aggregated at whole-class level (all correlations are statistically significant at the 0.01 level)
Group Teacher quality (scale 1-4)
Class culture (Scale 1-4)
Student-Centred (Scale 1-5)
Notes
CC7 1.23 1.68 2.07 High proportion
‘favourite’ (30-50%)
CC2 1.30 1.72 2.15
CC8 1.51 1.73 2.47
CC5 2.34 2.55 2.61
CC3 1.84 2.46 2.82
CC6 1.76 2.25 2.88
CC4 2.05 3.10 2.91
High proportion ‘least favourite’ (30-55%)
CC9 2.07 2.64 3.22
CC10 2.08 2.84 3.52
CC1 2.26 2.63 3.73
[image:29.595.61.538.356.627.2]Teacher
quality Class culture
Student centred
Class culture 0.87**
Student centred 0.78** 0.77*
[image:30.595.82.433.113.194.2]Favourite subject 0.78** 0.68* 0.82**
Table 9: Correlation matrix of key measures at class level [** Correlation is statistically significant at the 0.01 level.* Correlation is significant at the 0.05 level]
My maths lessons are
interesting
Year 6 NC test levels
Teacher quality
Group culture
Year 6 NC test level -0.02
Teacher quality 0.65** 0.04*
Group Culture 0.55** 0.10** 0.58**
Student-centred 0.42** -0.16** 0.50** 0.40**
Figures
[image:31.595.125.482.444.731.2]Figure 1: Percentage of students reporting maths as favourite/least favourite (or neither) for the ten year 7 groups in school C.
Figure 2: Box plot of student-centred responses for ten groups in school C. 0%
10% 20% 30% 40% 50% 60% 70% 80% 90% 100%
Favourite Neither