DOI 10.1007/s10035-013-0466-0 O R I G I NA L PA P E R
Discrete element modelling of one-dimensional compression
of cemented sand
J. P. de Bono · G. R. McDowell
Received: 25 July 2013 / Published online: 29 November 2013 © Springer-Verlag Berlin Heidelberg 2013
Abstract It has recently been shown that the one-dimensional normal compression of sand can be modelled effectively in three-dimensions using the discrete element method, and that the slope of the compression curve (in log voids ratio–log stress space) is controlled by the size effect on average particle strength. This paper incorporates soil struc-ture by simulating cemented sand, and the effects of inter-particle bonding (including bond strength and strength dis-tributions) on the one-dimensional compression behaviour and evolving particle size distributions are investigated. The results show that bonding reduces particle crushing, and it is both the magnitude and distribution of bond strengths that influence the compression curve of the structured material.
Keywords DEM·Particle crushing·Cemented sand· Compression
1 Introduction
Both cemented and uncemented materials exhibit some sim-ilarities in compression; both demonstrate stiff, primarily elastic behaviour (in addition to plastic rearrangement of particles) before yield and particle crushing. However, the addition of cement is known to increase the yield stress and enlarge the zone in voids ratio–log stress space that a material can exist in [1–3], meaning cemented sand can exist in states impossible for the uncemented soil, with these effects increasing with the degree of cementation. Leroueil and Vaughan [1] defined this as ‘structure-permitted space’, which is bounded by the compression line of the uncemented
J. P. de Bono·G. R. McDowell (
B
) University of Nottingham, Nottingham, UK e-mail: [email protected]soil in its loosest state and that of the densest, most cemented soil.
The general consensus from the available literature is that after yielding, the normal compression lines of cemented and uncemented materials either run parallel [4–6] or converge at high pressures to a single ‘intrinsic’ line [3,7], with the degree of cementation controlling the distance between them and/or the rate at which they converge (these schemes are compared in Fig.1).
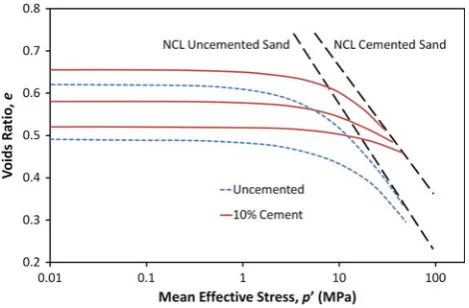
Typical compression behaviour of a silica sand (which is the type of sand modelled in this work) bonded with Port-land cement is shown in Fig. 2 from Marri et al. [8]. Sil-ica sands are generally much stronger than naturally occur-ring carbonate sands and organic soils and so exhibit larger yield stresses in compression. The figure shows the com-pression behaviour of two uncemented samples, and three samples with 10 % cement content; with various initial voids ratios. The effects of cementation are clearly visible in Fig. 2, although the applied stress is not high enough to conclude if the normal compression lines (NCLs) are converging or independent of one another. Although some of the literature considers isotropic compression and some one-dimensional compression, it is widely accepted that soils have the same compression slope in both [9–11].
2 Numerical model
Fig. 1 Schematics showing idealised compression plots depicting the behaviour of cemented sands in compression [3–7], showing parallel NCLs (a) and converging NCLs (b)
Fig. 2 The effects of cementation on the behaviour of a silica sand in
compression, data from Marri et al. [8]
the particles. The new one-dimensional normal compression law is given by the equation:
log e=log ey−
1 2blog
σ σy
(1)
where e is the current voids ratio,σis the applied stress, eyis the value on the linear log–log plot at a stress corresponding to the yield stressσy, and b controls the particle size effect on average particle strengthσav:
σav∝d−b (2)
where d is the particle diameter. This new law was able to correctly predict the slope of the normal compression line for a range of simulations, and demonstrated agreement with experimental results for silica sand (Fig.3). In this paper, the compression of cemented sand is investigated, in particular
Fig. 3 One-dimensional compression plot for silica sand, plotted on
log e–logσaxes, showing the predicted slope according to Eq. (1), data from McDowell and de Bono [12]
the influence of inter-particle bonding on particle crushing and compressibility.
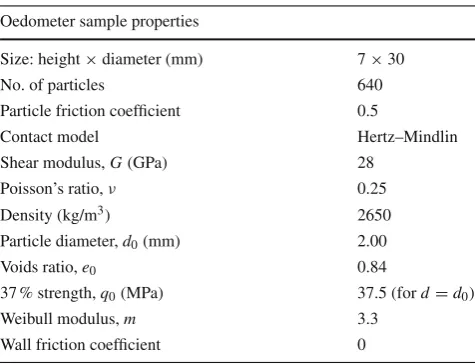
[image:2.595.52.287.283.437.2]Table 1 DEM parameters for the oedometer sample
Oedometer sample properties
Size: height×diameter (mm) 7×30
No. of particles 640
Particle friction coefficient 0.5
Contact model Hertz–Mindlin
Shear modulus, G (GPa) 28
Poisson’s ratio,ν 0.25
Density (kg/m3) 2650
Particle diameter, d0(mm) 2.00
Voids ratio, e0 0.84
37 % strength, q0(MPa) 37.5 (for d=d0)
Weibull modulus, m 3.3
Wall friction coefficient 0
of particles have been produced. The initial monodispersity makes it difficult to conduct tests at different initial voids ratios (for example like those shown in Fig.2), however this was chosen to emphasise the incidence of crushing [12]. The following work serves as an investigation into the effects of cementation on crushing, rather than a direct calibration against physical tests.
To determine whether fracture should occur or not, the octahedral stress within each particle was used:
q = 1 3
(σ1−σ2)2+(σ2−σ3)2+(σ1−σ3)2
1/2
(3)
This provides a simple criterion to facilitate breakage tak-ing into account multiple contacts on a particle surface while avoiding the use of agglomerates. Although the stresses in a spherical particle vary as a function of position within the volume of the particle [13,14], the simplification of using the average octahedral shear stress provides a simple criterion to facilitate breakage taking into account multiple contacts and different contact forces on a particle surface while avoid-ing the use of agglomerates. For PFC3D [15], for a sphere compressed diametrically between two walls, the value of q generated using the above equation is equivalent to:
q =0.9F
d2 (4)
and so is 0.9 times the induced characteristic stress according to Jaeger [13]. Therefore the assumption was made that for particles loaded under multiple contacts, the particle would break if the octahedral shear stress was greater than or equal to its ‘strength’. In this paper the strengths of the particles satisfy a Weibull distribution of q-values, and according to McDowell and de Bono [12], if the Weibull modulus is m
and the failure is governed by bulk fracture, then:
b= 3
m (5)
When a particle was found to have an induced value of q greater than or equal to its strength, it was replaced by two equal-sized fragments within the parent sphere, which over-lapped so that the particles moved in the direction of the minor principal stress [12]. The total volume of the two fragments was equal to that of the parent sphere to ensure conservation of mass. Although the fragments of broken spheres are not spheres, realistic particle shape has not been employed in this work. However, using fragments that are similar in shape to the original particle does not seem too improbable; for exam-ple Bowman et al. [16] analysed the change in particle shape resulting from crushing silica sand using Fourier descriptor analysis. For a processed, laboratory-grade silica sand, crush-ing resulted in only slight, statistically-insignificant changes in elongation and shape, although these were with initially angular particles, not spheres.
The particles have strengths as in McDowell and de Bono [12] for the simulations modelling silica sand; the character-istic value of octahedral shear strength, q0is 37.5 MPa for
the initial particles (d0=2 mm), the Weibull modulus, m is
3.3, and the size-hardening law is governed by Eq. (2).
3 Inter-particle bonding
The parallel bond feature of PFC3D is used to represent cementation [15,17,18]. Parallel bonds are installed between contacting particles within the oedometer as well as those within close proximity. This proximity is set so to result in an average of 5 bonds per particle. Parallel bonds, which are defined by five parameters are set equal in size to the particles—i.e. dbond =d0=2 mm. The parallel bond
nor-mal and shear stiffnesses (which are defined in terms of stress per displacement) are set equal to one another to minimise input variables. The parallel bond normal stiffness in terms of stress per displacement should be equal to the elastic mod-ulus divided by the length of the bond (which acts between the centroids of the particles and is approximately equal to 2×rball). This gives a value of approximately 15 TPa/m for bonds between balls of diameter 2 mm, assuming that cement has an elastic modulus of around 30 GPa [19]. The parallel bond strengths and strength distributions are inves-tigated later, but at first are arbitrarily given uniform values of 37.5 MPa (in both pure shear and tension)—equal to the strength (q0)of the initial particles for simplicity.
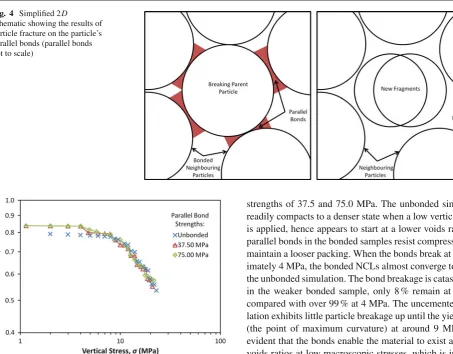
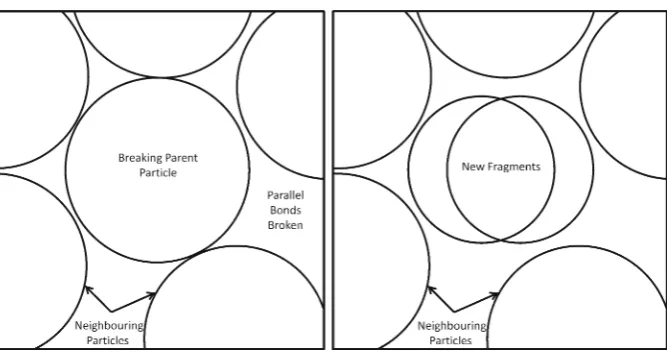
Fig. 4 Simplified 2D
[image:4.595.54.301.66.404.2]schematic showing the results of particle fracture on the particle’s parallel bonds (parallel bonds not to scale)
Fig. 5 Normal compressions lines for bonded simulations, showing
the effects of increasing the bond strength along with the unbonded material
overlaps to dissipate. In these simulations, the same approach to bond breakage is adopted: after the sample is loaded one-dimensionally, the parallel bonds are checked and if the nor-mal or shear stress at any contact exceeds the strength of the bond (if one is present), then the bond is considered broken and removed (it was found that the vast majority of bonds fail in shear rather than tension). After the bonds have been checked and allowed to break, the stresses within the par-ticles are checked to allow for any particle breakages, after which a number of computational timesteps are completed to allow the artificially induced energy to dissipate. If the octahedral shear stress q of any particle exceeds its strength, then the particle will break regardless of whether it is bonded or not. If a breaking particle happens to be bonded, when the broken particle is deleted and replaced by smaller fragments, the bonds associated with the original particle by default are also deleted (depicted in Fig.4).
Figure 5 presents the compression lines (plotted in log voids ratio–log stress space) from the unbonded simu-lation along with two bonded samples with uniform bond
strengths of 37.5 and 75.0 MPa. The unbonded simulation readily compacts to a denser state when a low vertical stress is applied, hence appears to start at a lower voids ratio; the parallel bonds in the bonded samples resist compression and maintain a looser packing. When the bonds break at approx-imately 4 MPa, the bonded NCLs almost converge to that of the unbonded simulation. The bond breakage is catastrophic: in the weaker bonded sample, only 8 % remain at 5 MPa, compared with over 99 % at 4 MPa. The uncemented simu-lation exhibits little particle breakage up until the yield point (the point of maximum curvature) at around 9 MPa. It is evident that the bonds enable the material to exist at higher voids ratios at low macroscopic stresses, which is in accor-dance with the experimental literature. However the bonded NCLs do not extend beyond the unbonded intrinsic compres-sion line and hence exhibit larger yield stresses as strongly cemented sands have been shown to [1–8], rather all three materials share a similar yield stress around 9 MPa. Increas-ing the bond strength has little effect on this. The compression lines of both bonded materials are very similar, and by a ver-tical stress of 9 MPa all three simulations have converged and are essentially at the same state, with a voids ratio of around 0.76, approximately 800 particles each and almost no par-allel bonds remaining in either of the bonded simulations. All three NCLs then follow the same path and exhibit the same slope during compression, which has been shown to be controlled by the size-hardening law of the particles [12].
Fig. 6 SEM image showing close up of a fractured particle from a
sample of sand bonded Portland cement, after compression to 50 MPa [8]
a magnified close-up of cemented sand particles after being compressed to a mean effective stress of approximately 50 MPa. The figure shows a particle which has suffered signifi-cant fracturing while still appearing to have cement bonded to it, although it is unclear from the image if the cementitious bonds to neighbouring particles are intact. The new parallel bonds are given the exact same properties as the bonds which exist before the broken particle is deleted (i.e. the same size, strength and stiffness), and this configuration is shown in Fig.7.
The compression lines of two simulations using this con-figuration are shown in Fig.8(again with bond strengths of 37.5 and 75 MPa), as well the results from the unbonded sim-ulation. Similarly to the previous simulations, the two bonded samples with durable bonds initially exhibit a higher voids ratio at low stresses, before undergoing major bond breakage and the NCLs converge with the unbonded material.
[image:5.595.309.543.53.215.2]In Fig.8, the simulations with a uniform bond strength of 37.5 MPa displays a slightly lower bond yield stress than the equivalent previous simulation, with major bond breakage
Fig. 8 Normal compression lines for simulations bonded with
‘durable’ parallel bonds, showing the effects of increasing bond strength
occurring after approximately 3 MPa. This seems somewhat surprising, as one may intuitively expect that they would exhibit bond breakage at the same stress as in the previ-ous simulations. However, comparing the two simulations with bond strengths of 37.5 MPa, the simulation with durable bonds experiences more bond breakage at very low stresses. Shortly before catastrophic bond breakage occurs (3 MPa), only 75 % of the bonds remain unbroken, compared with 99 % in the equivalent simulation with standard bonds. This increased quantity of broken parallel bonds is most likely attributable to the fragments being bonded as soon as they are created, while still overlapping by a large degree. The new fragments move quite rapidly in the direction of the minor principal axis—due to the artificial overlap—if paral-lel bonds exist between these new fragments and surrounding particles, then these bonded particles will also be subjected to this sudden excessive force, having a knock-on effect and causing additional bond breakage.
[image:5.595.204.543.542.714.2]Again, the NCLs of the bonded simulations do not extend beyond the intrinsic NCL of the uncemented simulation and
Fig. 7 Simplified 2D
Fig. 9 Final particle size distributions for the unbonded material, and
simulations with ‘standard’ and ‘durable’ parallel bonds with uniform strengths of 37.5 MPa
do not display a larger yield stress. Increasing the bond strength also has very little effect. Both bonded compression curves swiftly converge to the unbonded curve, and after an applied stress of approximately 6 MPa, all three simulations display approximately equal voids ratio and total number of particles, and the compression lines appear coincident.
Figure9shows the particle size distributions at a stress of 20 MPa from the unbonded simulation and two bonded simulations with the alternative bond breakage configura-tions. Both the simulation with ‘standard’ bonds and that with ‘durable’ bonds have almost identical particle size dis-tributions to the unbonded material at the given stress, fur-ther indicating the parallel bonds have no significant effect on the simulations of the compression of sand. Other than maintaining a looser packing in the early stages of com-pression, the bonds have little or no effect on the overall one-dimensional behaviour of the sand. It is possible that increasing the parallel bond strengths further could result in more realistic cemented normal compression lines—i.e. bonding sufficiently strong enough compared to the sand par-ticle strengths to allow the sample to reach states outside of the uncemented NCL. However, it seems somewhat unreal-istic having parallel bond strengths with magnitudes higher than the particle strengths, as cement by its nature is weaker than sand, and is known to have a very low fracture toughness [19].
Coop and Atkinson [2] suggested that bond breakage pre-cedes or coincides with particle breakage—however, as men-tioned, in the above simulations particles could break regard-less of whether they were bonded or not (and in the first case, any parallel bonds associated with breaking particles were deleted by default). There is no conclusive evidence in the literature with regards to how cementation affects parti-cle crushing, although authors such as Marri et al. [8] pro-posed that during compression, cementation reduces particle crushing. This was based on the observation that increasing
the cement content of the sand reduces the compressibility— i.e. the reduction in volume for a given vertical stress. This proposition also seems feasible if one envisages a sand par-ticle bonded by cement to other parpar-ticles—the cement will increase the contact area, which would reduce the induced tensile stress [13]. With this in mind, a final alternative con-figuration is presented with the aim of reproducing the behav-iour of cemented sand in compression, in which bond break-age must precede any particle breakbreak-age. This is achieved by simply not allowing any particle to break if there exists one or more parallel bonds attached to it (Fig.10). This approach is reasonable if one considers a particle coated in cement, or heavily bonded—for the particle to be loaded diametrically (which has been shown to give the highest octahedral shear strength) then the cementation will have to be broken first.
The results of these simulations are presented in Fig.11, which displays the compression curves of three bonded simu-lations alongside that of the uncemented simulation. All three bonded simulations display higher voids ratios in the early stages of compression, and this time they display a clearly defined yield point, at higher stresses than the unbonded sim-ulation. The yield stress appears directly proportional to the parallel bond strengths, with the most strongly bonded sam-ple (bond strengths of 75 MPa) not yet yielded at a macro-scopic applied stress of 50 MPa. The other two bonded sim-ulations, i.e. those with parallel bond strengths of 18.75 and 37.5 MPa, display catastrophic bond breakage followed by rapid convergence to the intrinsic compression line of the unbonded material. For both of these simulations, immedi-ately prior to the bond breakage (at stresses of 12 and 26 MPa, respectively) almost all the parallel bonds remain intact, and furthermore, no particles have broken. After this, nearly all bonds have broken, which is accompanied by significant par-ticle breakage. Once the bonded compression lines converge with the unbonded compression line, the simulations follow the same slope, and contain a similar number of particles at a particular voids ratio. This is representative of the behav-iour of a very brittle cemented sand, such as calcarenite [20], although calcarenites in general are much weaker and have a lower yield stress.
Figure12shows the particle size distributions from these simulations at a stress of 20 MPa, which confirms the conver-gent behaviour. The unbonded simulation and that with bond strengths of 18.75 MPa have almost identical grading curves, showing that after the bonds have broken, the latter material demonstrates the same behaviour as the unbonded material. The two simulations with higher bond strengths (37.5 and 75.0 MPa), which have not yet yielded at this stress, display no particle breakage and hence have the same grading curve as at the start of the simulations.
Fig. 10 Simplified 2D
[image:7.595.209.543.52.229.2]schematic showing how particles can only break once all contacting parallel bonds have also broken (not to scale)
Fig. 11 Normal compression lines for simulations with parallel bonds
that prevent particle fracture, showing the effects of increasing bond strength
Fig. 12 Particle size distributions at a stress of 20 MPa, for simulations
with parallel bonds that prevent particle fracture
structure-permitted space [1]—the NCLs jump at once to the unbonded compression line, and do not reproduce the gradual yielding and convergence, or parallel nature that is observed in the literature [1–8]. The post-yield compression lines for
the bonded simulations are very steep, due to the catastrophic bond breakage whereby nearly all break at once.
4 Bond-strength distributions
One-dimensional compression simulations have been per-formed utilizing various distributions of bond strengths. Using the criteria which displayed the correct qualitative compression curve (whereby bonded particles aren’t allowed to fracture), simulations with four different Weibull distrib-utions of parallel bond strength are now presented.
The Weibull distribution (as briefly mentioned above) is defined by two variables: the modulus, m; and a characteristic value of the variable that determines the scale of the distri-bution, denoted at this juncture as F0 (which is the value
of bond strength such that 37 % of bonds are stronger). The modulus determines the shape of the distribution; the para-meter F0determines the size/range. The mean of a Weibull
distribution is given by:
μ=F0Γ (1+1/m) (6)
and so is affected by both parameters;Γ is the gamma func-tion. Changing the modulus (shape) of a Weibull distribution slightly alters the mean, so the scale of the distribution needs to be adjusted to maintain the same mean. For a given scale (F0), increasing the modulus results in a narrower
distribu-tion (Fig.13). Weibull probability is already used in this work for the particle strengths (as well as previously by McDowell [21,22]), and is also used widely in materials science, espe-cially in failure probability of brittle materials, so it seems reasonable that such a distribution of may be applicable to cementation [18].
[image:7.595.52.287.461.612.2]Fig. 13 Cumulative distribution functions for various Weibull
distrib-utions, with a characteristic value F = 1, showing the influence of the Weibull modulus
Fig. 14 Normal compression lines for simulations with parallel bond
strengths with various Weibull moduli
curves shown in Fig.14. The simulation with a parallel bond strength distribution with a Weibull modulus of 0.5 has the widest distribution of strengths, and from Fig.14it can be seen that this compression line displays the earliest onset of yield, and has the most gradual convergence to the intrinsic compression line. Following the yield point, there appears
a post-yield compression line and behaviour which fits the schematics depicted previously in Fig. 1b. The simulation with the bond strength distribution with the highest Weibull modulus (m = 3.0) displays the latest and most catastrophic bond yielding, similar to both a brittle cemented sand [20] and the previous simulation in which there is a uniform bond strength of 37.5 MPa (Fig.11).
Liu and Carter [10,23] developed a framework to describe the idealised behaviour of structured soils in compres-sion. They proposed that the post-yield behaviour in one-dimensional compression could be described by:
e=e0+e−λlnσ (7)
wheree is the additional part of the voids ratio sustained by the soil structure, in this case cementation [10], although to be consistent with Eq. (1), this can be written:
log e=logey+e
− 1
2blog σ σy
(8)
A value ofe = 0 represents unstructured soil, in this case the uncemented silica sand. The additional component of voids ratio sustained by the structure is expressed as:
e=S σs,y
σ b
logσs,y (9)
where S is a soil parameter called the structure index,σs,yis
the vertical stress at which yield of the structured soil occurs andσ is the current vertical stress [23]. The value of S can be calculated if the yield stress of the structured soil and the voids ratios of both the structured and unstructured soils at that yield stress are known.
[image:8.595.52.287.260.420.2]Using this framework, the simulation with a bond strength distribution with a Weibull modulus of 0.5 has a destructur-ing index, b of approximately 5, shown in Fig. 15a. The simulation with the narrowest distribution of bond strengths (m = 3) has a destructuring index of around 50, shown in Fig. 15b. Experimental data for values of b for cemented
Fig. 15 Compression
[image:8.595.200.544.562.713.2]Fig. 16 Compression behaviour with predictions using Eq. (9) for an artificially cemented sand and a calcarenite, data from Liu and Carter [23]
sands is quite limited: Liu and Carter [23] found a value of 3 for artificially cemented silica sand [24], and a value of 35 for a calcarenite [20]; shown in Fig.16.
It is clear that the parameter b, i.e. the rate at which destructing occurs, is representative of the brittleness of the structured material. Higher values indicate very brittle cementation, while lower values are typical of more duc-tile cementation. For the simulations, it is the distribution of bond strengths that control the destructuring index, leading to the assumption that brittle cemented sands such as nat-urally occurring cemented carbonate sands have a narrow distribution of bond strengths. On the other hand, ductile cemented sands, for instance those bonded with materials such as Portland cement would appear to have a much wider distribution of bond strengths. This fits with observations from Haeri et al. [25] who concluded that of Gypsum, lime and Portland cement; the latter was the most ductile cement-ing agent.
[image:9.595.52.287.52.206.2]In these simulations, the parallel bonds by their nature have a significant influence on particle crushing, and as a result noticeably affect the compression of the material. While intact, the parallel bonds prevent bonded particles from breaking, thereby resisting significant reductions in volume. The simulation which displays the most gradual convergence to the intrinsic compression line, i.e. the simulation which requires the largest increase in stress from yielding to con-vergence, is the simulation with the widest distribution of bond strengths. This simulation, with a parallel bond dis-tribution Weibull modulus of 0.5 has some parallel bonds with significantly higher strengths than the other simulations (although the mean strength is the same). This means there are still intact parallel bonds reducing particle crushing at high macroscopic stresses, which help to sustain an addi-tional voids ratio. Figure17shows the percentage of parallel bonds remaining unbroken versus applied stress, which con-firms the influence bonds have on the compression behav-iour. The simulation with m = 0.5 exhibits a steady decline
Fig. 17 Percentage of intact parallel bonds remaining as a function of
vertical applied stress
Fig. 18 Images of cemented samples at approximately 20 MPa vertical
pressure. Sample with parallel bonds with a Weibull modulus of 0.5 (a), and 3.0 (b)
in the number of intact bonds from first loading, with 6 % of the parallel bonds remaining unbroken at termination. The corresponding simulation, with m = 3.0 displays very sud-den, catastrophic bond breakage after which no bonds remain intact, which corresponds to the sudden yielding and conver-gence with the intrinsic compression line shown in Figs.14 and 15b. It is clear that it is the strength of the strongest bonds that most influence the behaviour. These observations certainly suggest that cementation (or at least the parallel bonds in the simulations) reduce particle crushing, which in turn reduces the compressibility, in line with the speculation by Marri et al. [8].
[image:9.595.308.542.254.445.2]Fig. 19 Final grading curves for the simulations with bond strengths
with Weibull distributions with various moduli
shows the sample with a bond-strength Weibull modulus of 3.0, at the same stress—shortly before major yielding occurs. Almost all the bonds remain intact, and no particles have broken.
The final particle size distributions are given in Fig.19for the simulations with various Weibull distributions of bond strengths. These are obtained at a vertical stress of 23 MPa (the highest stress all simulations reached), at which point the compression curves have essentially converged. Although the particle size distributions appear similar, the two simula-tions with a portion of bonds remaining unbroken (m = 0.5 and 1) have experienced less crushing and demonstrate less-developed grading curves.
5 Cement content
The literature showing the effects of increasing cement con-tent on the behaviour of cemented sand in compression is relatively limited, especially with regards to artificially cemented silica sand. For example, Bobet et al. [5] performed one-dimensional compression tests investigating the effects of increasing quantities of Portland cement using an organic soil (with a loss on ignition of approximately 50 %); Cuc-covillo and Coop [3] meanwhile compared the behaviour of weak and strong naturally cemented carbonate soils.
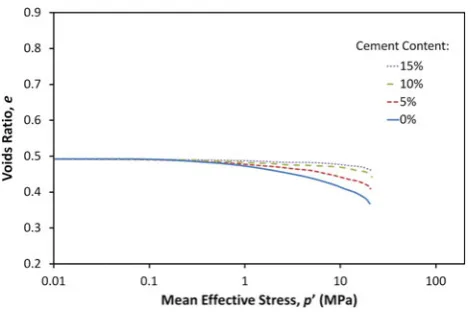
[image:10.595.53.287.54.206.2]The effects of increasing the quantity of Portland cement for a cemented silica sand are shown in Fig.20from Marri et al. [8]. As with Fig. 2, Fig. 20 shows that the addi-tion of cement appears to cause the compression curve to extend beyond the intrinsic curve of the uncemented mater-ial, increasing the yield stress. The graph shows that increas-ing the content of cement reduces the compressibility, i.e. the reduction in volume for a given applied stress, however the applied stresses are not large enough to determine the true nature of the cemented NCLs. As mentioned, there is some discrepancy between the observed effects during compres-sion of increasing the degree of cementation: some authors
Fig. 20 Effect of Portland cement content on the isotropic compression
of silica sand, data from Marri et al. [8]
speculating parallel normal compression lines, and others suggesting NCLs unique for each cement content, possibly converging to the intrinsic compression line. It is generally accepted however that the degree of cementation, or at least the strength of the cementation, increases the yield stress and the extent at which the cemented compression curves extends in to the structure-permitted space.
Fig. 21 Images of cemented
sand prepared with 5 % (a) and 15 % (b) cement content, from Marri et al. [8]
Fig. 22 Compression curves for simulations with increasing number
of parallel bonds
as 9 particle visibly bonded to it, and bearing in mind the planar nature of the image one may expect an even greater number.
[image:11.595.50.296.63.402.2]It is visible from Fig.22that increasing the quantity of bonds, measured in these simulations by the average num-ber of parallel bonds per particle, magnifies the effects of cementation—resulting in an increase in yield stress with increasing number of bonds. The simulations representing cemented sand converge towards the intrinsic NCL, with increasing the quantity of bonds causing the post-yield com-pression line (which begins at the yield point) to become steeper. This agrees with the framework described by Cuc-covillo and Coop [3] and shown in Fig.1b. The compres-sion curves also appear to be in harmony with those from Marri et al. [8] shown in Fig.20, although the curves of the cemented material in the latter figure haven’t fully yielded, and don’t reach stresses high enough to determine whether they converge or run parallel. Considering just the pre-yield compression curves of the simulations in Fig.22(i.e. up to a stress of approximately 12 MPa), equating the number of bonds to cement content reveals the same pattern of behav-iour as the experimental results in Fig.20.
Fig. 23 Particle size distributions for simulations with increasing
num-ber of parallel bonds, at an applied stress of 20 MPa
Marri et al. [8] also suggested that particle crushing reduces with increasing degree of cementation, due to the associated reduction in compressibility. This makes sense when one considers that the reduction in volume experienced in compression is facilitated by the crushing of particles. This is confirmed in the simulations by comparing the particle size distributions at a given stress—Fig.23compares the grading curves for the simulations with various degrees of bonding at an applied stress of 20 MPa. As can be seen, the two most heavily cemented simulations (those with an average of 15 and 20 parallel bonds per particle) have the least developed grading curve, and so have experienced the least amount of crushing. These two simulations also display the largest cur-rent volume. The unbonded simulation displays the greatest degree of crushing in Fig.23, followed by the simulations with an average of 5 and 10 parallel bonds per particle. These simulations underwent the largest decrease in volume.
6 Conclusions
be replicated using DEM. The cementation has been mod-elled with parallel bonds, and it has been shown that if the bonds are configured so to prevent particle breakage, the correct transition is witnessed in the compression curves— the cemented simulations extending into structure-permitted space and displaying stronger yield stresses. Although the influence of certain bond parameters such as size and stiff-ness have not been investigated in this paper, the distribution of bond strengths has been shown to control the post-yield compression line.
A narrow bond strength distribution results in a sudden and catastrophic failure of bonds, i.e. brittle yielding whereby the post-yield compression line converges immediately to the intrinsic NCL. A much wider bond strength distribution pro-duces a less rapid onset of yield, and more gradual conver-gence to the intrinsic compression line. A distribution with a low modulus such as 0.5 gave the most realistic behav-iour with regards to modelling a strongly cemented sand, and analysing the simulations using Liu and Carter’s [10,23] framework for the compression of structured soils, the value of the destructuring index, b appeared to be in the correct range. The destructing indices obtained from the simulations appeared to be a function of the bond strength distribution.
The simulation with the widest distribution of parallel bond strengths still had some of the strongest bonds remain-ing at high pressures (>20 MPa). The presence of bond-ing within the material was shown to reduce the compress-ibility and also the degree of particle crushing for a given applied stress, which confirms speculation from Marri et al. [8]. The Weibull modulus for the distribution of parallel bond strengths has been shown to control the post-yield compres-sion line and appears to have a direct influence on the destruc-turing index.
Increasing the quantity of bonds appears to be the most effective way of modelling increasing cement content in one-dimensional normal compression. Increasing the quantity of bonds magnifies the effects of cementation, i.e. it increases the yield stress, renders the sample more brittle and reduces the degree of particle crushing for a given applied macro-scopic stress. Therefore it appears that increasing the degree of cementation suppresses particle crushing.
This paper has therefore shown that it is possible to cap-ture, using DEM, the essential features of the mechanical behaviour of cemented sand under one-dimensional normal compression.
References
1. Leroueil, S., Vaughan, P.: The general and congruent effects of structure in natural soils and weak rocks. Geotechnique 40(3), 467– 488 (1990)
2. Coop, M.R., Atkinson, J.H.: The mechanics of cemented carbonate sands. Geotechnique 43(1), 53–67 (1993)
3. Cuccovillo, T., Coop, M.R.: On the mechanics of structured sands. Géotechnique 49(6), 741–760 (1999)
4. Airey, D.W.: Triaxial testing of naturally cemented carbonate soil. J. Geotech. Eng. 119(9), 1379–1398 (1993)
5. Bobet, A., Hwang, J., Johnston, C.T., Santagata, M.: One-dimensional consolidation behavior of cement-treated organic soil. Can. Geotech. J. 48(7), 1100–1115 (2011)
6. dos Santos Silva, A.P., Consoli, N.C., Heineck, K.S., Coop, M.R.: High-pressure isotropic compression tests on fiber-reinforced cemented sand. J. Geotech. Geoenviron. Eng. 136(6), 885–890 (2009)
7. Rotta, G.V., Consoli, N.C., Prietto, P.D.M., Coop, M.R., Graham, J.: Isotropic yielding in an artificially cemented soil cured under stress. Geotechnique 53(5), 493–501 (2003)
8. Marri, A., Wanatowski, D., Yu, H.S.: Drained behaviour of cemented sand in high pressure triaxial compression tests. Geomech. Geoeng. 7(3), 159–174 (2012)
9. Coop, M.R.: The mechanics of uncemented carbonate sands. Geotechnique 40(4), 607–626 (1990)
10. Liu, M.D., Carter, J.P.: Virgin compression of structured soils. Géotechnique 49(1), 43–57 (1990)
11. Jaky, J.: Pressure in silos. In: Proceedings of the 2nd International Conference on Soil Mechanics and Foundation Engineering, 1, pp. 103–107 (1948)
12. McDowell, G., de Bono, J.P.: On the micro mechanics of one-dimensional normal compression. Géotechnique 63 (2013), 895– 908
13. Jaeger, J.C.: Failure of rocks under tensile conditions. Int. J. Rock Mech. Min. Sci. 4(2), 219–227 (1967)
14. Russell, A.R., Muir Wood, D., Kikumoto, M.: Crushing of particles in idealised granular assemblies. J. Mech. Phys. Solids 57(8), 1293– 1313 (2009)
15. Itasca: Theory and Background, PFC-3D version 3.1. Itasca Con-sulting Group Inc., Minneapolis, MN (2005)
16. Bowman, E.T., Soga, K., Drummond, W.: Particle shape charac-terisation using Fourier descriptor analysis. Geotechnique 51(6), 545–554 (2001)
17. Potyondy, D.O., Cundall, P.A.: A bonded-particle model for rock. Int. J. Rock Mech. Min. Sci. 41(8), 1329–1364 (2004)
18. de Bono, J.P., McDowell, G.R., Wanatowski, D.: Modelling cemented sand using DEM. In: Proceedings of 2nd International Conference on Transportation Geotechnics (ICTG) (2012) 19. Ashby, M.F., Jones, D.R.H.: Engineering Materials. Pergamon
Press, New York (1986)
20. Lagioia, R., Nova, R.: An experimental and theoretical study of the behaviour of a calcarenite in triaxial compression. Géotechnique
45(4), 633–648 (1995)
21. McDowell, G.R., Amon, A.: The application of Weibull statistics to the fracture of soil particles. Soils Found. 40(5), 133–141 (2000) 22. McDowell, G.R.: Statistics of soil particle strength. Géotechnique
51(10), 897–900 (2001)
23. Liu, M.D., Carter, J.P.: Modelling the destructuring of soils during virgin compression. Geotechnique 50(4), 479–483 (2000) 24. Maccarini, M.: Laboratory studies for a weakly bonded artificial
soil. Imperial College London (University of London), Doctoral dissertation (1987)
![Fig. 6 SEM image showing close up of a fractured particle from asample of sand bonded Portland cement, after compression to 50 MPa[8]](https://thumb-us.123doks.com/thumbv2/123dok_us/8688612.379454/5.595.51.287.53.204/showing-fractured-particle-asample-bonded-portland-cement-compression.webp)


![Fig. 16 Compression behaviour with predictions using Eq. (artificially cemented sand and a calcarenite, data from Liu and Carter[9) for an23]](https://thumb-us.123doks.com/thumbv2/123dok_us/8688612.379454/9.595.308.542.254.445/compression-behaviour-predictions-using-articially-cemented-calcarenite-carter.webp)