Urban Vulnerabilities in the Kathmandu Valley, Nepal: Visualizations of Human/Hazard Interactions
Full text
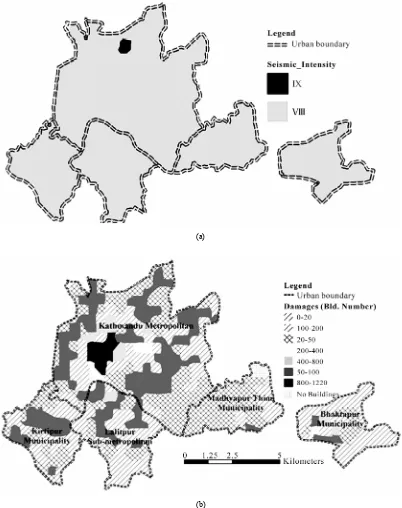
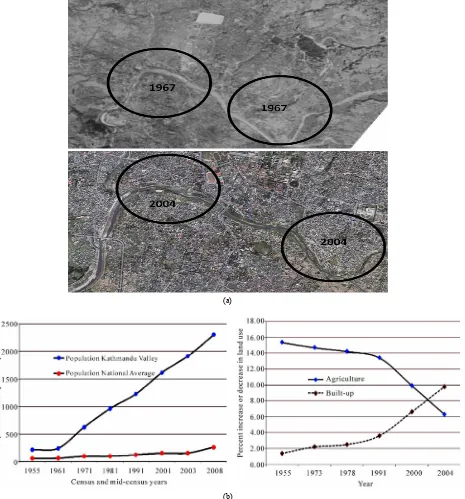
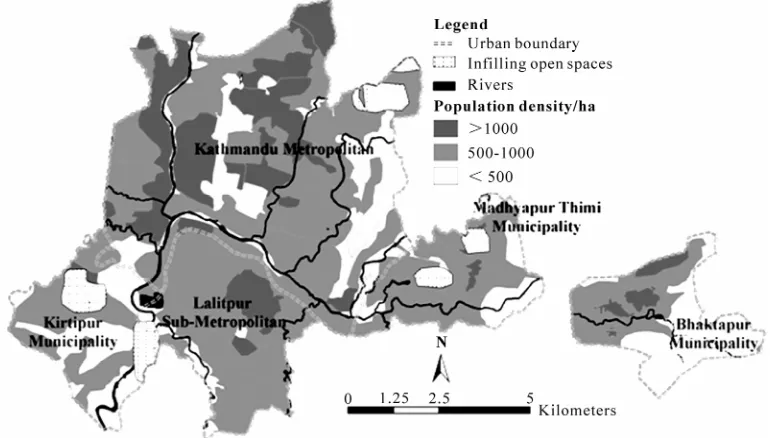
Figure


![Figure 11. Plot size and cost of land (Modified from Adhi-kari [56] including land prices of obtained from the Land Reform Office, Kathmandu)](https://thumb-us.123doks.com/thumbv2/123dok_us/8926629.391439/12.595.57.286.60.232/figure-modified-including-prices-obtained-reform-office-kathmandu.webp)
![Figure 12. (a) Locations of squatter settlements along the low level river banks (Pradhan & Perera) [52]; and (b)](https://thumb-us.123doks.com/thumbv2/123dok_us/8926629.391439/13.595.57.287.75.519/figure-locations-squatter-settlements-level-river-pradhan-perera.webp)
Related documents
KLEPPE ET AL.: RAMAN SPECTROSCOPIC STUDIES OF WADSLEYITE II 1107 whereas OH modes at lower frequencies decrease with increasing pressure; the lower the ambient OH stretching
For the broad samples of men and women in East and West Germany every first graph in Fig- ure 1 to 4 (Appendix) shows considerable and well-determined locking-in effects during the
Focusing on the remarkable co- incidence between the withdrawal of the state, the rise of religious movements, and the dramatic expansion of the informal economy, this paper
Since Annex I and non-Annex I countries differ in a number of characteristics, the effect of having been selected as an Annex I country (average treatment effect on the treated)
To produce the confidence intervals for their structural impulse response functions (IRFs), Mertens and Ravn (2013) (MR throughout the paper) use a recursive-design wild bootstrap
Population-based cut-off values for body fat determined by body composition reference methods are theoretically the best criterion for the definition of
funding for 2015 constitutes a median of 1.4 percent of the surveyed employers’ budgeted operating expenses for the year, the largest median proportion of total operating
Selected molecular ion [M ⫺ H] ⫺ images of specific lipids and fatty acids from analysis of a 3.8 ⫻ 3.5 mm area of rat spinal cord cross section in the negative ion mode.. (j)
