Body Fluid Changes, Cardiovascular Deconditioning and
Metabolic Impairment Are Reversed 24 Hours after a
5-Day Dry Immersion
Mickael Coupé1,2, Elena Tomilovskaya3, Françoise Larcher4, Bertrand Diquet5,
Liudmila Kh. Pastushkova2,3, Inesa B. Kozlovskaya3, Irina M. Larina2,3, Guillemette Gauquelin-Koch6, Vladimir A. Kulchitsky7, Marc-Antoine Custaud1,2, Nastassia M. Navasiolava1,2
1CNRS UMR 6214, INSERM U1083, Angers University, Angers, France 2Associated French-Russian Laboratory CaDyWEC, Angers, France & Moscow, Russia
3Institute of Biomedical Problems RAS SSC, Moscow, Russia 4Biochemistry Laboratory, Angers University Hospital, Angers, France 5Pharmacokinetics Laboratory, Angers University Hospital, Angers, France
6French Space Agency (CNES), Paris, France
7Institute of Physiology, National Academy of Sciences, Minsk, Belarus
Email: nastassia.navasiolava@etud.univ-angers.fr
Received December 31, 2012; revised February 5, 2013; accepted March 8, 2013
ABSTRACT
Dry immersion is an effective and useful model for research in physiology and physiopathology. The focus of this study was to provide integrative insight into renal, endocrine, circulatory, autonomic and metabolic effects of dry immersion. We assessed if the principal changes were restored within 24 h of recovery, and determined which changes were mainly associated with immersion-induced orthostatic intolerance. Five-day dry immersion without countermeasures, and with
ad libitum water intake, standardized diet and a permitted short daily rise was performed in a relatively large sample for this experiment type (14 healthy young men). Reduction of total body water derived mostly from extracellular com- partment, and stabilized rapidly at the new operating point. Decrease in plasma volume was estimated at 20% - 25%. Five-day immersion was sufficient to impair metabolism with a decrease in glucose tolerance and hypercholesterolemia, but was not associated with pronounced autonomic changes. Five-day immersion induced marked cardiovascular im- pairment. Immediately after immersion, over half of the subjects were unable to accomplish the 20-min 70˚ tilt; during tilt, heart rate and total peripheral resistance were increased, and stroke volume was decreased. However, 24 hours of normal physical activity appeared sufficient to reverse orthostatic tolerance and all signs of cardiovascular impairment, and to restitute plasma volume and extracellular fluid volume. Similarly, metabolic impairment was restored. In our study, the major factor responsible for orthostatic intolerance appeared to be hypovolemia. The absence of pronounced autonomic dysfunction might be explained by relatively short duration of dry immersion and daily short-time orthostatic stimulation.
Keywords: Physical Inactivity; Modeled Weightlessness; Water-Electrolyte Balance; Body Fluid Compartments; Orthostatic Intolerance
1. Introduction
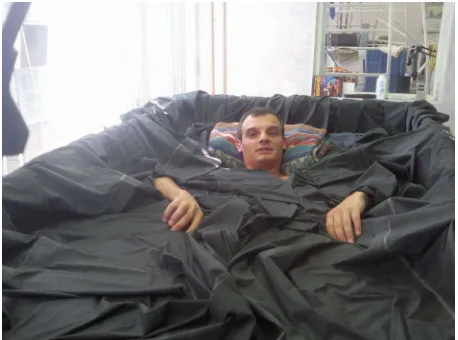
Water immersion has been demonstrated as an efficient and useful model for renal, neuro-hormonal and body fluid physiology [1-3]. Since antiquity, it is known that immersion induces diuresis, indeed the Latin word “uri- nator” means wisely “diver”. However, the water immer- sion method is generally limited to several hours because of skin maceration. This method has been modified to separate the subject from water using elastic tissue (dry immersion, DI), which allows for longer immersion pe-
riods and increased comfort for the subjects [4] (Figure 1). Using longer duration, it becomes possible to study the effects of a new body fluid steady state on major bodily functions.
Figure 1. Dry immersion method. The subject is separated from water with waterproof tissue.
valuable model for physical inactivity [5], due to acute limitation of voluntary muscular activity, reduction of gravitational stress on muscles, and deep atonia [4].
The DI model was first developed by Russian physi- cians and scientists to mimic the space environment. This method, however, might be directly useful in some common disease. DI appeared effective in treatment of refractory edema of different etiologies (cardiovascular diseases, renal pathologies, liver cirrhosis, and burns). In patients with edema, the 1.5 - 3 fold increase in diuresis observed after 4 - 6 hours of DI persisted for 2 days [6, 7]. In patients with treatment-resistant hypertensive crisis, 1.5 hours of DI induced a rapid and prolonged blood pressure reduction and sedation [8]. Together this indi- cates the interest of DI model for physiology and phy- siopathology studies.
In DI studies, the volunteers’ number rarely exceeds 6 - 8 subjects. We had the unique opportunity to study the effects of DI in a relatively large population (n = 14) for this specific protocol. Our first aim was to provide a comprehensive analysis of body fluid, autonomic, car- diovascular and metabolic changes induced by a 5-day DI. We further examined whether the 24-hour recovery period was sufficient to restore the principal changes induced by DI. Finally, we determined the main changes associated with orthostatic intolerance induced by DI.
2. Methods
2.1. Subjects
The study included a group of 14 healthy non-smoking Russian men (age 22 ± 1 y, height 174 ± 1 cm, weight 67.9 ± 1.5 kg; mean ± SE). All volunteers provided writ- ten informed consent, in compliance with the Helsinki Declaration. The experimental protocol was approved by the Committee of Biomedicine Ethics of the Russian Academy of Sciences. The subjects were randomly di-
vided into 2 groups (group R0, n = 7, and group R+1, n = 7), according to the day of orthostatic test in the recov- ery period.
2.2. General Protocol
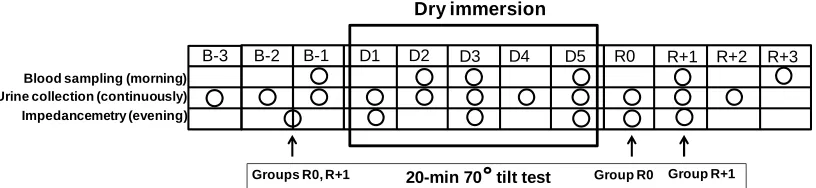
The protocol used in this study is schematized in Figure 2. DI was performed for 5 days (120 hours) at the Dry Immersion Facility of the Institute of Biomedical Prob- lems (Moscow, Russia). For baseline and recovery measurements and sampling, ambulatory periods of 3 and 4 days preceded and followed DI, respectively (B-3 to B-1, and R0 to R+3). The subjects were immersed one after another. Thermoneutral water temperature (32˚ - 33.5˚) was continuously maintained; air temperature was maintained at 24˚C - 25˚C, and air humidity was 40% - 50%.
The present study was one of 16 studies conducted during this DI protocol. Some experiments required ex- traction from bath; in this case, the subjects remained supine on a lifting platform. Total out-of-bath supine time for the 120 h of immersion was 4.11 ± 0.15 h (mean ± SE). In addition, once a day (in the evening) the sub- jects were allowed to leave the bath for personal hygiene procedures (defecation and shower in a sitting position) and weighing (in a standing position). Total out-of-bath sitting/standing time for the 120 hours of immersion was 1.43 ± 0.07 h (mean ± SE). Otherwise, the subjects re- mained in a supine position during DI for all activities and were continuously observed by video monitoring. Blood pressure and heart rate (using a sphygmoma- nometer) were measured daily at 8 a.m. The onset and end of the immersion were both at 10 a.m., so morning measurements on day 1 were performed before immer- sion, and on day R0—still under immersion. Before, dur- ing and after DI, water intake was ad libitum (measured), and diet was standardized. Daily caloric intake was ~2880 ± 60 kcal. Dietary sodium was set to 2.8 mmol/kg/ day, calcium—to ~1100 mg/day, and protein intake to 1.15 g/kg/day.
2.3. Bio-Impedance Measurements
B-2 B-1 D1 D2 D3 D4 D5 R0 R+1 R+2 R+3
Blood sampling (morning) Urine collection (continuously) Impedancemetry (evening)
20-min 70 tilt test
Groups R0, R+1 Group R0 Group R+1
Dry immersion
[image:3.595.95.503.87.181.2]B-3
Figure 2. Schematic outlining of the experimental protocol. B-3, B-2 and B-1, baseline days prior to immersion; D1-D5, days of dry immersion; R0 - R+3, recovery days; circles, days of sampling or measurement; arrows, days of tilt-test.
abducted from the body and legs were separated. Four gum-based electrodes measuring 5 cm2 were used: two current injection electrodes on the hand and foot on the dorsal surfaces proximal to the metacarpal-phalangeal and metatarsal-phalangeal joints, respectively, and two voltage detector electrodes on the mid-line between the prominent ends of the radius and ulna of the wrist and mid-line between the medial and lateral malleoli of the ankle.
Both before and after immersion, the subjects were weighed prior to measurements. During immersion, body weight data from the evening of the previous day were used for calculations.
2.4. Tilt Test
The head-up tilt test was performed in a quiet room with an ambient air temperature of 24˚C - 25˚C, in the morn- ing, before immersion (day B-2 or B-1) and immediately after completing the 5-day DI (first rising, group R0) or on the second day of recovery (group R+1). The subject was placed on a tilt-table in a supine position, and al- lowed to rest for at least 30 min; the data were then re- corded from this resting supine position for 10 minutes. Afterwards, the subject was tilted 70˚ head-up. Subjects were instructed to stand with feet shoulder-width apart, keeping as still as possible to avoid muscle pump activity. Subjects remained in the 70˚ head-up tilt (HUT) position with continuous monitoring for 20 min, until presyncope, or until the subject’s request to stop.
Standard ECG was recorded continuously, and beat-to- beat R-R intervals and heart rate (HR) were extracted from the signal. Blood pressure was measured continu- ously on the third finger using a non-invasive finger cuff device (Finapres, Ohmeda, Englewood, Colorado). The finger cuff was maintained at heart level in both supine and standing positions. Additionally, arm blood pressure was measured by Dinamap (Carescape V100, GE Health- care, Finland) at baseline, and at 5th, 10th and 15th min- utes of the HUT. Skin blood flow at the calf level was estimated using Laser-Doppler flowmetry as previously described [9]. Calf skin temperature was controlled by monitoring using a thermocouple connected to an elec-
tronic thermometer (BAT-12, Physitemp Instruments, Clifton, New Jersey).
The stable 5 min of data for each period (basal and end tilt) were averaged and used for analysis. In case of or- thostatic intolerance, the 5 minutes prior to intolerance were chosen for analysis [10]. For the single subject who developed orthostatic intolerance at the third minute of tilt, the 2 min mark prior to intolerance was analyzed. Cardiac output (CO), stroke volume (SV), and total pe- ripheral resistance (TPR) were estimated by an analysis of blood pressure waveform.
Analysis of orthostatic responses, power spectrum analysis of heart rate variability, and analysis of the spontaneous baroreflex sensitivity was performed as pre- viously described [10]. Skin vascular resistance (SVR) was calculated by dividing mean blood pressure by skin blood flow. In the tilted position, heart-Laser-Doppler probe distance (hydrostatic component of blood pressure) was taken into account to correct blood pressure at the probe level and calculate SVR.
2.5. Sample Collection and Analyses
2.5.1. Blood Sampling and Estimation of Plasma Volume Dynamics
Blood sampling was performed with participants in the supine position in the morning before breakfast on base- line (B-1), day 2, day 3, day 5, and the second and fourth recovery days (R+1 and R+3).
Fasting glucose (using Accu Check Performa glu- cometer), hemoglobin (using HemoCue hemoglobin analyzer) and hematocrit (using microhematocrit method) were determined immediately after blood collection. Percentage changes in plasma volume were calculated indirectly using:
Hb and Hct count (Dill and Costill formula): DPV (%) = 100 × [HbB (1 − 0.01Hcti)]/
[Hbi (1 − 0.01HctB)] − 100;
Only Hct count (van Beaumont formula): DPV (%) = [100/(100 − HctB)] ×
[100 × (HctB − Hcti)/Hcti)]
DPV (%) = 100 × [Prot B/Prot i] − 100;
where HctB, HbB and Prot B are hematocrit, hemoglobin and proteins concentrations at baseline, respectively, and Hcti, Hbi and Prot i are the corresponding values on day 2, day 3, day 5 and R+1.
Plasma and serum samples were analyzed for renin, aldosterone, brain natriuretic peptide (BNP), electrolytes (Na+, K+, Cl−, Ca2+), osmolality, proteins, urea and creatinine concentrations, high-sensitivity CRP, insulin, leptin, triglycerides, total cholesterol, and HDL-choles- terol. LDL-cholesterol was calculated using the Friede- wald formula. Homeostasis model assessment-insulin resistance index (HOMA-IR) was calculated as fasting insulin concentration (μU/ml) × fasting glucose concen- tration (mmol/L)/22.5.
2.5.2. Urine Sampling
Urine pools were collected over 24 hours for 3 days prior to immersion (B-3, B-2 and B-1), 5 days of immersion (day 1-day 5) and 3 recovery days (R0, R+1 and R+2). Urine volume was measured and the aliquots were stored at −80˚C. The partial water balance, defined as the dif- ference between consumed water (including drinking water, tea, juice, soup) and urine volume, was calculated. Urine samples were analyzed for electrolytes (Na+, K+, Cl−), osmolality, creatinine, urea and urinary free cortisol
(UFC), urinary catecholamines (epinephrine, norepine- phrine, metanephrine, normetanephrine, dopamine). Crea- tinine, free water and osmolal clearances were calculated for days B-2, day 1, day 2, day 4, R0 and R+2 using the 24-h urine samples from these days and the morning blood samples from the next days (i.e. B-1, day 2, day 3, day 5, R+1, R+3).
2.5.3. Biochemical Analyses
Active renin analysis was performed using a chemilumi- nescence immunoassay on the Liaison analyzer (Di- aSorin). BNP was measured using a chemiluminescence immunoassay on the “Architect i2000” analyser (Abbott). Plasma aldosterone was determined by a competition radioimmunoassay using a commercially available RIA kit (Immunotech, Beckman Coulter). Urinary free corti- sol was detected by liquid chromatography-tandem mass spectrometry (LC-MS/MS) with an Applied Biosys- tems/MDS Sciex Api 3000 triple quad mass spectrometer equipped with turbolon spray source. Plasma and urine osmolality were measured by freezing-point depression in comparison to pure water. Urinary catecholamines were determined by high-pressure liquid chromatogra- phy.
All the other variables from blood and urine samples were evaluated using the Architect c16000 automated clinical chemistry analyzer (Abbot).
Minimal detectable level for plasma aldosterone and
BNP was 10 ng/L, for serum hs-CRP −0.1 mg/L, for uri- nary epinephrine −2 µg/L, and for urinary metanephrine
−0.1 µg/L. Results that were less than the minimal de- tectable level were taken for half minimal value.
2.6. Data Analysis
All values are presented as mean ± SE. The effects of DI were tested with ANOVA for repeated measures. Statis- tically significant differences were further analyzed by post-hoc pairwise comparisons (Least Significant Dif- ference). Differences were considered to be statistically significant at p < 0.05. Analyses were performed using SPSS 15.0 for Windows.
3. Results
3.1. General Data
Overall, the five-day DI was well tolerated by the study group; all the subjects, however, had a moderate back- ache at the beginning, which disappeared by the third to fourth day of immersion.
3.2. Body Fluids and Kidney Regulation
3.2.1. Body Fluids
Plasma volume changes determined by Hb and Hct count, and by Hct count alone, were similar. Plasma volume decreased by 17% - 18% within the first 24 hours of immersion, and remained at reduced level until the end of immersion. Plasma protein count also revealed plas- ma volume reduction under immersion, but less pro- nounced, at approximately 7% - 8%. On the second re- covery day, plasma volume as determined by all 3 meth- ods did not differ from baseline (Figure 3). Water intake
varied throughout the experiment without significance.
Daily diuresis was increased by approximately 90% on day 1, and remained elevated throughout the immersion.
Partial water balance at day 1 was approximately 1 L less than at baseline, and remained negative throughout the immersion. On the first recovery day, we observed a compensatory decrease in diuresis and increase in water balance (Table 1). Free water clearance did not signifi- cantly change throughout the protocol. Osmolal clear- ance was decreased during immersion (significantly on day 4; p = 0.09 on day 1 and day 2) (Table S1). The dy-namics of fluid compartments are shown in Figure 4.
-30 -25 -20 -15 -10 -5 0 5 10
B D2 D3 D5 R+1
Hb & Hct
[image:5.595.84.262.86.245.2]Hct Plasma proteins
*
*
*
*
*
*
% o f b a s e li n e*
*
*
Figure 3. Variations in plasma volume in percentage of baseline, calculated indirectly by hemoglobin and hema-tocrit count (Hb and Hct), hemahema-tocrit count alone (Hct), and plasma proteins count. B: baseline; D: dry immersion; R: recovery. Values are means ± SE; *p < 0.05 vs baseline.
* * * * -10 -8 -6 -4 -2 0 2 4
Total fluid (%)
% of ba sel in e -10 -8 -6 -4 -2 0 2 4
Extracellular fluid (
% o f bas e li ne %) -10 -8 -6 -4 -2 0 2 4
D1 D3 D5
Intracellular fluid (
%
of
basel
in
e
D1 D3 D5 R D1 D3 D5 R
D1 D3 D5 R
R0 R+1
%)
0 R+1 0 R+1
0 R+1 Total Body Water
Intracellular Fluid Extracellular Fluid
*
Dry immersion
*
Figure 4. Variations of fluid compartments. D: dry immer-sion; R: recovery. Values are means ± SE; *p < 0.05 vs
base-line.
differ from baseline levels. Intracellular fluid showed non-significant variations during DI and was decreased by approximately 3% at R+1.
3.2.2. Blood and Urine Biochemistry
Blood levels of Na+, K+, Cl−, Ca2+, proteins, urea,
creatinine and osmolality remained within normal values at all measurements. DI was accompanied by a signifi- cant increase in blood K+, Ca2+ and protein content. Blood urea was slightly decreased at the beginning of DI, and slightly increased 24 hours after the end of DI (Ta- ble 2).
Urinary sodium loss increased at the beginning of DI (with a two-fold increase on day 1), followed by decrease in recovery (with a 3-fold decrease on R0). The dynam- ics of urinary Cl− excretion showed similar trends. Uri-
nary potassium excretion was not significantly changed. The urinary Na+/K+ ratio increased significantly only on day 1 and did not differ from the baseline during the rest of immersion. The end of immersion was accompanied by a decrease in the Na+/K+ ratio (Table 1).
Urinary osmolality was reduced during immersion, with a significant reduction on day 3, and tendency to reduction—with p = 0.07 to 0.09—on days 1, 2 and 4, with no significant difference compared to baseline in recovery (Table 1). Urinary urea and urinary creatinine did not change significantly (Table 1). Urea clearance increased on day 1 and decreased on R0. Creatinine clearance did not change throughout the DI (Table S1).
3.3. Cardiovascular System at Rest
3.3.1. Morning Heart Rate and Blood Pressure
Heart rate and blood pressure remained within normal limits. Heart rate was slightly reduced at the beginning of DI, and systolic blood pressure was slightly lower at the end of DI (Table S2).
3.3.2. Cardiovascular Hormones Regulating Volemia
Twenty-four hours after the onset of DI, plasma renin decreased two-fold and plasma BNP increased four- fold. Plasma aldosterone was not significantly changed. Twenty-four hours after the end of DI, we observed a two-fold increase in renin and 3-fold increase in aldos- terone. On the fourth recovery day, renin and aldosterone were not modified, and BNP was significantly increased (Figure 5).
3.4. Cardiovascular Variables during Tilt Test
3.4.1. Tolerance
Before DI, only one subject (assigned to group R0) out of 14 was unable to complete the 20-min HUT. After DI, on day R0, 4 out of 7 subjects were non-finishers. On day R+1, all subjects finished the test.
3.4.2. Hemodynamic Responses to Tilt Test: Supine and Upright Position
[image:5.595.81.261.320.610.2]Table 1. Urine biochemistry, diuresis, water intake and partial water balance before, during and following dry immersion.
B-3 B-2 B-1 DI 1 DI 2 DI 3 DI 4 DI 5 R0 R+1 R+2 K+, mmol/24h 35 ± 6 35 ± 5 39 ± 6 40 ± 2 41 ± 4 45 ± 6 47 ± 5 55 ± 6 38 ± 4 42 ± 3 51 ± 4 Na+, mmol/24h 132 ± 12 120 ± 15 123 ± 21 211 ± 17* 163 ± 17* 131 ± 13 137 ± 15 157 ± 14 46 ± 4* 70 ± 8 113 ± 19 Na+/K+ ratio 3.8 ± 0.4 3.8 ± 0.4 3.4 ± 0.6 5.6 ± 0.7* 4.0 ± 0.3 3.2 ± 0.3 3.0 ± 0.2 3.0 ± 0.2 1.5 ± 0.2* 1.8 ± 0.3* 2.1 ± 0.3 Cl−, mmol/24h 132 ± 13 108 ± 13 121 ± 21 181 ± 13* 160 ± 18* 128 ± 12 130 ± 15 147 ± 14 54 ± 4* 61 ± 7* 111 ± 17
Creatinine,
mmol/24h 9.1 ± 1.2 8.7 ± 1.0 8.9 ± 1.4 9.1 ± 0.6 9.3 ± 1.0 9.5 ± 1.2 8.5 ± 0.8 10.8 ± 1.2 7.4 ± 0.7 7.8 ± 0.6 8.2 ± 0.9 Urea, mmol/24h 209 ± 25 208 ± 29 203 ± 30 231 ± 20 205 ± 23 231 ± 24 223 ± 18 275 ± 21 171 ± 20 210 ± 13 252 ± 30
Osmolality,
mOS/kg 496 ± 56 497 ± 42 487 ± 56 360 ± 27 375 ± 22 348 ± 40
* 377 ± 40 386 ± 52 534 ± 43 502 ± 59 537 ± 29 UFC (µg/24h) 33 ± 7 20 ± 4 28 ± 4 46 ± 13 46 ± 8* 40 ± 5 44 ± 8* 35 ± 6 22 ± 4 20 ± 2 36 ± 6
Epinephrine,
µg/24h 5.02 ± 0.75 6.34 ± 1.04 6.79 ± 0.95 6.46 ± 0.91 6.65 ± 1.09 7.33 ± 0.83 6.06 ± 0.65 7.37 ± 1.01 6.26 ± 0.93 5.34 ± 0.62 6.75 ± 0.9 Norepinephrine,
µg/24h 25 ± 5 22 ± 2 24 ± 3 30 ± 4 27 ± 3 32 ± 3* 28 ± 4 29 ± 4 29 ± 4 28 ± 3 28 ± 4 Metanephrine,
µmol/24h 0.44 ± 0.07 0.51 ± 0.05 0.53 ± 0.06 0.6 ± 0.06 0.59 ± 0.08 0.62 ± 0.05 0.5 ± 0.07 0.59 ± 0.07 0.41 ± 0.03* 0.4 ± 0.02*0.56 ± 0.07 Normetanephrine,
µmol/24h 0.93 ± 0.24 0.85 ± 0.11 0.88 ± 0.14 1.04 ± 0.1 0.88 ± 0.1 0.98 ± 0.08 0.92 ± 0.12 0.97 ± 0.12 0.88 ± 0.13 0.94 ± 0.11 1.1 ± 0.13 Dopamine,
µg/24h 250 ± 39 173 ± 18 221 ± 30 311 ± 32 247 ± 19 254 ± 31 236 ± 32 229 ± 31 174 ± 27 180 ± 30 223 ± 41 Diuresis, l/24h 1.37 ± 0.22 1.13 ± 0.1 1.23 ± 0.15 2.31 ± 0.21*1.94 ± 0.19*2.24 ± 0.34*1.99 ± 0.2*2.26 ± 0.31* 0.91 ± 0.11* 1.06 ± 0.1 1.23 ± 0.13
Water intake,
l/24h 1.91 ± 0.17 1.54 ± 0.19 1.50 ± 0.19 1.50 ± 0.12 1.47 ± 0.16 2.0 ± 0.22 1.86 ± 0.2 2.14 ± 0.24 1.95 ± 0.17 1.64 ± 0.19 1.34 ± 0.16 Partial water
[image:6.595.65.536.466.726.2]balance, ml/24h 770 ± 210 420 ± 190 320 ± 110 −780 ± 170*−520 ± 110*−230 ± 180*−210 ± 150*−230 ± 160* 1030 ± 180* 590 ± 160 200 ± 85 B: baseline; DI: dry immersion; R: recovery; UFC: urinary free cortisol; values are means ± SE, *p < 0.05 vs B-1.
Table 2. Blood biochemistry before, during and following dry immersion.
B-1 DI 2 DI 3 DI 5 R+1 R+3
Na+, mmol/l 136 ± 2 138 ± 2 139 ± 3 137 ± 2 135 ± 2 136 ± 2 K+, mmol/l 3.6 ± 0.1 4.0 ± 0.1* 4.1 ± 0.1* 4.0 ± 0.1* 3.7 ± 0.1 3.7 ± 0.1 Cl−, mmol/l 103 ± 2 104 ± 1 105 ± 2 102 ± 1 102 ± 1 103 ± 2
Ca2+, mmol/l 2.14 ± 0.05 2.22 ± 0.04* 2.23 ± 0.05* 2.27 ± 0.05* 2.18 ± 0.04 2.08 ± 0.05 Proteins, g/l 65 ± 2 70 ± 2* 70 ± 2* 72 ± 2* 67 ± 2 64 ± 2 Urea, mmol/l 4.5 ± 0.3 3.6 ± 0.2* 4.1 ± 0.2 4.5 ± 0.3 5.4 ± 0.3* 5.2 ± 0.4 Creatinine, µmol/l 74 ± 2 72 ± 2 75 ± 3 76 ± 2 77 ± 3 72 ± 2 Osmolality, mOS/kg 288 ± 7 283 ± 3 283 ± 4 290 ± 4 284 ± 3 284 ± 6
Table 3. Hemodynamic and autonomic responses to tilt test.
Group R0, n = 7 Group R+1, n = 7
B n R0 n P value, B vs R0 B n R+1 n B vs R+1 p value, Supine
HR, bpm 70.3 ± 6.5 7 83.1 ± 6.4* 7 0.017 61.9 ± 1.6 7 60.1 ± 2.8‡ 7 0.457 SBP, mmHg 112.7 ± 2.5 7 124.0 ± 4.2* 7 0.034 113.6 ± 4.2 7 114.7 ± 4.9 7 0.750 DBP, mmHg 56.7 ± 3.6 7 69.3 ± 4.1 7 0.058 57.0 ± 4.3 7 55.7 ± 3.2‡ 7 0.555
SV, ml 86.9 ± 5.9 7 64.7 ± 2.3* 7 0.01 86.0 ± 3.3 7 93.3 ± 5.0‡ 7 0.102 CO, l/min 6.04 ± 0.64 7 5.28 ± 0.33 7 0.148 5.31 ± 0.26 7 5.63 ± 0.45 7 0.233 TPR, AU 0.876 ± 0.077 7 1.173 ± 0.138 7 0.061 0.894 ± 0.057 7 0.909 ± 0.091 7 0.871 SVR, AU 8.6 ± 1.1 7 19.8 ± 4.3 7 0.063 11.7 ± 1.9 7 10.2 ± 2.0 7 0.555 LF RRi normalized 0.63 ± 0.08 7 0.75 ± 0.03 5 0.115 0.62 ± 0.04 7 0.60 ± 0.06 7 0.852 LF/HF RRi 2.65 ± 0.81 7 3.28 ± 0.43 5 0.983 1.80 ± 0.29 7 1.97 ± 0.60 7 0.786 SBRs, ms/mmHg 17.1 ± 2.2 7 13.4 ± 2.4 7 0.207 18.2 ± 2.2 6 16.8 ± 1.7 6 0.496
End tilt
HR, bpm 97.9 ± 7.1† 7 127.4 ± 6.2*† 7 0.001 92.6 ± 4.3† 7 95.5 ± 3.7‡† 7 0.477 SBP, mmHg 114.4 ± 2.5 7 116.4 ± 3.2 7 0.586 118.9 ± 3.9 7 119.0 ± 4.9 7 0.975 DBP, mmHg 60.0 ± 2.9 7 70.6 ± 2.1* 7 0.019 70.7 ± 4.3† 7 70.9 ± 3.6† 7 0.970
SV, ml 45.8 ± 4.0† 7 31.8 ± 1.7*† 6 0.024 54.4 ± 5.8† 7 54.5 ± 2.3‡† 7 0.988 CO, l/min 4.30 ± 0.13† 7 4.12 ± 0.30 6 0.867 4.98 ± 0.49 7 5.18 ± 0.29‡ 7 0.693 TPR, AU 1.498 ± 0.099† 7 1.692 ± 0.176† 6 0.469 1.087 ± 0.083 6 1.139 ± 0.051‡† 6 0.603 SVR, AU 36.1 ± 5.8† 7 37.2 ± 5.5 6 0.567 45.5 ± 7.9† 6 40.3 ± 11.7† 7 0.966 LF RRi normalized 0.80 ± 0.06 7 0.81 ± 0.04† 4 0.182 0.80 ± 0.03† 7 0.82 ± 0.03† 7 0.562 LF/HF RRi 6.63 ± 1.66† 7 4.97 ± 0.76† 4 0.099 4.61 ± 0.70† 7 5.75 ± 1.01† 7 0.394 SBRs, ms/mmHg 6.0 ± 0.8† 7 4.3 ± 0.5† 6 0.072 6.1 ± 0.9† 7 5.2 ± 0.4† 7 0.227 B: baseline; R: recovery; n: subjects number; HR: heart rate; SBP: systolic blood pressure; DBP: diastolic blood pressure; SV: stroke volume; CO: cardiac output; TPR: total peripheral resistance; SVR: skin vascular resistance; LF: low frequency band; HF: high frequency band; RRi: R-R interval; LF/HF: sympa-thetic index; SBRs: spontaneous baroreflex sensitivity; values are mean ± SE; *p ≤ 0.05 vs before; †p ≤ 0.05 vs supine; ‡p ≤ 0.05 vs group.
significant increase in HR and SBP, and a tendency to-wards increase for DBP (p = 0.058), TPR (p = 0.06) and SVR (more than 2-fold increase, p = 0.063). SV was de-creased, and CO remained unchanged. Measurements taken in the upright position showed increased HR and DBP and decreased SV after immersion, whereas SBP, TPR, SVR and CO remained unchanged.
On R+1, all measured hemodynamic variables did not show significant difference from pre-immersion levels, in both supine and upright positions.
SVR in the upright position was significantly higher than in the supine position for all measurements except
those taken on R0.
3.5. Autonomic Nervous System
3.5.1. Catecholamines and Their Metabolites
0 50 100 150 200 250
B D2 D3 D5 R+1 R+3
* Aldosterone
ng
/L
0 5 10 15 20 25
B D2 D3 D5
*
R+1 R+3
* Plasma renin activity
ng
/L
0 10 20 30 40 50 60
B D2 D3 D5
*
R+1 R+3
* BNP
ng
/L
[image:8.595.75.269.81.364.2]Dry immersion
Figure 5. Blood aldosterone, renin and brain natriuretic peptide (BNP) before, during and following dry immersion. B: baseline; D: dry immersion; R: recovery. Values are means ± SE; *p < 0.05 vs baseline.
0.08; day 2, p = 0.09), with tendency to decrease on R0 (p = 0.07) (Table 1).
3.5.2. Cardiac Autonomic Neural Control
There was no significant difference in heart rate variabi- lity spectrum (LF, LF/HF) before and after DI (both R0 and R+1) (Table 3). Spontaneous baroreflex slope in upright position tended towards decrease on R0, but not on R+1 (Table 3).
3.6. Metabolism
3.6.1. Weight Changes
Body weight during immersion decreased by approxi- mately 700 - 800 g. This decrease was significant on day 2 and day 3, with day 4 and day 5 showing a tendency to- wards decrease (p = 0.06). During recovery, there was no significant variation in body weight.
3.6.2. Blood Variables Relevant to Metabolism
All studied blood variables relevant to metabolism were within normal limits. Insulin, estimated insulin resistance (HOMA-IR), leptin and both LDL- and HDL-cholesterol fractions increased during DI. On the second recovery day, these variables did not differ from baseline. Fasting glucose and triglyceride levels were not significantly
altered during DI (Table 2).
3.6.3. UFC and hs-CRP
Urinary free cortisol was slightly increased during im- mersion (significantly on day 2 and day 4), and unmodi- fied in recovery (Table 1).
hs-CRP was unmodified (Table 2).
4. Discussion
Our results showed that during a 5-day DI, the decrease in total body water (3% - 4%) comes mostly from ex- tracellular compartment (decrease 6% - 8%), and shows rapid stabilization at the new level. Five days of DI are sufficient to impair metabolism with decrease in glucose tolerance and hypercholesterolemia, but are not associ- ated with pronounced autonomic changes. The 5-day DI induces marked cardiovascular impairment with altered orthostatic tolerance at first rising, which is quickly re- versed (within 24 hours upon resuming normal activi- ties).
4.1. Regulation of Body Fluids: Excretion and Redistribution
Extracellular osmolality, approximated by blood osmo- lality, remained stable under DI, suggesting no important changes regarding the intracellular volume. The main changes detected in response to the DI involved ex- tracellular fluid, namely intravascular and interstitial volume.
4.1.1. Intravascular Volume: Water Loss by Neuroendocrine Regulation
hypovolemia, which is prioritized over the need to “unload” the deconditioned heart.
4.1.2. Interstitial Volume: Water Redistribution by Protein Transfer
Plasma volume reduction calculated using plasma pro- teins consisted of as little as 1/3 of that calculated using Hct or Hb and Hct. This difference might be explained by the partial transfer of albumins (which make up ap- proximately 60% of total protein pool) to interstitial fluid. During immersion, with compression of superficial tis- sues and continuous transcapillary “autotransfusion” [13], enhanced loss of interstitial fluid occurs. To limit tissue dehydration, plasma albumins might shift to interstitial fluid and increase its oncotic pressure. The partial trans- fer of proteins from plasma to interstitial fluid prevents the further decrease in interstitial fluid volume, which ensures the limitation of liquid loss and its adequate re- distribution between intra-and extravascular departments [14]. Plasma proteins can be deposited in extravascular fluid compartments, and, if necessary, quickly return to restore the plasma protein loss. This was demonstrated by experiments with dry immersion and head-down bed rest, in which the plasma protein pool was restored dur- ing recovery at a rate exceeding the possibility of its synthesis de novo [15].
4.2. Hemodynamics
Five days of DI induced marked impairment of the car- diovascular system with tachycardia and stroke volume diminution both during resting and orthostatic challenge. The increase in HR, TPR and skin vasoconstriction, ob- served during first rising, might help to maintain blood pressure in conditions of decreased blood volume. The over two-fold increase in supine SVR together with the lack of further increase in SVR when upright immedi- ately after DI might reflect the tension of systems main- taining cerebral blood perfusion.
4.3. Autonomic Nervous System
Dry immersion conditions might, on one hand, increase sympathetic activity due to hypovolemia and stress, and on the other hand, decrease it due to physical inactivity. Most DI studies suggest that DI conditions increase sympathetic activation [4]. However, we did not observe pronounced autonomic changes. Heart rate variability remained unmodified, though baroreflex sensitivity was somewhat weakened. The concentrations of urinary cathecolamines and theirs metabolites were not seriously altered.
4.4. Metabolism
The metabolic effects of DI are mainly related to the en-
forced physical inactivity. DI rapidly impaired glucose metabolism and lipid profile, inducing a decrease in insulin sensitivity and dyslipidemia. The same changes were observed in bed rest experiments [16-18]. It is important to note that physical inactivity for even a short-time is sufficient to impair metabolism ([18], this study). The increase in UFC during DI may be related to increased diuresis, as UFC and cortisone excretion de- pends on urine volume [19]. It also might reflect stress induced by new environment and the efforts of the or- ganism to preserve homeostasis. Unmodified hs-CRP suggests the absence of a pronounced inflammatory state in DI.
4.5. Hypovolemia as Major Reason for
DI-Induced Cardiovascular Deconditioning A number of mechanisms may contribute to cardiovas- cular deconditioning induced by DI: circulatory blood volume loss [20,21], impaired baroreflex sensitivity [22, 23], autonomic dysfunction [22,24], increased venous compliance [21] enforced by decreased muscle tone [25], macrovascular [26] and microvascular [27] impairment promoted by physical inactivity and prolonged decrease of shear stress forces [28], myocardial impairment, hor- monal changes, vestibular changes, or metabolic changes. Hypovolemia appears to be the major contributor for the observed rapid cardiovascular impairment in DI. The importance of hypovolemia is shown by inverse rela- tionships between microgravity-induced plasma volume reduction and orthostatic tolerance [29]. Coyle et al. [30] showed that the decline in SV and V O2 max and the
plasma volume and the baroreflex sensitivity, it was un- able to prevent orthostatic intolerance [33].
In summary, our results suggest that dry immersion induces remarkable changes at renal, endocrine, circula- tory and metabolic levels, with pronounced orthostatic intolerance related mainly to hypovolemia. These changes are characterized by both a very rapid onset and very rapid restoration within return to normal activities.
4.6. Perspectives
DI is very original and efficient tool for physiological and physiopathological studies, especially in renal and body-fluid domain. In healthcare context, pronounced diuretic, sedative and muscle tone-decreasing effects of DI make it therapeutically promising. DI had already been tested in nephrology and cardiology for treatment of hypertension and edemas, in pediatrics for rehabilitation of preterm infants, and in neurology for muscle spasm relief. It may appear an efficient, easy and low-cost method of non-drug treatment. But to consider larger clinical implementation of DI, it is essential to dispose comprehensive detailed information concerning its ef- fects. Our study on healthy volunteers aimed to contrib- ute to this general knowledge. This work should be con- tinued to further elucidate the mechanisms and potential applications of DI.
5. Acknowledgements
The authors thank all the volunteers for their enthusiastic participation in this study.
This study was supported by CNES, CNRS, the re- gional council “Région des Pays de la Loire” (DC-VACE project), RFFI, and the European FEDER program (Televasc program).
REFERENCES
[1] M. Epstein, “Cardiovascular and Renal Effects of Head- Out Water Immersion in Man: Application of the Model in the Assessment of Volume Homeostasis,” Circulation Research, Vol. 39, No. 5, 1976, pp. 619-628.
doi:10.1161/01.RES.39.5.619
[2] M. Epstein, “Renal, Endocrine and Hemodynamic Effects of Water Immersion in Humans,” In: M. J. Fregly and C. M. Blatteis, Eds., Handbook of Physiology, Environmen- tal Physiology, Oxford University Press, Oxford, 1996, pp. 845-853.
[3] J. E. Greenleaf, “Physiological Responses to Prolonged Bed Rest and Fluid Immersion in Humans,” Journal of Applied Physiology, Vol. 57, No. 3, 1984, pp. 619-633. [4] N. M. Navasiolava, M. A. Custaud, E. S. Tomilovskaya, I.
M. Larina, T. Mano, G. Gauquelin-Koch, C. Gharib and I. B. Kozlovskaya, “Long-Term Dry Immersion: Review and Prospects,” European Journal of Applied Physiology, Vol. 111, No. 7, 2011, pp. 1235-1260.
doi:10.1007/s00421-010-1750-x
[5] M. E. Widlansky, “The Danger of Sedenterism: Endothe- lium at Risk,” Heart and Circulatory Physiology: Ameri- can Journal of Physiology, Vol. 299, No. 2, 2010, pp. 243-244.doi:10.1152/ajpheart.00505.2010
[6] M. A. Iunusov, V. N. Orlov and T. V. Vinokhodova, “Effect of the Model of ‘Dry’ Immersion on the Indica- tors of Water-Electrolyte Metabolism and Aldosterone and Cortisol in the Plasma of Persons with Different Lev- els of Body Water,” Kosmicheskaia Biologiia i Aviakos- micheskaia Meditsina, Vol. 19, No. 4, 1985, pp. 42-45. [7] S. G. Ivanov and E. E. Bogomazov, “‘Dry’ Immersion
and Prospects of Its Use in Clinical Practice,” Kos- micheskaia Biologiia i Aviakosmicheskaia Meditsina, Vol. 22, No. 5, 1988, pp. 4-6.
[8] S. G. Ivanov and L. I. Markova, “Use of a ‘Dry’ Immer- sion Method in the Treatment of Hypertensive Crisis,”
Kosmicheskaia Biologiia i Aviakosmicheskaia Meditsina, Vol. 24, No. 1, 1990, pp. 40-42.
[9] N. M. Navasiolava, V. de Germain, T. Levrard, I. M. Larina, I. B. Kozlovskaya, B. Diquet, A. Le Bouil, M. A. Custaud and J. O. Fortrat, “Skin Vascular Resistance in the Standing Position Increases Significantly after 7 Days of Dry Immersion,” Autonomic Neuroscience, Vol. 160, No. 1-2, 2011, pp. 64-68.
doi:10.1016/j.autneu.2010.10.003
[10] M. Coupé, M. Yuan, C. Demiot, Y. Q. Bai, S. Z. Jiang, Y. Z. Li, P. Arbeille, G. Gauquelin-Koch, T. Levrard, M. A. Custaud and Y. H. Li, “Low-Magnitude Whole Body Vi- bration with Resistive Exercise as a Countermeasure against Cardiovascular Deconditioning after 60 Days of Head-Down Bed Rest,” American Journal of Physiol- ogy—Regulatory, Integrative and Comparative Physiol- ogy,Vol. 301, No. 6, 2011, pp. 1748-1754.
doi:10.1152/ajpregu.00234.2011
[11] V. P. Krotov, T. E. Burkovskaia, M. A. Dotsenko, Iu. V. Gordeev, A. M. Nosovskiĭ and N. A. Chel’naia, “Blood Plasma Volume Dynamics in Monkeys during Immer- sion,” Aviakosmicheskaia i Ekologicheskaia Meditsina, Vol. 38, No. 3, 2004, pp. 30-36.
[12] N. M. Navasiolava, A. Pajot, Y. Gallois, L. Kh. Pas- tushkova, V. A. Kulchitsky, G. Gauquelin-Koch, I. B. Kozlovskaya, M. Heer, O. Hand, I. M. Larina and M. A. Custaud, “NT-ProBNP Levels, Water and Sodium Ho- meostasis in Healthy Men: Effects of 7 Days of Dry Im- mersion,” European Journal of Applied Physiology,Vol. 111, No. 9, 2011, pp. 2229-2237.
doi:10.1007/s00421-011-1858-7
[13] J. A. Krasney, “Head-Out Water Immersion: Animal Studies,” In: M. J. Fregly and C. M. Blatteis, Eds., Hand- book of Physiology, Environmental Physiology, Oxford University Press, Oxford, 1996, pp. 855-887.
[14] K. I. Gogolev, E. A. Aleksandrova and E. B. Shul’zhenko, “Comparative Assessment of Changes during Antior- thostatic Hypokinesia and Immersion in Man,” Human Physiology, Vol. 6, No. 6, 1980, pp. 392-396.
and Immersion,” Kosmicheskaia Biologiia i Aviakos- micheskaia Meditsina, Vol. 16, No. 6, 1982, pp. 22-28. [16] A. Bergouignan, I. Momken, D. A. Schoeller, S. Nor-
mand, A. Zahariev, B. Lescure, C. Simon and S. Blanc, “Regulation of Energy Balance during Long-Term Phy- sical Inactivity Induced by Bed Rest with and without Exercise Training,” Journal of Clinical Endocrinology & Metabolism, Vol. 95, No. 3, 2010, pp. 1045-1053.
doi:10.1210/jc.2009-1005
[17] S. Blanc, S. Normand, C. Pachiaudi, J. O. Fortrat, M. Laville and C. Gharib, “Fuel Homeostasis during Physical Inactivity Induced by Bed Rest,” Journal of Clinical En- docrinology & Metabolism, Vol. 85, No. 6, 2000, pp. 2223-2233.doi:10.1210/jc.85.6.2223
[18] N. M. Hamburg, C. J. McMackin, A. L. Huang, S. M. Shenouda, M. E. Widlansky, E. Schulz, N. Gokce, N. B. Ruderman, J. F. Keaney Jr. and J. A. Vita, “Physical In- activity Rapidly Induces Insulin Resistance and Mi- crovascular Dysfunction in Healthy Volunteers,” Arte- riosclerosis, Thrombosis, and Vascular Biology, Vol. 27, No. 12, 2007, pp. 2650-2656.
doi:10.1161/ATVBAHA.107.153288
[19] M. Fenske, “Urinary Free Cortisol and Cortisone Excre- tion in Healthy Individuals: Influence of Water Loading,”
Steroids,Vol. 71, No. 11-12, 2006, pp. 1014-1018.
doi:10.1016/j.steroids.2006.08.004
[20] J. C. Buckey Jr., L. D. Lane, B. D. Levine, D. E. Waten- paugh, S. J. Wright, W. E. Moore, F. A. Gaffney and C. G. Blomqvist, “Orthostatic Intolerance after Spaceflight,”
Journal of Applied Physiology, Vol. 81, No. 1, 1996, pp. 7-18.
[21] V. A. Convertino, “Exercise and Adaptation to Micro- gravity Environment,” In: M. J. Fregly and C. M. Blatteis, Eds., Handbook of Physiology, Environmental Physiology, Oxford University Press, Oxford, 1996, pp. 815-843. [22] V. A. Convertino, “Mechanisms of Microgravity Induced
Orthostatic Intolerance: Implications for Effective Coun- termeasures,” Journal of Gravitational Physiology, Vol. 9, No. 2, 2002, pp. 1-13.
[23] K. A. Engelke, D. F. Doerr, C. G. Crandall and V. A. Convertino, “Application of Acute Maximal Exercise to Protect Orthostatic Tolerance after Simulated Micrograv- ity,” American Journal of Physiology, Vol. 271, No. 4, 1996, pp. R837-R847.
[24] T. Mano, “Autonomic Neural Functions in Space,” Cur- rent Pharmaceutical Biotechnology, Vol. 6, No. 4, 2005, pp. 319-324.doi:10.2174/1389201054553743
[25] A. I. Grigor’ev, I. B. Kozlovskaia and B. S. Shenkman, “The Role of Support Afferents in Organization of the Tonic Muscle System,” Rossiĭskii Fiziologicheskiĭ Zhur- nal Imeni I.M. Sechenova, Vol. 90, No. 5, 2004, pp. 508- 521.
[26] L. F. Zhang, “Vascular Adaptation to Microgravity: What Have We Learned?” Journal of Applied Physiology, Vol. 91, No. 6, 2001, pp. 2415-2430.
[27] M. Coupe, J. O. Fortrat, I. M. Larina, G. Gauquelin-Koch, C. Gharib and M. A. Custaud, “Cardiovascular Decondi- tioning: From Autonomic Nervous System to Microvas- cular Dysfunctions,” Respiratory Physiology & Neurobi- ology, Vol. 169, No. 1, 2009, pp. 10-12.
doi:10.1016/j.resp.2009.04.009
[28] P. C. de Groot, M. W. Bleeker and M. T. Hopman, “Mag- nitude and Time Course of Arterial Vascular Adaptations to Inactivity in Humans,” Exercise and Sport Sciences Reviews, Vol. 34, No. 2, 2006, pp. 65-71.
doi:10.1249/00003677-200604000-00005
[29] V. A. Convertino, “Clinical Aspects of the Control of Plasma Volume at Microgravity and during Return to one Gravity,” Medicine & Science in Sports & Exercise, Vol. 28, No. 10, 1996, pp. 45-52.
doi:10.1097/00005768-199610000-00033
[30] E. F. Coyle, M. K. Hemmert and A. R. Coggan, “Effects of Detraining on Cardiovascular Responses to Exercise: Role of Blood Volume,” Journal of Applied Physiology, Vol. 60, No. 1, 1986, pp. 95-99.
[31] W. W. Waters, S. H. Platts, B. M. Mitchell, P. A. Whitson and J. V. Meck, “Plasma Volume Restoration with Salt Tablets and Water after Bed Rest Prevents Or- thostatic Hypotension and Changes in Supine Hemody- namic and Endocrine Variables,” Heart and Circulatory Physiology: American Journal of Physiology, Vol. 288, No. 2, 2005, pp. 839-847.
doi:10.1152/ajpheart.00220.2004
[32] J. Vernikos and V. A. Convertino, “Advantages and Dis- advantages of Fludrocortisone or Saline Load in Prevent- ing Post-Spaceflight Orthostatic Hypotension,” Acta As- tronaut,Vol. 33, 1994, pp. 259-266.
doi:10.1016/0094-5765(94)90133-3
[33] M. A. Custaud, C. Millet, J. Frutoso, A. Maillet, G. Gau- quelin, C. Gharib and J. O. Fortrat, “No Effect of Veno- constrictive Thigh Cuffs on Orthostatic Hypotension In- duced by Head-Down Bed Rest,” Acta Physiologica Scandinavica, Vol. 170, No. 2, 2000, pp. 77-85.
Supplementary Data
Table S1. Variations from baseline for creatinine, free water, osmolal and urea clearances (Δ = valueday − valuebaseline).
DI 1 DI 2 DI 4 R0 R+2
ΔCCr, ml/min 5.6 ± 7.0 8.9 ± 10.7 −2.9 ± 13.9 −18.9 ± 8.4 4.9 ± 5.8
ΔCH2O, ml/min 0.42 ± 0.2 0.61 ± 0.3 0.43 ± 0.22 0.45 ± 0.2 0.11 ± 0.22 ΔCosm, ml/min −0.32 ± 0.14 −0.23 ± 0.09 −0.41 ± 0.14* 0.08 ± 0.19 0.15 ± 0.11 ΔCurea, ml/min 13.9 ± 1.9* 6.8 ± 3.8 5.9 ± 5.3 −9.6 ± 2.6* 5.4 ± 3.3 CCr: creatinine clearance; CH2O: free water clearance; Cosm: osmolal clearance; Curea: urea clearance; B: baseline; DI: dry immersion; R: recovery; values are means ± SE, *p < 0.05 vs baseline.
Table S2. Morning blood pressure and heart rate before, during and after dry immersion.
B-2 B-1 DI 1 DI 2 DI 3 DI 4 DI 5 R0 R+1 R+2
SBP, mmHg 124 ± 3 123 ± 3 121 ± 3 116 ± 2 121 ± 2 123 ± 3 113 ± 2* 121 ±3 123 ± 2 118 ± 2 DBP, mmHg 72 ± 2 69 ± 2 71 ± 2 68 ± 1 73 ± 2 68 ± 2 70 ± 2 71 ± 1 68 ± 2 64 ± 2
[image:12.595.54.541.254.325.2]