ISSN Online: 2327-5960 ISSN Print: 2327-5952
Empirical Analysis of Network Reciprocity’s
Impacts on Universities’ Cross-Region
Technology Transfer Performance
Yi Tang
The School of Public Affairs, University of Science and Technology of China, Hefei, China
Abstract
Based on the analysis of the network theories, assumptions are raised about how the reciprocity influences the transfer, and theoretical models are estab-lished accordingly. Variables reflecting network reciprocity and technology transfer performance are chosen and measured based on the study of assump-tions. Regression analysis of panel data is adopted to study the relation be-tween the variables, and the result is used to verify the assumptions. Finally, corresponding advices on policy making and future study are raised according to the research results. Through empirical analysis, it is illustrated that the performance of cross-region technology transfer is improved with the increase of the region’s reciprocity relationship in the transfer network. The reciprocity relationship can significantly promote the import, export and transfer level of universities’ technologies. The region’s participation level of reciprocity cli-ques can accelerate the export of technology but has no significant impact on technology transfer.
Keywords
Universities, Cross-Region Technology Transfer, Network Reciprocity, Transfer Performance
1. Introduction
University is an important part of a country’s innovation system, and the trans-fer of its technological achievements is a crucial drive to the region’s innovation and economic development. Due to restrictions such as geographic distance and regional policies, the transfer tends to take place locally, which leads to two con-sequences: on one hand, the difference of innovation levels among different re-gions caused by the imbalance of education resources is increased, with innova-How to cite this paper: Tang, Y. (2017)
Empirical Analysis of Network Reciproci-ty’s Impacts on Universities’ Cross-Region Technology Transfer Performance. Open Journal of Social Sciences, 5, 384-395. https://doi.org/10.4236/jss.2017.55026
Received: May 4, 2017 Accepted: May 24, 2017 Published: May 27, 2017
Copyright © 2017 by author and Scientific Research Publishing Inc. This work is licensed under the Creative Commons Attribution International License (CC BY 4.0).
tion ability of regions equipped with a large number of universities continuously becoming stronger while that of those regions with inadequate resources be-comes worse; on the other hand, the industries in a certain region are limited, which prevents the universities’ technology outcomes from being fully utilized and transferred. Cross-region technology transfer can break these restrictions and form positive interaction of innovation resources including technology re-sources, capital and human resources between universities and industries, and also between different regions, which can effectively bridge the gap of resource difference and coordinate the development.
When studying the influencing factors of universities’ cross-region technology transfer, current researchers mainly adopt two-dimensional analysis and focus on the influences caused by the technology itself, the subjects involved in the transfer and the transfer environment, with only a few of the researchers study-ing the impacts of network relations such as cross-region transfer ties or clique relationship. However, many studies and cases have demonstrated the impor-tance of social network in the transfer process [1] [2]. This report raises assump-tions about the relaassump-tionship between network reciprocity and the transfer based on relevant theories, and establishes theoretical models, and through regression analysis verifies the models, and then based on the empirical analysis results, in-vestigates network reciprocity’s impacts on the technology transfer.
2. Literature Review
The concept of “reciprocity” originated from biology, the theory of which was raised to solve altruism problem faced by Classic Darwinism. Later on, the con-cept of reciprocity preference was widely applied in many fields such as sociolo-gy, economics and management, especially behavioral economics, with Robin introduced the concept into the whole research structure to establish the foun-dation of this discipline [3]. Robin defined “reciprocity” as following behaviors: 1) sacrifice one’s own benefit to help another individual from whom the main subject has received help before; 2) sacrifice one’s own benefit to punish another individual who is unfriendly to the main subject; 3) the two behavior modes above can influence others’ behaviors more significantly when one’s own benefit loss is minor or when the improvement of others’ benefits is greater [4]. This theory changed the classic economics’ assumption of “rational economical men” by holding the opinion that not only an individual’s economical behaviors can help achieve benefits, but the interaction with other individuals can also maxim-ize one’s own benefits. Reciprocity preference involves two processes including reciprocity motivation and reciprocity behavior. The motivation refers to the willing of paying someone back or carrying out revenge at a certain cost of bene-fit, and the behaviors resulted from the motivation are called reciprocity beha-viors.
After a reciprocity relationship is established between two individuals, the tion can last longer and easier to maintain compared with non-reciprocity rela-tionship, and interactions carried out based on reciprocity principles can strengthen the relationship as well [5]. With the development of this theory, re-ciprocity principles are now applied not only between individuals, but are also expanded to study the relationship between different groups. On this new level, the study mainly focuses on the network reciprocity among groups. Network re-ciprocity refers to the equivalent relationship in which subjects from different network rely on each other [6]. Earlier measurement of network reciprocity level mainly depended on the proportion of reciprocity relations [7]. Researchers think that reciprocally related subjects have more stable and equivalent rela-tionships. The reciprocity relationship is also called “strong-strong tie”. Feng zhao Liu believes that with the deepening of the technology transfer process, the relationship between different regions would turn from “weak-weak” tie to “strong-strong” tie [8]. Recently, network reciprocity is widely applied when studying the performance of technology transfer and enterprises. Herderson and Cockburn found out that network reciprocity can strength the confidence be-tween subjects and therefore improve the spread efficiency of tacit knowledge [9]. Jingwei Liu et al. believe that management strategies and team culture based on reciprocity principles can help form a mutual vision, and the reciprocity pre-ference between team members can accelerate the spread of tacit knowledge and the realization of mutual vision, which leads to the advancement of a team’s in-novation ability [10].
However, former research mainly focuses on enterprise level study. With the development of the university technology research, more and more universities’ technology transfer into enterprise and other institution. If the network reci-procity could influence the universities’ cross regional technology transfer has seldom been researched. In the network, reciprocity relationship not only in-cludes reciprocity ties, but how different reciprocity relationships influence technology transfer needs further research.
3. Research Assumptions
3.1. The Relationship between Network Reciprocity and the
Performance of Cross-Region Technology Absorption
tie have a relationship with better confidence and stability. In the process of knowledge exchange, Zhaowen Lin thinks that reciprocity relationship can op-timize traditional mode of knowledge transfer, and the receiver can achieve bet-ter effect of transfer due to the exporbet-ter’s reciprocity preference [11]. Reciprocity relationship also implies the existence of mutual confidence and learning, and this kind of interactive mechanism can encourage technology exchange level between the subjects, and finally realizes technology innovation. Technology is the carrier of knowledge; therefore, the transfer of technology means the spread of knowledge. A region’s technology innovation is the ultimate purpose of cross- region technology transfer.
In terms of technology absorption, the stable relationship with mutual confi-dence across regions based on reciprocity network can create reciprocity prefe-rence among technology producers which reduces the confidence risk. Besides, reciprocity network can shape frequent tunnels between regions which eliminate unnecessary communication and study and increase the absorption efficiency. A hypothesis is raised as follows:
H1: Network reciprocity can positively influence the absorption performance of cross-region technology transfer. To the receivers, building more reciprocity relationships in the transfer network can benefit their absorption of the tech-nology.
3.2. The Relationship between Network Reciprocity and the
Performance of Cross-Region Technology Export
H2: Network reciprocity can positively influence the export performance of cross-region technology transfer. Subjects with more reciprocity relationships can reach higher level of technology export.
3.3. The Relationship between Network Reciprocity and the
Performance of Cross-Region Technology Transfer
Combining the deduction of hypothesis H1 and H2, and analysis of universities’ technology transfer network, the report holds the view that reciprocity network has significantly positive effects on the overall performance of cross-region technology transfer. A hypothesis is raised as follows:
H3: Network reciprocity can positively influence the performance of cross- region technology transfer. With more reciprocity relationship in the transfer network, a region has better import and export ability and therefore higher transfer standard.
Based on the hypothesis, this paper select several indexes including reciprocity ties, clique and so on to measure variables and collect the related panel data. Then through regression analysis to verify if the dependent variables have a sig-nificant effect on dependent variable. Finally, based on the relationship between dependent variables an independent variable is to confirm the hypothesis.
4. Index Selection and Measurement
4.1. Indexes of Network Reciprocity
Indexes of network reciprocity consists of two types, respectively reciprocity re-lations and sub-groups. Researchers usually assess the strength of rere-lations in directed networks by viewing whether the relations are reciprocal, and the reci-procal ones are considered as strong relations and function crucially in promot-ing technology transfer [12]. Network sub-group based on reciprocity is called a clique, which requires strict one-on-one reciprocity relations between its mem-bers. Cliques are viewed as sub-groups with frequent interaction, and can signif-icantly enhance the transfer of complicated knowledge.
sym-metrical numbers in the matrix is adopted as the replacement of the two num-bers. In the final symmetrized matrix, number 1 is viewed as reciprocity rela-tionship while number 0 is viewed as non-reciprocity one. The number of reci-procity relations owned by each network nodes, which is the recireci-procity tech-nology transfer relations owned by each province, can be obtained by adding the numbers together. The participation number of cliques is obtained by adding the cliques’ participation number of each node (i.e. of each province) together using clique analysis function of UCINET.
4.2. Indexes of Technology Transfer Performance
In earlier researches, Chapple et al. adopted the number of patent permission as the index to measure technology transfer performance while Thursby used the transaction price of patents as the index to evaluate the transfer efficiency [13] [14].
Considering the difficult achievement, relatively poor quality and limited valid time of patent data in China, Chinese researchers mainly chose the number of signed technology transfer contracts or incomes as indexes to measure the transfer performance in the past. However, there exists time-delay for these in-dexes therefore they can’t fully reflect the real transfer situations of that time [15]. In recent years, the numbers of patent transfer and permission keep in-creasing, and this change enables the researchers to use these numbers to meas-ure the output of technology transfer [16]. The number of universities’ patented technology export (which is the sum of transfer and permission) is adopted as the index to measure technology export performance while the number of pa-tented technology imported by the regions as the index to measure the absorp-tion performance. The sum of patent export and import number is considered as the number of patent transfer. The number of patent transfer was also collected from Incopat database.
4.3. Selection of Controlled Variables
According to the Ba Linsen function model and other research results, the two sides of the technology transfer are considered as major influences in the trans-fer. In terms of technology supply, the innovation level of a region or an organi-zation can directly affect the transfer export level. Universities’ research input, researchers’ quality, transfer mode and management can also impose influences. Therefore, at the side of technology supply, universities’ R&D achievements ap-plication in the regions, the cost of scientific research and the amount of patent permission are chosen as the controlled variables.
earlier development accumulation and technological knowledge foundation [18]. Subjects with better absorption ability can accept new technology and know-ledge more rapidly. Therefore, the regional GDP is selected as the controlled va-riable at the demanding side.
To conclude, this report conducts analysis from two sides, respectively the supply and demand of technology, and selects three controlled variables includ-ing universities’ R&D achievements application and scientific research cost of the year, the amount of patent permission of the year and the regional GDP. The data of these variables are collected from Chinese Statistic Yearbook and Chinese Technological Statistic Yearbook.
5. Model Establishment
According to the deduction and hypotheses mentioned above, a theoretical model of the relationship between network reciprocity and universities’ cross- region technology transfer performance can be established as follows, in which the network reciprocity is the independent variable and consists of two dimen-sions including the number of reciprocity ties and the participation of reciprocal cliques, which can be obtained by measuring the existing transfer network. The transfer performance is the dependent variable and contains three dimensions including the performance of export, absorption and transfer, which can be ob-tained by measuring the number of patented technology transfer. The universi-ties’ R&D achievements application and scientific research cost of the year, the amount of patent permission of the year and the regional GDP are controlled variables. The following Figure 1 is the specific model.
6. Empirical Analysis
6.1. Descriptive Statistics Analysis
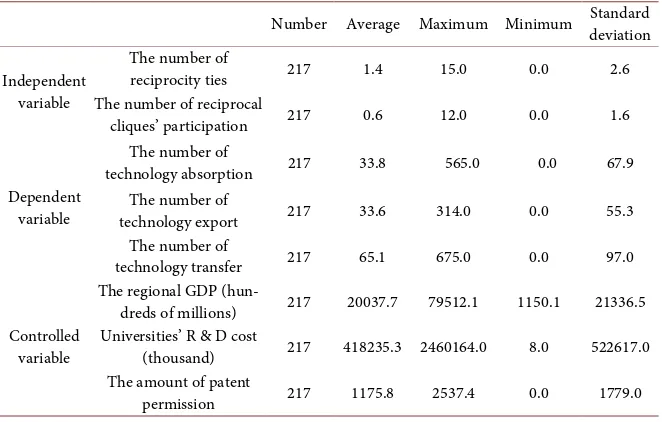
[image:7.595.209.537.559.720.2]In order to study the relationship between network reciprocity and universities’ cross regional technology transfer. This paper does correlation analysis and re-gression analysis by STATA. The data of 31 provinces from 2010 to 2016 are chosen to establish the panel data sample for all the variables. The number of
samples for each variable is 217 (the number of those variables with missing data is smaller than 217). The descriptive analysis is shown in Table 1. It is illustrated that the average value of the reciprocal relations and reciprocity cliques’ partici-pation numbers are both small, which implies that the overall reciprocity level of the transfer network is still low. As to the three indexes of the dependent varia-ble, there exists a big difference between the maximum and minimum value and a large standard deviation, which indicates a big gap between the transfer per-formances of various regions and an imbalance of regions’ technological innova-tion and absorpinnova-tion level. Therefore, universities’ cross-region technology trans-fer is necessary as an effective approach to narrow the gap.
6.2. Correlation Analysis
[image:8.595.209.540.523.734.2]To avoid the error caused by collineation of variables, their correlation is ex-amined before the regression analysis. As is shown in Table 2, the correlation coefficient for reciprocal relation number and export performance is 0.7578*, which means they are significantly positively correlated; the correlation coeffi-cient for reciprocal relation number and transfer performance is 0.8446*, indi-cating a significant positive correlation; the coefficient for reciprocal relation number and absorption performance is 0.6407*, indicating a significant positive correlation. The coefficient for reciprocity cliques’ participation number and export performance is 0.7134*, indicating a significant positive correlation; the coefficient for reciprocity cliques’ participation number and transfer perfor-mance is 0.8182*, indicating a significant positive correlation; the coefficient for reciprocity cliques’ participation number and absorption performance is 0.6390*, indicating a significant positive correlation. The results of correlation analysis demonstrate a significant correlation between network reciprocity and technology transfer performance, which lays the foundation of regression analy-sis.
Table 1. The result of descriptive statistics analysis.
Number Average Maximum Minimum Standard deviation
Independent variable
The number of
reciprocity ties 217 1.4 15.0 0.0 2.6 The number of reciprocal
cliques’ participation 217 0.6 12.0 0.0 1.6
Dependent variable
The number of
technology absorption 217 33.8 565.0 0.0 67.9 The number of
technology export 217 33.6 314.0 0.0 55.3 The number of
technology transfer 217 65.1 675.0 0.0 97.0
Controlled variable
The regional GDP
(hun-dreds of millions) 217 20037.7 79512.1 1150.1 21336.5 Universities’ R & D cost
(thousand) 217 418235.3 2460164.0 8.0 522617.0 The amount of patent
Table 2. The result of correlation analysis. Technology
export Technology transfer Technology absorption Reciprocity ties Reciprocal cliques’ participation Technology export 1.0000
Technology transfer 0.7657* 1.0000
Technology absorption 0.3367* 0.8655* 1.0000
Reciprocity ties 0.7578* 0.8446** 0.6407* 1.0000 Reciprocal cliques’
participation 0.7134* 0.8182* 0.6390* 0.9477* 1.0000 Notes: *P < 0.05, **P < 0.01.
6.3. Regression Analysis
The regression analysis of panel data is carried out using STATA and the Fixed Effect model is selected. The results are as follows:
(1)Model 1: relationship between network reciprocity and regions’ technology absorption performance
The result of regression analysis for these variables is demonstrated in Table 3. The P value of the Fixed Effect model is 0.0000, indicating that the whole model is statistically significant therefore is meaningful in the sense of statistical regression. The value of R2 is 0.4868, showing a moderate fitting degree, so the result can reflect the relation between the independent and dependent variables. The P value of the reciprocal relation number and the absorption performance is 0.023, which is less than 0.05, showing a significant positive correlation with the coefficient value of 9.4482. The P value of the reciprocity cliques’ participation number and the absorption performance is 0.197, which fails in the significance test meaning there exists no significant correlation. Conclusions can be drawn that a region’s absorption performance can become better with a larger number of reciprocal relations, while the reciprocity cliques’ participation number has no significant positive influence on the absorption performance.
(2)Model 2: relationship between network reciprocity and regions’ technology export performance
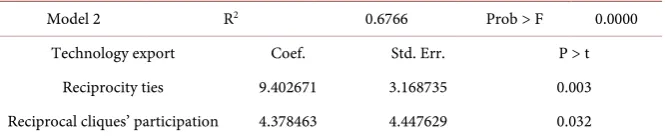
The result is demonstrated in Table 4. The whole model is statistically signif-icant. The value of R2 is 0.6766, showing a better fitting degree than that of
mod-el 1, and can reflect the rmod-elation between the independent and dependent va-riables effectively. The P value of the reciprocal relation number and the export performance is 0.003, which is less than 0.05, showing a significant positive cor-relation with the coefficient value of 9.402671. The P value of the reciprocity cliques’ participation number and the export performance is 0.032 with the coef-ficient value being at 4.378463, indicating a significant positive correlation be-tween the two variables. Conclusions can be drawn that a region’s export per-formance can be improved with a larger number of reciprocal relations and re-ciprocity cliques’ participation.
Table 3. Regression Analysis result of network reciprocity and regions’ technology ab-sorption performance.
Model 1 R2 0.4868 Prob > F 0.0000
Technology absorption Coef. Std. Err. P > t
Reciprocity ties 9.4482 4.104881 0.023
Reciprocal cliques’ participation 7.464676 5.767346 0.197
Table 4. Regression Analysis result of network reciprocity and regions’ technology export
performance.
Model 2 R2 0.6766 Prob > F 0.0000
Technology export Coef. Std. Err. P > t
Reciprocity ties 9.402671 3.168735 0.003
Reciprocal cliques’ participation 4.378463 4.447629 0.032
The result is demonstrated in Table 5. The P value of the reciprocal relation number and the transfer performance is 0.000 and the coefficient value is 18.89839, which shows a significant positive correlation. The P value of the reci-procity cliques’ participation number and the transfer performance is 0.643, which fails in the significance test meaning there is no significant correlation between the two variables. Results of the analysis show a large coefficient value between the reciprocal relation number and the transfer performance, illustrat-ing that the former variable has strong impacts on the latter one, while no sig-nificant positive correlation is found between the reciprocity cliques’ participa-tion number and the transfer performance.
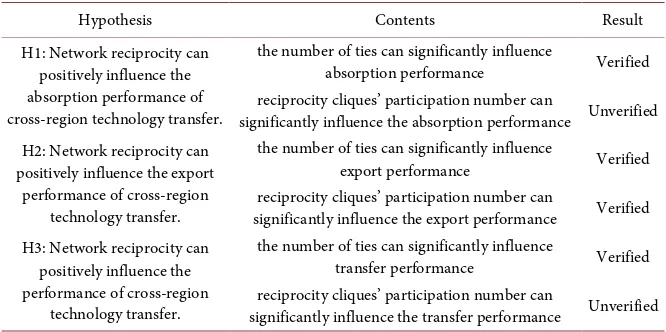
The verification result of the hypotheses achieved from the correlation and regression analysis is demonstrated in Table 6. For the two indexes of network reciprocity, it is verified that the number of relations can significantly influence the cross-region technology transfer performance, while the correlation between reciprocity cliques’ participation number and the absorption or transfer perfor-mance is not shown. According to the analysis of theories and network features mentioned in the former sections, the participation number is believed to be able to affect the transfer performance. However, this effect is not shown in the re-gression analysis. A possible explanation is that the number of existing reciproc-ity cliques in the current transfer network is not big enough to create a signifi-cant influence.
7. Conclusions
[image:10.595.207.540.215.284.2]Table 5. Regression Analysis result of network reciprocity and regions’ technology trans-fer performance.
Model 3 R2 0.6468 Prob > F 0.0000
Technology transfer Coef. Std. Err. P > t
Reciprocity ties 18.89839 4.775024 0.000
Reciprocal cliques’ participation 3.114947 6.718662 0.643
Table 6. Verification results of the hypotheses achieved.
Hypothesis Contents Result
H1: Network reciprocity can positively influence the absorption performance of cross-region technology transfer.
the number of ties can significantly influence
absorption performance Verified reciprocity cliques’ participation number can
significantly influence the absorption performance Unverified H2: Network reciprocity can
positively influence the export performance of cross-region
technology transfer.
the number of ties can significantly influence
export performance Verified reciprocity cliques’ participation number can
significantly influence the export performance Verified H3: Network reciprocity can
positively influence the performance of cross-region
technology transfer.
the number of ties can significantly influence
transfer performance Verified reciprocity cliques’ participation number can
significantly influence the transfer performance Unverified
way to promote the transfer level in order to realize mutual innovation of dif-ferent regions is to create more reciprocal relations and establish transfer al-liances among the innovative subjects. However, this paper only verifies that network reciprocity has positive influence on cross regional technology transfer, but how reciprocity relations influence technology transfer and why reciprocity clique cannot influence technology transfer haven’t been studied. In the future study, it is highly suggested that more research should be carried out on how to fully use the advantages of different subjects such as governments, universities, enterprises and transfer medium in the transfer process, to shape more reciproc-al network relations and to achieve more efficient usage and exchange of inno-vation resources in the network.
References
[1] Reagans, R. and McEvily, B. (2003) Network Structure and Knowledge Transfer: The Effects of Cohesion and Range. Administrative Science Quarterly, 48, 240-267.
https://doi.org/10.2307/3556658
[2] Lin, J.L., Fang, S.C., Fang, S.R. and Tsai, F.S. (2009) Network Embeddedness and Technology Transfer Performance in R&D Consortia in Taiwan. Technovation, 29, 763-774. https://doi.org/10.1016/j.technovation.2009.05.001
[3] Rabin, M. (1998) Psychology and Economics. Journal of Economic Literature, 36, 11-46.
[4] Rabin, M. (1993) Incorporating Fairness into Game Theory and Economics. The American Economic Review, 83, 1281-1302.
[image:11.595.206.539.202.368.2]Ameri-can Sociological Review, 25, 161-178. https://doi.org/10.2307/2092623
[6] Xie, H.M., Wang, X.B., Wu, S. and Yu, W. (2008) Research on Cluster Network and the Innovation of Ijvs. Science Research Management, 29, 23-29.
[7] Hanneman, R.A. and Riddle, M. (2005) Introduction to Social Network Methods. University of California, California.
[8] Liu, F.C. and Ma, R.K. (2013) Study on the Network Structure and Spatial Distribu-tion of Inter-Regional Technology Transfer: Analysis Based on Inter-Provincial Technical Market Transaction of China in 2006-2010. Studies in Science of Science, 31, 529-536.
[9] Henderson, R. and Cockburn, I. (1994) Measuring Competence? Exploring Firm Effects in Pharmaceutical Research. Strategic Management Journal, 15, 63-84.
https://doi.org/10.1002/smj.4250150906
[10] Liu, J.W., Zhang, T.J. and Lin, Z.W. (2009) The Empirical Research of Technique Innovation Capability of Technique Exploration Team Based on Reciprocal Enter-prise Environment. Studies in Science of Science, 27, 1093-1100.
[11] Lin, Z.W., Zhang T. J. and Pu, Y.J. (2008) Research on The Impact of It Capability and Information Sharing Against the R&D Collaboration Between Enterprises. Science Research Management, 29, 28-33.
[12] Bresman, H., Birkinshaw, J. and Nobel, R. (1999) Knowledge Transfer in Interna-tional Acquisitions. Journal of International Business Studies, 30, 439-462.
https://doi.org/10.1057/palgrave.jibs.8490078
[13] Takemoto, K., Oosawa, C. and Akutsu, T. (2007) Structure of N-Clique Networks Embedded in a Complex Network. Physica A: Statistical Mechanics and Its Applica-tions, 380, 665-672. https://doi.org/10.1016/j.physa.2007.02.042
[14] Chapple, W., Lockett, A., Siegel, D. and Wright, M. (2005) Assessing the Relative Performance of UK University Technology Transfer Offices: Parametric and Non-Parametric Evidence. Research Policy, 34, 369-384.
https://doi.org/10.1016/j.respol.2005.01.007
[15] Thursby, J.G. and Kemp, S. (2002) Growth and Productive Efficiency of University Intellectual Property Licensing. Research Policy, 31, 109-124.
https://doi.org/10.1016/S0048-7333(00)00160-8
[16] Heher, A.D. (2006) Return on Investment in Innovation: Implications for Institu-tions and National Agencies. The Journal of Technology Transfer, 31, 403-414.
https://doi.org/10.1007/s10961-006-0002-z
[17] Fan, B.N. and Yu (2015) Study on Regional Differences and Influencing Factors of University Technology Transfer Efficiency. Studies in Science of Science, 33, 1805- 1812.
[18] Cohen, W.M. and Levinthal, D.A. (1990) Absorptive Capacity: A New Perspective on Learning and Innovation. Administrative Science Quarterly, 35, 128-152.
Submit or recommend next manuscript to SCIRP and we will provide best service for you:
Accepting pre-submission inquiries through Email, Facebook, LinkedIn, Twitter, etc. A wide selection of journals (inclusive of 9 subjects, more than 200 journals)
Providing 24-hour high-quality service User-friendly online submission system Fair and swift peer-review system
Efficient typesetting and proofreading procedure
Display of the result of downloads and visits, as well as the number of cited articles Maximum dissemination of your research work