Diffusion tensor tractography of the arcuate fasciculus in
patients with brain tumors: Comparison between
deterministic and probabilistic models
Zhixi Li1, Kyung K. Peck1,2, Nicole P. Brennan1, Mehrnaz Jenabi1, Meier Hsu3, Zhigang Zhang3, Andrei I. Holodny1,4, Robert J. Young1,4
1Department of Radiology, Memorial Sloan-Kettering Cancer Center, New York, USA 2Department of Medical Physics, Memorial Sloan-Kettering Cancer Center, New York, USA
3Department of Epidemiology and Biostatistics, Memorial Sloan-Kettering Cancer Center, New York, USA 4Brain Tumor Center, Memorial Sloan-Kettering Cancer Center, New York, USA
Email: YoungR@mskcc.org
Received 11 November 2012; revised 11 December 2012; accepted 17 December 2012
ABSTRACT
Purpose: The purpose of this study was to compare the deterministic and probabilistic tracking methods of diffusion tensor white matter fiber tractography in patients with brain tumors. Materials and Methods: We identified 29 patients with left brain tumors <2 cm from the arcuate fasciculus who underwent pre- operative language fMRI and DTI. The arcuate fas- ciculus was reconstructed using a deterministic Fi-ber Assignment by Continuous Tracking (FACT) algorithm and a probabilistic method based on an extended Monte Carlo Random Walk algorithm. Tracking was controlled using two ROIs corre- sponding to Broca’s and Wernicke’s areas. Tracts in tumoraffected hemispheres were examined for exten- sion between Broca’s and Wernicke’s areas, ante- rior-posterior length and volume, and compared with the normal contralateral tracts. Results: Probabilistic tracts displayed more complete anterior extension to Broca’s area than did FACT tracts on the tumor-af- fected and normal sides (p < 0.0001). The median length ratio for tumor: normal sides was greater for probabilistic tracts than FACT tracts (p < 0.0001). The median tract volume ratio for tumor: normal sides was also greater for probabilistic tracts than FACT tracts (p = 0.01). Conclusion: Probabilistic tractography reconstructs the arcuate fasciculus more completely and performs better through areas of tu- mor and/or edema. The FACT algorithm tends to underestimate the anterior-most fibers of the arcuate fasciculus, which are crossed by primary motor fi- bers.
Keywords: Diffusion Tensor Imaging; DTI;
Tractography; Probabilistic; FACT; Arcuate Fasciculus;
Brain Tumors
1. INTRODUCTION
The arcuate fasciculus is an important white matter tract that connects the frontal (Broca’s) and temporal (Wer- nicke’s) language regions of the brain. Lesions to the arcuate fasciculus have been associated with language deficits [1-4]. Diffusion tensor imaging (DTI) is an emerging magnetic resonance imaging (MRI) technique that allows visualization and characterization of white matter tracts such as the arcuate fasciculus [5,6]. By modeling the direction and magnitude of water diffusion, DTI encodes the orientation of white matter fibers on a voxel-by-voxel basis [7-9]. Tractography algorithms util- ize the DTI encoded information to reconstruct white matter tracts [10-12]. Tractography algorithms can be broadly divided into two categories: deterministic and probabilistic. FACT is a streamline-based deterministic method that traces pathways from a seed region by fol- lowing the primary eigenvector from one voxel to the next [12,13]. The probabilistic algorithm defines path- ways by generating multiple curves from seed points using a Monte Carlo simulation [14-16]. Probability of connectivity is then assigned to individual voxels based on the frequency with which the curves traverse the vox- els.
tration, and destruction [19]. Probabilistic tractography appears to improve the identification of crossing fibers and the tracking of long white matter tracts such as the arcuate fasciculus [20]. Although several studies have evaluated the use of deterministic or probabilistic tracto- graphy in the reconstruction of the arcuate fasciculus in normal subjects [6,20-23], currently none has applied these techniques to reconstruct the arcuate fasciculus in patients with brain tumors. The purpose of this study is to use both FACT and probabilistic methods to map the arcuate fasciculus connecting two main language tracks (Broca’s area and Wernicke’s area) and to compare the methods when a tumor is located nearby.
2. MATERIALS AND METHODS
Whole-brain DTI was performed to map white matter tracks of arcuate fasciculus in 29 brain tumor patients. FACT and probabilistic tractography algorithms were compared based on the volume of the tracks and connec- tivity in the arcuate fasciculus for both normal and tumor sides. These methods are described in detail below.
2.1. Subjects
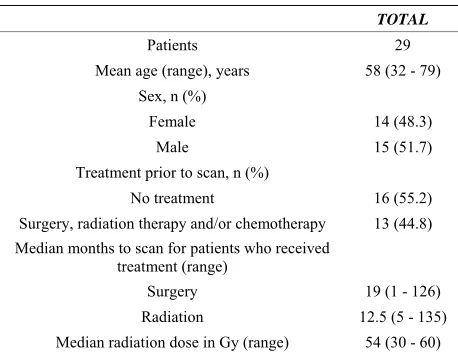
This retrospective study was granted a Waiver of In- formed Consent by the hospital Institutional Review Board and was fully compliant with Health Insurance Portability and Accountability Act regulations. We iden- tified 29 patients (14 females and 15 males; mean 58.5 years, range 32 - 83 years) from May 2007 to June 2011. Each patient had a solitary brain tumor in the left hemi-sphere less than 2 cm from the expected course of the arcuate fasciculus. None of the patients had magnetic resonance (MR) evidence of tumor (enhancement, mass effect or FLAIR hyperintensity) on the right side in the expected location of Broca’s area, Wernicke’s area or the arcuate fasciculus, as determined by a board certified radiologist holding a certificate of added qualification in neuroradiology. Each patient had DTI performed as part of their MRI scan for treatment planning (n = 17), and/or for language difficulties (n = 26) usually expressive aphasia (n = 22). Patient characteristics are summarized
in Table 1. Tumors included twelve glioblastomas, seven
astrocytomas, four oligodendrogliomas, two metastases, two large B-cell lymphomas, one ependymoma and one meningioma. In 13 patients, prior treatments included surgery, chemotherapy and radiation therapy (n = 7), surgery and radiation therapy (n = 2), radiation and che- motherapy, surgery and chemotherapy, surgery, or che- motherapy (n = 1 each).
2.2. Data Acquisition
[image:2.595.309.538.99.276.2]Imaging was performed on a 1.5-Tesla (n = 6) or a
Table 1. Summary of subjects and treatments received.
TOTAL
Patients 29 Mean age (range), years 58 (32 - 79)
Sex, n (%)
Female 14 (48.3)
Male 15 (51.7)
Treatment prior to scan, n (%)
No treatment 16 (55.2)
Surgery, radiation therapy and/or chemotherapy 13 (44.8) Median months to scan for patients who received
treatment (range)
Surgery 19 (1 - 126)
Radiation 12.5 (5 - 135)
Median radiation dose in Gy (range) 54 (30 - 60)
3.0-Tesla (n = 23) magnet (Signa HDx and Excite, GE Medical Systems, Milwaukee, WI) using a standard quadrature head coil. All patients underwent DTI using a single-shot spin-echo echo-planar imaging sequence with 15 (n = 17) or 25 (n = 12) non-collinear gradient direc- tions; TR/TE, 11000-13,500/60-100 ms; matrix, 128 × 128; in-plane resolution, 1.88 × 1.88 mm; slice thickness,
3 mm to cover the whole brain; b-value, 1000 s/mm2;
and NEX, 1. Seventeen patients also underwent fMRI using a single-shot gradient-echo echo-planar imaging sequence (TR/TE, 4000/(30 - 40) ms; matrix, 128 × 128; flip angle, 90˚; slice thickness, 4.5 mm). Block-design language fMRI including phonemic fluency, semantic fluency and verb generation paradigms was analyzed in analysis of functional neuroImages (AFNI) [24]. The standard MRI protocol also included sagittal and axial T1-weighted images; axial T2-weighted, FLAIR and diffu-sion-weighted images; axial gradient-echo or susceptibil-ity-weighted images; and contrast coronal, sagittal and axial T1-weighted images as well as axial 3D spoiled gradient recalled images.
2.3. DTI Data Analysis
Head motion and eddy current issues were initially cor- rected if necessary. Using DTI & FiberTools software [24,25] (Medical Physics, Department of Diagnostic Ra- diology, University Hospital, Freiburg, Germany) im- plemented in MATLAB (Mathworks, Natick, MA), the arcuate fasciculus was reconstructed by applying a de- terministic algorithm based on FACT [12] as well as a probabilistic algorithm similar to the PICO method [16].
2.4. Definition of Seed Regions-of-Interest (ROIs)
every case) and the right hemisphere (normal side) in all patients controlled by the following input variables: 1) if fMRI was performed, two language fMRI-defined seed ROIs (diameter, 8 mm) corresponding to activated re- gions in Broca’s and Wernicke’s areas [22]; 2) if fMRI was not available, seed ROIs (diameter 8 mm) that were approximated by an expert operator (with 3 years ex- perience in functional imaging) under the direct supervi- sion of a board certified radiologist holding a certificate of added qualification in neuroradiology (with 13 years experience) using anatomical landmarks (Brodmann’s area 44 [pars opercularis and pars triangularis of the in- ferior frontal gyrus] for Broca’s area and posterior Brod- mann’s area 22 [posterior superior temporal gyrus] for Wernicke’s area) [26].
2.5. FACT Tractography
For FACT, tracts were traced following the principle eigenvector within each voxel. Termination criteria were: FA ≤ 0.15 and turning angle ≥ 45˚ [22,23]. White matter bundles connecting Broca’s and Wernicke’s areas were selected by using an “and” operation to isolate tracts passing through both ROIs. In cases where the fMRI or anatomical ROIs did not produce a tract in FACT tracto- graphy, the anterior ROI in Broca’s area was replaced by an ROI in the midportion of the arcuate fasciculus in the superior longitudinal fasciculus, on the coronal plane near the rostral corpus callosum and lateral to the corona radiata fibers [23].
2.6. Probabilistic Tractography
The probabilistic method was based on a Monte Carlo Random Walk approach similar to the probabilistic index of connectivity (PICO) implementation [16,20]. In this method, the extended Monte Carlo Random Walk propa- gates a high number of trajectories from each ROI and extracts the directionality of the trajectories passing through each voxel [20]. The frequency with which a voxel is visited by trajectories determines the degree of connectivity to the origin ROI. The number of random walks was set at 100,000. Termination criteria were: FA ≤ 0.15 and fiber length > 150 voxels. A mask containing the corona radiata was generated by the FACT method and removed from the tracking area [20]. Probabilistic maps from Broca’s and Wernicke’s area seed ROIs were multiplied together to obtain a map of the tract connect- ing the two ROIs. Trajectories that started from the two ROIs and travelled in opposite directions were defined as connecting tracts, while trajectories that travelled in the same direction were defined as merging fibers and sepa- rated [20]. The resulting map contained a voxel-by-voxel estimation of the degree of connectivity to both ROIs, and represented the most probable direct pathway be-
tween Wernicke’s and Broca’s areas. Extraneous tracts were removed from the tracking area by an experienced neuroradiologist based on anatomical landmarks using a mask function. In each patient, the same threshold was applied for probabilistic tracts on both the tumor-affected as well as the normal sidesto remove any remaining ex- traneous tracts while retaining the arcuate fasciculus. The threshold chosen varied between patients (mean 5.74 × 10⁻⁴, range 9.21 × 10⁻⁵ to 5.31 × 10⁻³). The variation in threshold was used because of the heterogeneity of the dataset with respect to tumor grade, degree of tract infil- tration, and edema and mass effects on the tracts. Thresh- olding and masking techniques have been described pre- viously [20,27,28].
2.7. Tractography Analysis
Probabilistic and FACT tract volumes were extracted into masks and the number of voxels was calculated. Within patients, probabilistic and FACT tract volumes were compared on each side as well as between sides. The tumor side: normal side probabilistic volume ratio and the tumor side: normal side FACT volume ratio were recorded. For probabilistic tractography, voxels with the highest connectivity were considered those most likely to be part of the connecting bundle between two ROIs. We measured the mean degree of connectivity of voxels that were part of the connecting bundle on the tumor and normal sides.
To evaluate the completeness of the arcuate fasciculus on tumor-affected and normal sides, the FACT and prob- abilistic tracts were scored for their anterior termination in a manner similar to Bernal et al. [23]: 0 = no fibers reached Broca’s area; 1 = few fibers; 2 = most fibers; and 3 = all fibers. The maximum anterior-posterior length of each tract was measured in the sagittal plane by counting the number of voxels in a straight line from the most anterior point of the tract to the most posterior point of the tract. Length ratios were produced by dividing the probabilistic tract length on the tumor side by the prob- abilistic tract length on the normal side, and repeated for the FACT tract lengths.
2.8. Statistical Analysis
Comparisons were performed using Wilcoxon signed- rank tests. Results were also stratified by treatment status and compared with Wilcoxon rank sum tests. To adjust for multiple comparisons, the false discovery rate proce- dure was applied [29]. The p-values were ranked from smallest to largest, compared to false discovery rate sig- nificance thresholds and declared significant when less than the false discovery rate threshold.
text fonts are prescribed; please do not alter them. You may note peculiarities. For example, the head margin in this template measures proportionately more than is custo- mary. This measurement and others are deliberate, using specifications that anticipate your paper as one part of the entire journals, and not as an independent document. Please do not revise any of the current designations.
3. RESULTS
The results are summarized in Table 2. More probabilis-
tic tracts reached Broca’s area than FACT tracts on the tumor side (p < 0.0001). Probabilistic tracts had anterior termination scores = 3 (all reached Broca’s area) in 11/29 (37.9%) cases, and scores = 1 - 2 (few or most tracts) in 14 (48.3%) cases. FACT had scores = 1 - 2 in 3 (10.3%) cases and scores =0 (no tracts reaching Broca’s area) in 26 (89.7%) cases. On the normal side, probabilistic track- ing of the arcuate fasciculus homologue again outper- formed FACT (p < 0.0001). Probabilistic tracts had scores = 3 in 13/29 (44.8%) cases and scores = 1 - 2 in 16 (55.2%) cases, while FACT had scores = 3 in 2/29 (6.9%) cases, = 1 - 2 in 10 (34.5%) cases, and = 0 in 17
(58.6%) cases. Figure 1 shows an example in which the
FACT tract ended before the Broca’s area while the cor- responding probabilistic tract displayed complete exten- sion. Figure 2 demonstrates truncation of the FACT tract
by descending corticobulbar fibers in the region of the centrum semiovale.
The median length ratio of the probabilistic tracts (tumor side: normal side) was 1.00, greater than the me- dian of 0.88 for FACT tracts, (p < 0.0001). The median length ratio of probabilistic: FACT tracts on the tumor
side was 1.27 (p < 0.0001), due to decreased length of the FACT tracts, while the median length ratio of prob- abilistic: FACT on the normal side was 1.09. The median tract volume ratio (tumor: normal) was greater for prob- abilistic tracts at 1.09 than for FACT tracts at 0.77 (p = 0.01). In the example in Figure 3, the FACT tract thins
near the tumor while the probabilistic tract remains ro- bust.
The mean connectivity of the voxels comprising the probabilistic tracts on the tumor side (median 0.043, range 0.016 - 0.38) was not different from that of the probabilistic tracts on the normal side (median 0.046, range 0.019 - 0.079) (p = 0.88). No differences were found between untreated and treated patients (p ≥ 0.06)
(Table 3).
4. DISCUSSION
[image:4.595.60.538.500.726.2]In the current study, we used DTI and probabilistic trac- tography to successfully reconstruct white matter fibers of the arcuate fasciculus in patients with brain tumors. Our results demonstrated that the probabilistic tracto- graphy outperformed the FACT tractography in estimate- ing the extent and degree of connectivity of the arcuate fasciculus affected by brain tumors and/or peritumoral abnormalities. We also found that FACT tended to un- derestimate the extent of the anterior-most fibers of the arcuate fasciculus, where the fibers cross the descending corticobulbar fibers. Localization of the arcuate fascicu- lus is relevant for neurosurgical planning since direct brain stimulation is less reliable for white matter tracts than for grey matter cortical structures [30-32].
Table 2. Summary of results.
Variable Median value (range) Median difference between groups (range) p-value* Probabilistic anterior termination scores (tumor side) 2 (0 - 3)
FACT anterior termination scores (tumor side) 0 (0 - 2) 2 (0 - 3) <0.0001
Probabilistic anterior termination scores (normal side) 2 (0 - 3)
FACT anterior termination scores (normal side) 0 (0 - 3) 2 (0 - 3) <0.0001
Probabilistic length ratio (tumor side: normal side) 1.00 (0 - 1.47)
FACT length ratio (tumor side: normal side) 0.88 (0 - 1.63) 0.09 (−0.016 - 1) <0.0001 Tumor side length ratio (probabilistic: FACT) 1.27 (1 - 2.31)
Normal side length ratio (probabilistic: FACT) 1.09 (1 - 1.59) 0.10 (−0.11 - 4) <0.0001
FACT volume (tumor side) 303 (0 - 916)
FACT volume (normal side) 389 (153 - 877) −79 (−773 - 285) 0.02
Probabilistic volume (tumor side) 600 (0 - 1596)
Probabilistic volume (normal side) 637 (280 - 1080) 51 (−1104 - 742) 0.86
FACT volume ratio (tumor side: normal side) 0.77 (0 - 1.85)
Probabilistic volume ratio (tumor side: normal side) 1.09 (0 - 1.87) −0.28 (−0.76 - 1.36) 0.01 Probabilistic mean connectivity (tumor side) 0.04 (0.02 - 0.38)
Probabilistic mean connectivity (normal side) 0.05 (0.02 - 0.10) 0.00 (−0.03 - 0.33) 0.88
*
Figure 1. Images in a 62-year-old man with pathologically proven glioblastoma. (A) Contrast sagittal T1-weighted image shows a glioblastoma in the centrum semiovale near the middle portion of the arcuate fasciculus; (B) Probabilistic tracking demonstrates the entire course of the arcuate fasciculus; (C) FACT (magenta) fails to reconstruct the anterior-most fibers. Broca’s area, as activated on fMRI, is highlighted in red; (D) Probabilistic and FACT tracts overlaid on the same sagittal slice confirm the absence of anterior fibers in the FACT tract.
Figure 2. Images in a 51-year-old man with pathologically proven glioblastoma. (A) FACT of the arcuate fasciculus (ma- genta) and probabilistic tracking of the corticobulbar fibers (arrow) overlaid on a sagittal contrast T1-weighted image. Probabilistic tracking of the corticobulbar fibers appear at the termination of the anterior FACT fibers; (B) Axial; and (C) Coronal B0 diffusion tensor images show that instead of reach- ing Broca’s area the arcuate fibers (magenta) are prematurely truncated by descending corticospinal and corticobulbar fibers (blue and yellow; arrows) seen with probabilistic tractography.
[image:5.595.59.288.85.267.2]The arcuate fasciculus is thought to connect Wer- nicke’s area and Broca’s area [33], as supported by mod- ern deterministic tractography studies [22,26]. Bernal et al. recently suggested that the rostral termination of the arcuate fasciculus at Broca’s area is less definite than once thought [23]. Using deterministic tractography, the arcuate fasciculus terminated before the putative Broca’s area in 58.3% of normal subjects, and in the remaining cases the connecting fibers were minimal. Rather than terminating in premotor areas and connecting to Broca’s area via a relay station, [23,34] however, the arcuate fas- ciculus is more likely to have prematurely terminated in the centrum semiovale by crossing fibers.
Figure 3. Images in a 58-year-old woman with pathologically proven low grade oligodendroglioma. Axial, coronal and sagit- tal contrast T1 weighted images (A)-(C) and B0 images with FACT tract overlay (magenta, (D)-(F)) show a nonenhancing oligodendroglioma in the left inferior frontal gyrus, with dis- continuity of fibers in the region near the tumor. B0 images with probabilistic tract overlay (G)-(I) show more robust tracts around the tumor.
In the centrum semiovale, fibers from the corticospinal tract, superior longitudinal fasciculus, and interhemispheric callosal fibers meet and cross [35]. Previous studies evaluating the integration of deterministic tractography in surgical navigation have noted an incomplete depic- tion of the corticospinal tract in these regions [36]. While some advanced tractography techniques such as high- angular resolution diffusion imaging, q-ball imaging and diffusion spectrum imaging can resolve fiber crossings [37,38], these methods usually require longer scanning times that may be difficult to achieve in a busy clinical setting, particularly in patients with brain tumors [39].
[image:5.595.58.289.379.455.2]Table 3. Comparison of results from treated and untreated patients.
No Treatment Treatment
Variable Median (range) Median (range) p-value*
FACT scores (tumor side) 0 (0 - 2) 0 (0 - 1) 0.68
Probabilistic scores (tumor side) 2.5 (0 - 3) 2 (0 - 3) 0.16
Probabilistic tract length (tumor side) 37 (21 - 42) 34 (0 - 45) 0.49
FACT tract length (tumor side) 27.5 (6 - 42) 29 (0 - 44) 0.56
FACT tract volume (tumor side) 291.5 (60 - 916) 306 (0 - 742) 0.59
Probabilistic tract volume (tumor side) 705.5 (156 - 1596) 478 (0 - 857) 0.06
Probabilistic tract mean connectivity (tumor side) 0.04 (0.02 - 0.08) 0.05 (0.02 - 0.38) 0.70
mal side by probabilistic tractography, whereas only 12 (41.7%) did by FACT. The findings on the tumor side of the brain were similar and implied that the poor results from FACT on the tumor side were not due solely to the tumor. The large numbers of trajectories traced by the probabilistic method per seed point may have helped compensate for these areas of decreased FA. Our results support the findings of previous investigators [40], who, using high-definition fiber tractography requiring more extensive data collection and computation, successfully depicted the terminations of the arcuate fasciculus at Broca’s and Wernicke’s areas.
Recent studies on the incorporation of DTI tractogra- phy in neurosurgical navigation have predominantly util- ized deterministic tractography for fiber reconstruction [41-45]. Many commercial vendor and third-party soft- ware programs also use deterministic techniques. Previ- ous investigators have reported underestimation of tracts by deterministic tractography in regions near tumors [46]. Despite the known limitations of deterministic tracto- graphy, and the emerging applications of probabilistic and high-definition fiber techniques, the optimal approach to tractography reconstruction remains unclear. Further investigation, including correlation of tractography re- sults with those of intraoperative stimulation studies, are necessary.
We found that the tracts generated by FACT tracto- graphy were smaller in volume in the tumor-affected left hemisphere than in the normal right hemisphere. Tracts generated by probabilistic tractography, however, showed no significant difference in volume between the tumor- affected and normal sides. Because most individuals are left language dominant, the left arcuate fasciculus is normally larger than the right homologue [47,48]. Our results imply that the probabilistic method was able to overcome difficulties in tractography such as decreased FA in tumor regions to generate similar tract volumes between sides. While thresholding directly affects the volume of the probabilistic tracts, the tumor side: normal side tract volume ratio should minimize the confounding effects of thresholding.
Our study had a few potential limitations. First, it was
a small retrospective study involving a heterogeneous cohort of patients with different tumor types, some as yet untreated and the rest previously treated by varying methods. Surgery, chemotherapy and radiation therapy have variable effects on white matter [49-53], which may have affected our tractography results. We attempted to minimize the potential effects of these treatments by only including treated patients whose scans were performed at least 1 month after surgery (median, 19 months) or at least 5 months after radiation therapy (median, 12.5 months). Although surgery and radiation therapy may have local or regional effects (as opposed to chemother- apy that may have more global effects), we found no differences in anterior termination scores, tract volumes, or tract lengths between untreated and treated groups.
Second, malignant gliomas are infiltrative tumors known to invade along white matter tracts and may cause DTI and tractography abnormalities distinct from metastases [54-57]. Metastasis, low-grade glioma and meningioma related edema also do not typically disrupt white matter tracts in DTI studies [56,58]. In our study, the focus of the comparison was on probabilistic versus FACT trac- tography within each patient, rather than between pa- tients, minimizing the influence of tumor grade on the results. The small size of our study, however, precluded comparisons of probabilistic and FACT tractography results between tumor types.
Third, whereas both methods require setting certain threshold values (e.g., turning angle for the FACT method vs. number of walks for the probabilistic method), the probabilistic method also requires manually adjusting threshold values on the connectivity map to exclude ex- traneous tracts. The threshold chosen varied between patients given the heterogeneity of the tumor pathology, meaning that a single common threshold could not be applied on a group-wise basis. However, thresholds were held constant within each patient on both sides of the brain. We also performed within-patient analyses using ratios between sides and between methods to minimize the effects of these intrinsic differences in the recon-struct- tion and display of the arcuate fasciculus.
coding directions used in the acquisition of the dataset varied between 1.5-T and 3.0-T, as well as 15- and 25- directions. In our study, the comparisons of tracts were carried out within patients, rather than between patients. Thus, the differences in field strength and gradient direc- tions should not confound the results.
Lastly, due to the retrospective nature of the study, in- traoperative validation was not available to confirm the reconstructed fibers. Additional work is necessary to validate the reconstructed probabilistic tracts to confirm the location, extent, and function of the arcuate fascicu- lus.
5. CONCLUSION
To the best of our knowledge, this is the first DTIfiber tractography study to compare outcomes from both FACT and probabilistic methods in patients with brain tumors.
Probabilistic tractography outperformed the FACT trac-
tography in estimating the extent and degree of connec- tivity of the arcuate fasciculus language pathway affected by brain tumors and/or peritumoral abnormalities. We also found that FACT tended to underestimate the extent of the anterior-most fibers of the arcuate fasciculus, where the fibers cross the descending corticobulbar fibers. Lo- calization of the arcuate fasciculus is relevant for neuro- surgical planning since direct brain stimulation is less reliable for white matter tracts than for grey matter cor- tical structures.
6. ACKNOWLEDGEMENTS
The authors thank Ms. Ada Muellner for her expert medical editing and advice.
REFERENCES
[1] Breier, J.I., Hasan, K.M., Zhang, W., Men, D. and Pa- panicolaou, A.C. (2008) Language dysfunction after stroke and damage to white matter tracts evaluated using diffu- sion tensor imaging. American Journal of Neuroradiol- ogy, 29, 483-487. HUdoi:10.3174/ajnr.A0846U
[2] Marchina, S., Zhu, L.L., Norton, A., Zipse, L., Wan, C.Y. and Schlaug, G. (2011) Impairment of speech production predicted by lesion load of the left arcuate fasciculus.
Stroke, 42, 2251-2256.
HU
doi:10.1161/STROKEAHA.110.606103U
[3] Yamada, K., Nagakane, Y., Mizuno, T., Hosomi, A., Na- kagawa, M. and Nishimura, T. (2007) MR tractography depicting damage to the arcuate fasciculus in a patient with conduction aphasia. Neurology, 68, 789.
HU
doi:10.1212/01.wnl.0000256348.65744.b2U
[4] Whittle, I.R. and Fraser, D.E. (1991) Resolution of fluent dysphasia following excision of metastatic carcinoma from the arcuate fasciculus. British Journal of Neurosurgery, 5,
647-649. HUdoi:10.3109/02688699109002891U
[5] Catani, M., Jones, D.K. and Ffytche, D.H. (2005) Peri- sylvian language networks of the human brain. Annals of Neurology, 57, 8-16. HUdoi:10.1002/ana.20319U
[6] Rilling, J.K., Glasser, M.F., Preuss, T.M., Ma, X., Zhao, T., Hu, X. and Behrens, T.E.J. (2008) The evolution of the arcuate fasciculus revealed with comparative DTI.
Nature Neuroscience, 11, 426-428. HUdoi:10.1038/nn2072U
[7] Le Bihan, D., Breton, E., Lallemand, D., Grenier, P., Ca- banis, E. and Laval-Jeantet, M. (1986) MR imaging of intravoxel incoherent motions: Application to diffusion and perfusion in neurologic disorders. Radiology, 161,
401-407.
[8] Basser, P.J., Mattiello, J. and LeBihan, D. (1994) MR dif- fusion tensor spectroscopy and imaging. Biophysical Jour- nal, 66, 259-267. HUdoi:10.1016/S0006-3495(94)80775-1U
[9] Moseley, M.E., Cohen, Y., Kucharczyk, J., Mintorovitch, J., Asgari, H.S., Wendland, M.F., Tsuruda, J. and Nor- man, D. (1990) Diffusion-weighted MR imaging of ani- sotropic water diffusion in cat central nervous system.
Radiology, 176, 439-445.
[10] Basser, P.J., Pajevic, S., Pierpaoli, C., Duda, J. and Al- droubi, A. (2000) In vivofiber tractography using DT-MRI
data. Magnetic Resonance in Medicine, 44, 625-632.
HU
doi:10.1002/1522-2594(200010)44:4<625::AID-MRM17 >3.0.CO;2-OU
[11] Shimony, J.S., Snyder, A.Z., Conturo, T.E. and Corbetta, M. (2004) The study of neural connectivity using diffu- sion tensor tracking. Cortex, 40, 213-215.
HU
doi:10.1016/S0010-9452(08)70955-9U
[12] Mori, S., Crain, B.J., Chacko, V.P. and Van Zijl, P.C. (1999) Three-dimensional tracking of axonal projections in the brain by magnetic resonance imaging. Annals of Neurology, 45, 265-269.
HU
doi:10.1002/1531-8249(199902)45:2<265::AID-ANA21 >3.0.CO;2-3U
[13] Mori, S. and van Zijl, P.C.M. (2002) Fiber tracking: Prin- ciples and strategies—A technical review. NMR in Bio- medicine, 15, 468-480. HUdoi:10.1002/nbm.781U
[14] Behrens, T.E.J., Woolrich, M.W., Jenkinson, M., Johan- sen-Berg, H., Nunes, R.G., Clare, S., Matthews, P.M., Brady, J.M. and Smith, S.M. (2003) Characterization and propagation of uncertainty in diffusion-weighted MR imaging. Magnetic Resonance in Medicine, 50, 1077-1088.
HU
doi:10.1002/mrm.10609U
[15] Hagmann, P., Thiran, J.-P., Jonasson, L., Vandergheynst, P., Clarke, S., Maeder, P. and Meuli, R. (2003) DTI map- ping of human brain connectivity: Statistical fibre track- ing and virtual dissection. Neuroimage, 19, 545-554.
HU
doi:10.1016/S1053-8119(03)00142-3U
[16] Parker, G.J., Haroon, H.A. and Wheeler-Kingshott, C.A. (2003) A framework for a streamline-based probabilistic index of connectivity (PICo) using a structural interpreta- tion of MRI diffusion measurements. Journal of Mag- netic Resonance Imaging, 18, 242-254.
HU
doi:10.1002/jmri.10350U
[18] Mori, S., Kaufmann, W.E., Davatzikos, C., et al. (2002)
Imaging cortical association tracts in the human brain us- ing diffusion-tensor-based axonal tracking. Magnetic Re- sonance in Medicine, 47, 215-223.
HU
doi:10.1002/mrm.10074U
[19] Jellison, B.J., Field, A.S., Medow, J., Lazar, M., Shariar Salamat, M. and Alexander, A.L. (2004) Diffusion tensor imaging of cerebral white matter: A pictorial review of physics, fiber tract anatomy, and tumor imaging patterns.
American Journal of Neurordiology, 25, 356-369.
[20] Kreher, B.W., Schnell, S., Mader, I., Il’yasov, K.A., Hen- nig, J., Kiselev, V.G. and Saur, D. (2008) Connecting and merging fibres: Pathway extraction by combining prob- ability maps. Neuroimage, 43, 81-89.
HU
doi:10.1016/j.neuroimage.2008.06.023U
[21] Saur, D., Kreher, B.W., Schnell, S., Kummerer, D., Kell- meyer, P., Vry, M.S., Umarova, R., Musso, M., Glauche, V., Abel, S., Huber, W., Rijntjes, M., Hennig, J. and Weiller, C. (2008) Ventral and dorsal pathways for lan- guage. Proceedings of the National Academy of Sciences of the USA, 105, 18035-18040.
HU
doi:10.1073/pnas.0805234105U
[22] Catani, M., Jones, D.K. and Ffytche, D.H. (2005) Peri- sylvian language networks of the human brain. Annals of Neurology, 57, 8-16. HUdoi:10.1002/ana.20319U
[23] Bernal, B. and Altman, N. (2010) The connectivity of the superior longitudinal fasciculus: A tractography DTI study.
Magnetic Resonance Imaging, 28, 217-225.
HU
doi:10.1016/j.mri.2009.07.008U
[24] Kreher, B., Schnell, S., Hennig, J. and Il’yasov, K. (2006) DTI calculation, fiber-tracking, and combined evaluation consolidated in a complete toolbox. Proceedings of the
12th Annual Meeting of the Organization for Human Brain Mapping, Florence, 11-15 June 2006.
[25] Kreher, B., Henning, J. and Il’yasov, K. (2006) DTI&Fi- ber-Tools: A complete toolbox for DTI calculation, fiber tracking, and combined evaluation. Proceeding of ISMRM
14th International Scientific Meeting, Seattle, 6-12 May
2006.
[26] Glasser, M.F. and Rilling, J. (2008) DTI tractography of the human brain’s language pathways. Cerebral Cortex,
18, 2471-2482. HUdoi:10.1093/cercor/bhn011U
[27] Ciccarelli, O., Behrens, T., Altmann, D.R., Orrell, R.W., Howard, R.S., Johansen-Berg, H., Miller, D.H., Matthews, P.M. and Thompson, A.J. (2006) Probabilistic diffusion tractography: A potential tool to assess the rate of disease progression in amyotrophic lateral sclerosis. Brain, 129,
1859-1871. HUdoi:10.1093/brain/awl100U
[28] Guye, M., Parker, G.J.M., Symms, M., Boulby, P., Wheeler- Kingshott, C.A.M., Salek-Haddadi, A., Barker, G.J. and Duncan, J.S. (2003) Combined functional MRI and trac- tography to demonstrate the connectivity of the human primary motor cortex in vivo. Neuroimage, 19, 1349-
1360. HUdoi:10.1016/S1053-8119(03)00165-4U
[29] Benjamini, Y. and Hochberg, Y. (1995) Controlling the false discovery rate: A practical and powerful approach to multiple testing. Journal of the Royal Statistical Society, Series B (Methodological), 57, 289-300.
[30] Roux, F.E., Boulanouar, K., Ranjeva, J.P., Manelfe, C.,
Tremoulet, M., Sabatier, J. and Berry, I. (1999) Cortical intraoperative stimulation in brain tumors as a tool to evaluate spatial data from motor functional MRI. Inves- tigative Radiology, 34, 225-229.
HU
doi:10.1097/00004424-199903000-00012U
[31] Cosgrove, G.R., Buchbinder, B.R. and Jiang, H. (1996) Functional magnetic resonance imaging for intracranial navigation. Neurosurgery Clinics of North America, 7, 313-
322.
[32] Mueller, W.M., Yetkin, F., Hammeke, T.A., Morris, G.L., Swanson, S.J., Reichert, K., Cox, R. and Haughton, V.M. (1996) Functional magnetic resonance imaging mapping of the motor cortex in patients with cerebral tumors.
Neurosurgery, 39, 515-521.
[33] Geschwind, N. (1970) The organization of language and the brain. Science, 170, 940-944.
HU
doi:10.1126/science.170.3961.940U
[34] Bernal, B. and Ardila, A. (2009) The role of the arcuate fasciculus in conduction aphasia. Brain, 132, 2309-2316.
HU
doi:10.1093/brain/awp206U
[35] Mori, S. and van Zijil, P.C.M. (2002) Fiber tracking: Principles and strategies—A technical review. NMR Bio- medicine, 15, 468-480. HUdoi:10.1002/nbm.781U
[36] Berman, J.I., Berger, M.S., Mukherjee, P. and Henry, R.G. (2004) Diffusion-tensor imaging-guided tracking of fibers of the pyramidal tract combined with intraoperative cor- tical stimulation mapping in patients with gliomas. Jour- nal of Neurosurgery, 101, 66-72.
HU
doi:10.3171/jns.2004.101.1.0066U
[37] Tuch, D.S., Reese, T.G., Wiegell, M.R and Wedeen, V.J. (2003) Diffusion MRI of complex neural architecture.
Neuron, 40, 885-895.
HU
doi:10.1016/S0896-6273(03)00758-XU
[38] Wedeen, V., Reese, T.G., Tuch, D.S., Weigel, M.R., Dou, J.G., Weiskoff, R.M. and Chessler, D. (2000) Mapping fiber orientation spectra in cerebral white matter with fou- rier-transform diffusion MR [abstract]. Proceedings of the 8th Meeting of the International Society for Magnetic Resonance in Medicine, Berkeley, 82.
[39] Ciccarelli, O., Catani, M., Johansen-Berg, H., Clark, C. and Thompson, A. (2008) Diffusion-based tractography in neurological disorders: Concepts, applications, and fu- ture developments. The Lancet Neurology, 7, 715-727.
HU
doi:10.1016/S1474-4422(08)70163-7U
[40] Fernandez-Miranda, J.C., Pathak, S. and Schneider, W. (2010) High-definition fiber tractography and language.
Journal of Neurosurgery, 113, 156-157.
[41] Nimsky, C., Ganslandt, O., Merhof, D., Sorensen, A.G. and Fahlbusch, R. (2006) Intraoperative visualization of the pyramidal tract by diffusion tensor-imaging-based fi- ber tracking. Neuroimage, 30, 1219-1229.
HU
doi:10.1016/j.neuroimage.2005.11.001U
[42] Yu, C.S., Li, K.C., Xuan, Y., Ji, X.M. and Qin, W. (2005) Diffusion tensor tractography in patients with cerebral tumors: A helpful technique for neurosurgical planning and postoperative assessment. Radiology, 56, 197-204.
Kukuyama, H., Hashimoto, N. and Togashi, K. (2006) Corticospinal tract localization: Integration of diffusion- tensor tractography at 3-T MR Imaging with intraopera- tive white matter stimulation mapping-preliminary results.
Radiology, 240, 849-857. HUdoi:10.1148/radiol.2403050916U
[44] Nimsky, C., Ganslandt, O., Hastreiter, P., Wang, R., Ben- ner, T., Sorensen, A.G. and Fahlbusch, R. (2005) Preop- erative and intraoperative diffusion tensor imaging-based fiber tracking in glioma surgery. Neurosurgery, 56, 130- 137.
[45] Berman, J.I., Berger, M., Chung, S.W., Nagarajan, S.S. and Henry, R.G. (2007) Accuracy of diffusion tensor magnetic resonance imaging tractography assessed using intraoperative subcortical stimulation mapping and mag- netic source imaging. Journal of Neurosurgery, 107, 488-
494. HUdoi:10.3171/JNS-07/09/0488U
[46] Kinoshita, M., Yamada, K., Hashimoto, N., Kato, A., Izu- moto, S., Baba, T., Maruno, M., Nishimura, T. and Yo- shimine, T. (2005) Fiber-tracking does not accurately es- timate size of fiber bundle in pathological condition: Ini- tial neurosurgical experience using neuronavigation and subcortical white matter stimulation. Neuroimage, 25, 424-
429. HUdoi:10.1016/j.neuroimage.2004.07.076U
[47] Parker, G.J., Luzzi, S., Alexander, D.C., Wheeler-King- shott, C.A., Ciccarelli, O. and Lambon Ralph, M.A. (2005) Lateralization of ventral and dorsal auditory-language pathways in the human brain. Neuroimage, 24, 656-666.
HU
doi:10.1016/j.neuroimage.2004.08.047U
[48] Nucifora, P.G.P., Verma, R. and Melhem, E.R. (2005) Leftward asymmetry in relative fiber density of the arcu- ate fasciculus. Neuroreport, 16, 791-794.
HU
doi:10.1097/00001756-200505310-00002U
[49] Chapman, C.H., Nagesh, V., Sundgren, P.C., et al. (2012)
Diffusion tensor imaging of normal-appearing white mat- ter as biomarker for radiation-induced late delayed cogni- tive decline. International Journal of Radiation Oncology, Biology and Physics, 82, 2033-2040.
HU
doi:10.1016/j.ijrobp.2011.01.068U
[50] Welzel, T., Niethammer, A., Mende, U., et al. (2008) Dif-
fusion tensor imaging screening of radiation-induced changes in the white matter after prophylactic cranial ir- radiation of patients with small cell lung cancer: First re-
sults of a prospective study. American Journal of Neuro- radiology, 29, 379-383. HUdoi:10.3174/ajnr.A0797U
[51] Mabbott, D.J., Noseworthy, M.D., Bouffet, E., Rockel, C. and Laughlin, S. (2006) Diffusion tensor imaging of white matter after cranial radiation in children for medulloblas- toma: Correlation with IQ. Neuro-Oncology, 8, 244-252.
HU
doi:10.1215/15228517-2006-002U
[52] Abraham, J., Haut, M.W., Moran, M.T., Filburn, S., Le- miuex, S. and Kuwabara, H. (2008) Adjuvant chemo- therapy for breast cancer: effects on cerebral white matter seen in diffusion tensor imaging. Clinical Breast Cancer,
8, 88-91. HUdoi:10.3816/CBC.2008.n.007U
[53] Sijens, P.E., Heesters, M.A., Enting, R.H., et al. (2007)
Diffusion tensor imaging and chemical shift imaging as- sessment of heterogeneity in low grade glioma under te- mozolomide chemotherapy. Cancer Investigation, 25, 706-
710. HUdoi:10.1080/07357900701564028U
[54] Matsukado, Y., MacCarty, C.S. and Kernohan, J.W. (1961) The growth of glioblastoma multiforme (astrocytomas, grades 3 and 4) in neurosurgical practice. Journal of Neurosurgery, 18, 636-644.
HU
doi:10.3171/jns.1961.18.5.0636U
[55] Johnson, P.C., Hunt, S.J. and Drayer, B.P. (1989) Human cerebral gliomas: Correlation of postmortem MR imaging and neuropathologic findings. Radiology, 170, 211-217. [56] Price, S.J., Burnet, N.G., Donovan, T., Green, H.A., Pena,
A., Antoun, N.M., Pickard, J.D., Carpenter, T.A. and Gil- lard, J.H. (2003) Diffusion tensor imaging of brain tu- mours at 3T: A potential tool for assessing white matter tract invasion? Clinical Radiology, 58, 455-462.
HU
doi:10.1016/S0009-9260(03)00115-6U
[57] Kleihues, P. and Cavenee, W.K. (2000) Pathology and genetics of tumours of the nervous system. IARC Press, Lyon.
[58] Wieshmann, U.C., Symms, M., Parker, G.J.M., Clark, C., Lemieux, L., Barker, G. and Shorvon, S. (2000) Diffusion tensor imaging demonstrates deviation of fibres in normal appearing white matter adjacent to a brain tumour. Jour- nal of Neurology, Neurosurgery & Psychiatry, 68, 501-