Munich Personal RePEc Archive
High Frequency Trading and the Warsaw
Stock Exchange Fees’ Structure
-Preliminary Examination
Bławat, Bogusław
September 2012
Online at
https://mpra.ub.uni-muenchen.de/49120/
Bogusław Bławat
HIGH FREQUENCY TRADING AND THE WARSAW STOCK
EXCHANGE FEES
’
STRUCTURE
–
PRELIMINARY
EXAMI-NATION
Introduction
In this forecasting study we examine the possible impact of WSE fees’ structure on the key HFT strategies. Beginning with November 2012 Warsaw Stock Exchange due to infrastructural changes will enable the investors to execute HFT algorithms. This will bring with not only strong improvement to the existing investment possibilities, but also many technical issues, regulatory con-cerns and other questions known to the more developed markets like USA or UK.
One of the critical issues for the HFT players is the impact of transaction costs on their break-even point. Many HFT strategies are based on very small margins and gains to be obtained by thou-sands of operations executed within very short trading period.
Does the WSE fees structure suit to any HFT investing strategy? Will the traders be profitable at all? This questions we are going to investigate upon some HFT strategies back tested with WSE historical data.
As at present WSE has no HFT record, we have to model the possible outcomes by taking the most liquid instruments - WIG20 stock universe. The results are showing up to which level of transac-tion costs (fees charged by the exchange) key HFT strategies are able to break even.
1. Exchange fees and transaction costs
ex-amining in details the exchange fees impact on the transaction costs and profitability calculated and expressed by Sharpe ratio.
We can identify following transparent execution costs:
1.1. Broker commissions
Brokers charge fees and commissions to cover the costs of their businesses like: 1. Trade commissions
2. Interest and financing fees 3. Market data and news charges 4. Analysis and market research charges
Broker commissions can have both fixed and variable components. The fixed component can be a flat commission per month or a flat charge per trade. The variable component is usually propor-tional to the trade size, where higher sizes will incur lower costs. Broker commission depends also on the total, mostly monthly value or quantity of the orders received by broker from a given firm. Some other charges may come for additional premium content like proprietary research or recommendation. Some broker dealers offer “no commission” platforms by pricing in the increased bid-ask spreads. This is mostly the case of FX markets.
Broker commissions typically come in two forms - bundled and unbundled. Bundled commis-sions are usually fixed all-in prices per contract and include the exchanges’ fees, e.g. PLN 0.1 per stock share. In case of unbundled fees, the broker commissions and the exchange fees are calculated and paid separately. For the investor’s point of view the second solution might be of greater interest, as it enables better cost optimization according to the preferred trading strategy.
1.2. Exchange fees
Warsaw Stock Exchange is following this diversification and it has different fees’ plans for both liquidity consumers and liquidity providers (market makers) participants. Both schemes at the time of our examination (August 2012) were as follows:
Table 1. Transaction fees on the cash, future and option market - liquidity consumers
Shares, rights to shares and ETF units
Fixed fee on an order or block trade PLN 1.00
Fee on the value of an order or block trade: < PLN 100,000 0.033%
PLN 100,000÷2,000,000 0.024% > PLN 2,000,000 0.010%
In total on an order or block trade not more than PLN 880 Fee on a block trade in which the same Exchange Member acts as the buyer or the
seller
1/2 of the above fees
Futures contracts
Fixed fee on a contract: WIG 20 index futures PLN 1.70
other index futures PLN 1.70 bond futures PLN 0.48
stock futures PLN 0.34
fx futures PLN 1.70
Options
Fee on option transaction value and minimum and maximum fee on an option
% on transaction value minimum per option maximum per option
index opt. 0.60% PLN 0.20 PLN 1.20 stocks opt. 0.60% PLN 0.04 PLN 0.24
other opt. 0.60% PLN 0.20 PLN 1.20
Source: “Exhibit No. 1 to the Warsaw Stock Exchange Rules (according to legal condition at 1 July 2011) - Exchange Fees Charged from Exchange Members” [http://www.gpw.pl/oplaty_1_en].
It is clearly to seen, that fixed 1.00 PLN fee on an order or block trade may be important cost factor in some HFT strategies based on small price movement of relative “cheep” shares bud char ac-terized by greater volatility.
Table 2. Transaction fees on the cash, future and option market - liquidity providers
Shares included in the WIG20 index and WIG20 ETF units
Fixed fee on an order PLN 0.20
Fee on order value 0.0058%
In total on an order or block trade not more than PLN 175
Shares included in the mWIG40 index and mWIG40 ETF units
Fixed fee on an order PLN 0.10
Fee on order value 0.0034%
In total on an order or block trade not more than PLN 105
Future contracts - session and block trades
Fixed fee on a contract: WIG 20 index futures PLN 0.68 other index futures PLN 0.42
bond futures PLN 0.08
stock futures PLN 0.08 fx futures PLN 0.42
Options - session and block trades
Fee on option transaction value and minimum and maximum fee on an option
% on transaction value minimum per option maximum per option
index opt. 0.15% PLN 0.05 PLN 0.30
stocks opt. 0.15% PLN 0.01 PLN 0.06 other opt. 0.15% PLN 0.05 PLN 0.30 Source: “Exhibit No. 1 to the Warsaw Stock Exchange Rules (according to legal condition at 1 July 2011) - Exchange Fees
Charged from Exchange Members” [http://www.gpw.pl/oplaty_1_en].
2. Modelling transaction costs’ impact
In the presence of transaction costs the portfolio profit profile will be distorted and depending on the transaction costs’ correlation with the portfolio returns, transaction costs may increase overall portfolio risk. We can address this problem simply by specifying costs minimization as:
where is the average of observed trading costs, is the variance of observed trading costs, and specifies the maximum trading cost variance. By changing we can trace out the efficient trad-ing frontier, which is the collection of minimum tradtrad-ing costs for each level of dispersion of tradtrad-ing costs.
Alternatively we can introduce the investor’s risk-aversion coefficient and write the minimi-zation problem as:
As proposed by Engle and Ferstenberg [Engle and Ferstenberg, 2007] we can use the follow-ing optimization framework to address this problem: let denote the proportion of the total portfolio value allocated to the security at the end of period , denote the price of security at the end of period , and denote the cash holdings in the portfolio at the end of period .
At the end of period we can specify the portfolio value as:
After the portfolio rebalancing at the end of each period, its one-period change in the portfolio value from time to can be described as follows:
Under zero interests and zero dividends assumption the change in cash position is strictly due to changes in portfolio composition executed at time at transaction prices for each security :
Increase in the holding position of security , results in a decrease of cash available in the portfolio, therefore the negative sign on the right sign.
where:
is the change in portfolio value due to trading costs and:
is the change in portfolio value due to the active portfolio management. This way we can rewrite the changes in the portfolio at time as:
Now the problem of portfolio optimization in the presence of risk aversion , i.e.
can be rewritten for each period as follows:
The dynamics and interaction of transaction costs and portfolio allocation can be described as follows:
and the ex-ante calculated Sharpe ratio as:
3. Examination
3.1. Data
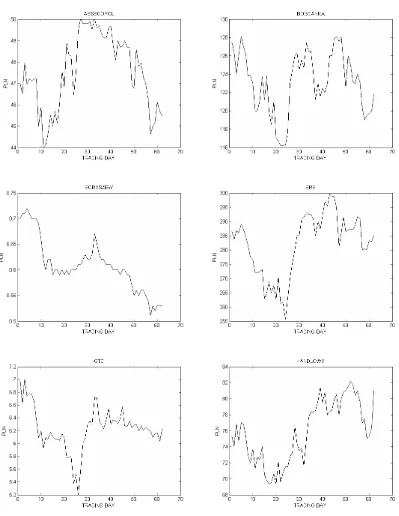
[image:8.595.82.481.248.764.2]We have chosen the WIG20 stock universe as the most liquid set of stock available for the period started 02. May 2012 and ended 31. July 2012 - in total 62 trading days. In particularly the price movements of each stock during this period can be seen as follows:
Source: Author.
3.2. Strategy modelling
We will apply simple mean-reverting strategy as proposed by Khandani and Lo [Khandani and Lo, 2007] with MATLAB numerically solution proposed by Chan [Chan, 2009] and adapted to our research paper.
Let consider a collection of securities and denote by the -vector of their period re-turns and make the assumption, that is a jointly covariance-stationary stochastic proc-ess with expectation
and autocovariance matrices
.
Without loss of generality since we take .
Now consider buying at time stock that were “losers” at time , and selling at time stocks that were winners at time , where winning and losing is determined with respect to the equal-weighted market index
The fraction of the portfolio devoted to security at time is
.
Total investment long or short at time is given by where:
By construction, since the weights sum to zero, portfolio
will be a “dollar-neutral” or “arbitrage” portfolio.
The profit and loss of such strategy, with zero transaction costs assumption, is given by:
and after re-arranging and taking expectations we yield:
We can see, that the expected profits are a function of means, variances, and autocovariance of returns. Such strategy, as shown by Khandani and Lo [Khandani and Lo, 2007], can be very profitable and achieved in 2006 Sharpe ratio of 4.47 (ignoring transaction costs). We have chosen this strategy to apply it to our data and test the costs’ impact on the WIG20 portfolio profitability measured with Sharpe ratio index.
3.3. Results
While calculated Sharpe ratio without exchange fees amounts to 1.6919, after incorporating of transaction fees into our model Sharpe ratio declines to 0.9746. From the HFT investor point of view such result makes it impossible to execute this strategy without losses against any risk free instrument. Let us see what happens if we take of the PLN 1.00 fixed fee paid by “normal” investor on every order or block trade of shares or ETFs. The Sharpe ratio will increase to 1.1119 and this result starts to be interesting from the investor’s point of view.
In case of market maker fees’ plan, the Sharpe ratio calculated for this strategy amounts to 1.5640 and such result could be of interest for every portfolio manager. If we remove the fixed fee component, this strategy may be even more profitable with the ratio of 1.5922
[image:12.595.67.530.633.742.2]We can summarize our results in the following table:
Table 3. Sharpe ratio results for the strategy tested:
Fee plan Fees Sharpe ratio
“No fees” 0 + 0 1.6919
Liquidity consumer (fixed and variable) PLN 1.00 + 0.0330% 0.9746
Liquidity consumer (variable only) 0.0330% 1.1119 Liquidity provider (fixed and variable) PLN 0.20 + 0.0058% 1.5640
Liquidity provider (variable only) 0.0058% 1.5922
The breakeven point of our strategy is 0.03976% (Sharpe ratio 1.0000), which translated into the fee plan for a “normal” investor will result in maximum PLN 0.83 of fixed fee component.
It is clearly to be seen from our examination, that the WSE fees’ structure has to be adjusted to the HFT market. Experience of other more developed financial markets shows, that HFT investors are usually not the liquidity consumers, but by increasing the overall market activity are in fact liquidity providers and this in long term brings lower spreads with it. Therefore, to make the WSE more attrac-tive for HFT investors, it is needed to reconsider its fee plans’ structure.
Literature
1. Chamber of Brokerage Houses in Poland (2012): Analiza opłat na GPW w porównaniu z giełdami europejskimi (Analysis of WSE fees in compare to the other European exchanges),
http://www.idm.com.pl/index.php?p=content_news&kid=38&nid=80.
2. Chan E. P. (2009): Quantitative trading: how to build your own algorithmic trading business.
John Wiley & Sons, New Jersey.
3. Engle, R.F. and Ferstenberg R. (2007): „Execution Risk.“ Journal of Portfolio Management33, 34-45.
4. “Exhibit No. 1 to the Warsaw Stock Exchange Rules (according to legal condition at 1 July 2011) - Exchange Fees Charged from Exchange Members”, http://www.gpw.pl/oplaty_1_en.
5. Khandani A.E. and Lo A.W. (2007): What happened to the quants in August 2007, http://web.mit.edu/alo/www/Papers/august.pdf.
Summary
For the HFT investors the crucial factors of strategy to be applied are the spread value and transaction costs. The goal of our preliminary examination was to see, if the present WSE fee plans are suitable for a typical HFT strategy, like based on statistical arbitrage mean reverse strategy.
Streszczenie
TRADING WYSOKIEJ CZĘSTOTLIWOŚCI A STRUKTURA PROWIZJI GIEŁDY PAPI
E-RÓW WARTOŚCIOWYCH W WARSZAWIE - ANALIZA WSTĘPNA
Dla inwestorów działających w obszarze tradingu wysokiej częstotliwości (HFT) jednym z kluczowych czynników wyboru planowanej strategii jest wysokość spreadów i kosztów transakcy j-nych. Celem naszej analizy wstępnej jest upewnienie się, czy obecne plany opłat giełdowych oferow a-ne przez Warszawską Giełdę Papierów Wartościowych odpowiednie są dla typowej strategii HFT jaką jest arbitraż statystyczny.
Wyliczyliśmy współczynnik Sharpa dla różnych scenariuszy liczonych dla 62 dni giełdowych w okresie od 02.05.2012 do 31.07.2012 w obrębie spółek z indeksu WIG 20. Jednym z ważniejszych otrzymanych rezultatów było potwierdzenie, że dla inwestorów HFT stały komponent opłaty giełd o-wej stanowić będzie najistotniejszy czynnik wyboru strategii. Aby przyciągnąć na parkiet GPW graczy z obszaru tradingu wysokiej częstotliwości, czynnik stały opłaty giełdowej powinien zostać zmnie j-szony, lub, zważywszy przyrost płynności rynku jaki dostarczają inwestorzy HFT, należałoby go zr e-dukować do wartości oferowanej obecnie animatorom rynku.
Author:
Bogusław Bławati
PhD Candidate
Polish Academy of Sciences Department of Economics boguslaw.blawat@yahoo.com
i
Financial support of this research and publication by the “Doctoral Research Fellowships Chance for Development of the