Munich Personal RePEc Archive
Comovement of Selected International
Stock Market Indices:A Continuous
Wavelet Transformation and Cross
Wavelet Transformation Analysis
Masih, Mansur and Majid, Hamdan Abdul
INCEIF, Malaysia, INCEIF, Malaysia
20 December 2013
Online at
https://mpra.ub.uni-muenchen.de/58313/
1.
Professor of Finance and Econometrics, INCEIF, Lorong Universiti A, 59100, Kuala Lumpur, Malaysia,
*Corresponding Author: [email protected]
2.
Ph.D. student at INCEIF.
Comovement of Selected International Stock Market Indices:A Continuous
Wavelet Transformation and Cross Wavelet Transformation Analysis
Mansur Masih
1*Hamdan Abdul Majid2
ABSTRACT
This study accounts for the time-varying pattern of price shock transmission, exploring stock market
co-movements using continuous wavelet coherency methodology to find the correlation analysis
between stock market indices of Malaysia, Thailand (Asian), Greece (Europe) and United States, in
the time-frequency domain of time-series data. We employ the Wavelet Coherence method with the
consideration of the financial crisis episodes of 1997 Asian Financial Crisis, 1998 Russian Sovereign
Debt Default, 9/11 Attack on World Trade Centre US, 2008 US Sub-Prime Mortgage Crisis and the
recent 2010-2011 Greece Debt Crisis. Results tend to indicate that the relations among indices are
strong but not homogeneous across time scales, that local phenomena are more evident than others in
these markets and that there seems to be no quick transmission through markets around the world, but
a significant time delay. The relations among these indices have changed and evolved through time,
mostly due to the financial crises that occurred at different time periods. Results also favour the view
that regionally and economically closer markets exhibit higher correlation and more short run
co-movements among them. The high correlation between the two regional indices of Malaysia and
Thailand, indicates that for the international investors, it is little gain to include both in their portfolio
diversification. Strong co-movement is mostly confined to long-run fluctuations favouring contagion
analysis. This indicates that shocks in the high frequency but low period are short term but shocks in
the low frequency but high period are long term with the trend elements affecting the co-movements
of the indices. The study of market correlations on the frequency-time scale domain using continuous
wavelet coherency is appealing and can be an important tool in decision making for different types of
investors.
KEY WORDS: stock market comovement; continuous wavelet transform; cross-wavelet; wavelet
1. INTRODUCTION – THE MOTIVATION OF THE STUDY
The globalization of trade and liberalization of financial markets around the world is growing since
studies have found recent integration of international stock markets across borders has further
enhanced the recent trend of market integration. As a consequence, business cycles synchronization
and stock correlations are expected to rise over time and across countries. The recent developments in
the global financial markets have shown the importance of risk measurements and co-movements for
the decision of market players. In fact, it was pointed out that in the integrated capital markets, assets
are priced according to a common set of risk and by contrast, prices reflect country-specific factors in
the segmented markets (Boyle,2009).
However, although investors are said to be risk averse, different types of investors have different
motivation and level in terms of the expectation of risk and return to their investment portfolio. The
short term investors would be interested in the high frequency shocks (low time scale) as opposed to
the long term investors who are more interested in the low frequency shocks (high time scale) to the
market. Thus, our co-movement analysis must consider the different expectations of the short and
long-term investors who have different term objectives, especially if we are dealing with international
investors who want to diversify risk and derive high returns from their international portfolios. It can
be argued that from a portfolio diversification point of view, the short-term investor is naturally more
interested in the co-movement of stock returns at higher frequencies, that is, short-term fluctuations,
but the long-term investor focuses on the relationship at lower frequencies (long-term fluctuations).
Diversification strategies performed by international investors also depend on the nature and
magnitude of the existing relationships between different stock markets. Understanding the
interrelations among the various markets is therefore important to diversify risk and to derive high
returns.
This study investigates this relationship, comparing the weekly dynamics of four stock market indices
around the world, namely stock market indices of Malaysia, Thailand, Greece and United States.
Together, they represent the financial crisis episodes of 1997 Asian Financial Crisis, 1998 Russian
devaluation of rouble and its subsequent sovereign debt default, 2008 US Sub-Prime Credit Crunch
Crisis and the recent 2010-2011 Greece Debt Crisis.
As such interestingly, our study will address the following questions:
(1) Do co-movements between the stock markets under study exist and if so, are they
strengthening or weakening during the period studied?
(2) Are the co-movements (correlations) between them time-varying and scale dependent?
(3) Finally, is there short-term or long-term interdependence and contagion (i.e. short term
fluctuations of say, US index prices spill over to Malaysian index prices) and is such
In analysing the co-movements, what effect did the financial crises during the period 1992 to 2011
have on the co-movements between these markets and how did the international investors react. It is
worth noting that it will be significant to determine who (which market) is leading (lagging) who
(which market), precisely when, and the strength of the relationship (indicated by the energy of the
spectrum).
This non-parametric study analysis should reveal whether there is a dominant economy, thus
influencing the other markets. Further, geographically and economically close countries should
exhibit higher levels of market linkages due to the presence of similar investor groups and multi-listed
companies; Did the international (cross border and cross continent) financial crises stimulate stronger
co-movements (correlations) among world markets? Which major stock market dominated? Again,
we would expect the US market to be the exogenous to influence all other markets, given the results
presented by previous studies, with little influence exerted by these markets on the US market (Floros,
2005).
This work extends previous literature in the following important aspects. First, we explore the
potential time-varying behaviour of long run stock market relationships. For the investors to be able to
adequately exploit knowledge of the structure of stock market co-movements, they would need to
possess reliable information on the stability of the observed market linkages.
Financial crisis is conceivably a potential source of structural break in the international stock market
integration. In fact, some analysts suggest the need for exploring the impact of capital market
liberalization and the effects of past episodes of financial crisis as potential sources of instability in
the pattern of stock market linkages (Dungey and Martin, 2007). Second, although the importance of
contemporaneous information transmission among stock markets is well recognized, there is generally
a lack of in-depth analysis of instantaneous price shock transmission in international financial
markets. Such investigation certainly helps us understand the nature of these stock market
relationships which may carry certain implications for the portfolio investment and stock trading.
By applying the continuous time wavelet methodology, we can overcome the problems of
non-stationarity of the time-series signals and the technique can be used to analyse the financial relations
in the short and long run relations (low frequency but high (long) period and high frequency but low
period). Also, by applying the wavelet analysis technique over the Vector Error Correction Model
(VECM), we can look further into the frequency and timescale domain which the VECM is unable to
accommodate.
The main advantage of the cross-wavelet coherency-phase analysis is its ability to analyse transient
dynamics for the association between two time series. Market co-movements can also lead to market
cross-market linkages after a shock to an individual country. There is contagion only if two markets
show a significant increase in co-movement during the crisis periods compared with the periods of
stability. If cross-market co-movements do not increase significantly after the shock, then any
continued level of market correlation only suggests the interdependence between the two economies.
As such, we include in the analysis special historical periods associated with the financial crisis in
order to analyse the co-movement of stock market indices during these periods of time, if any
correlation existed.
We organized this paper as follows. In Section 2 we present a brief literature review about stock
market linkages. Section 3 discusses the methodology used, which explains the main advantages of
wavelet analysis and presents the continuous wavelet transform (CWT) and cross-wavelet transform
(XWT). Wavelet power spectrum, the cross-wavelet power spectrum, wavelet coherency and phase
difference concepts are also presented. In Section 4, we provide data overview in conjunction with
the identification of the most important financial crisis historical dates to analyse markets
co-movements. In Section 5 we produce the empirical results, for the four conventional stock market
indices and the four Islamic indices are discussed. Finally, in Section 6 we provide our conclusions,
including the limitations of the study that future research could enhance the border of knowledge
further.
2. LITERATURE REVIEW
Previous studies discuss the issue of international linkages and cointegration of stock exchanges
(Idier,2008), but they are based on the estimation of a correlation matrix of stock market index returns
and/or on multivariate analysis techniques, such as cointegration theory. Wu and Su (1998) find that
there is a significant dynamic relation among the US, Japan, UK and Hong Kong stock markets. Eun
and Shim (1989) use the same method concluding that USA had a dominant influence over nine other
stock markets. Idier uses the fractal properties of asset returns and present estimation of Markov
switching multi-fractal model (MSM) to give insights about short run and long run dependencies in
stock returns. However, these studies do not concentrate their analysis in the frequency and
time-scale domains. For economic issues, Aguiar-Conraria et al. (2008) use cross-wavelet coherency to
study interactions between time-series at different frequencies and how they evolve over time.
Wavelet analysis has been used extensively. However, for financial and economics, it is a
comparatively new and powerful mathematical tool for signal processing, being an important addition
to time-series methods with practical applications, allowing to decompose relationships in the
time-frequency domain. Their main advantage is the ability to decompose financial time series into their
time scale components and given their translation and scale properties, non-stationarity in the data is
Wavelet theory for international co-movement of stock indices has been applied by Rua and Nunes
(2009) and Lee (2004). Lee (2004) studied international transmission effects between US, Germany
and Japan and two emerging markets, namely Egypt and Turkey. He reports that movements from the
developed markets affected the developing markets but not vice versa. Rua and Nunes (2009) tested
the changing of co-movement over time using monthly data from Germany, Japan, UK and US. The
degree of co-movement of Germany with the US and UK markets are characterized by some
permanent changes over time: a gradual but steady increase of co-movement at lower frequencies and
also a sudden increase after the end of the nineties for other frequencies. They also conclude that
Japan presents a low co-movement with all other countries considered.
However, the previously mentioned authors use discrete wavelet transform versions. The present
work differs from these by using the Continuous Wavelet transform (CWT) technique instead. This
expands a time series into a time frequency space where oscillations can be seen in a highly intuitive
way.
3. THE METHODOLOGY
Use of Wavelet to Dynamically Decompose Time to Time-Frequency Domain
Wavelet is a signal decomposition technique. It is used to decompose (separate) the original time
series into different timescales and by doing that and then studied them separately, we can show that
the causal relationship differs depending on the timescale.
Wavelets take their roots from filtering methods and Fourier analysis. Unfortunately, this technique
was unable to deal adequately with changes in small period of time. Wavelet transform could
overcome these limitations as it is define over general space. Wavelet transform can deal with abrupt
changes in a time-series and enable us to characterize signals by frequency, position in time and the
duration. It maps a function (t), from time domain to the timescale domain through w(t,j)=ψ(.)(t). Here
t is a time index, j a scale and ψ(.) is the wavelet filter used to transform the original signal. The two
basis wavelet filters used are the father function and the mother function. Father wavelet represents
the smooth (low frequency) part of the signal, while the mother wavelet represents the volatile (high
frequency) – low scale, i.e where the ‘noise’ are. Combining information from both time-frequency
domains, they are very flexible turning unnecessary to make strong assumptions concerning the data
generating process for the series under investigation. What makes wavelets interesting and useful is
the fact that its window can be continuously resized. By looking at a signal with a small window only
fine features can be viewed, whereas by looking at the same signal with a large window, the coarse
features will be viewed. Thus, by using wavelets we could see both fine details and approximations.
wavelet, while frequency analysis is performed with a dilated, low-frequency version of the same
wavelet.
There are two classes of wavelet transforms; the continuous wavelet transform (CWT) and its discrete
counterpart (DWT). The DWT is a compact representation of the data and is particularly useful for
noise reduction and data compression, whereas the CWT is better for feature extraction purposes.
Wavelets constructed over short time scales will tend to isolate sharp, high frequency volatility in the
time series. Because of the short time scales, this information will have good time resolution but poor
scale (frequency) resolution. Relatively, long-scale wavelets will tend to capture low frequency
volatility and will have relatively poor time resolution but good scale (frequency) resolution.
Wavelet transforms perform what is called time-frequency analysis of signals, being able to estimate
the spectral characteristics of signals as a function of time. Therefore, it can provide not only the
time-varying power spectrum but also the phase spectrum needed for computation of coherence.
WAVELET COHERENCE
In this paper we have use the wavelet coherence method to analyse the stock indices. Wavelet
coherence measures the local correlation of two time series in the frequency domain. We define the
wavelet coherence (Torrence and Compo (1998)), of two time series, as follows:
𝑅𝑛2(𝑠) = |𝑆(𝑠−
1𝑊
𝑥𝑦(𝑢,𝑠)|2
𝑆(𝑠−1|𝑊
𝑥(𝑢,𝑠)|2) 𝑆(𝑠−1|𝑊𝑦(𝑢,𝑠)|2)
where S is a smoothing operator in both time and scale, which can be written as a convolution in time
and scale S(W)=Sscale(Stime(Wn(s))) where Sscale denotes smoothing along the wavelet scale axis
and Stime smoothing in time (Torrence and Compo, 1998). Thus this will provide a useful tool for
analysis of comovement across the stock markets. The phase difference, indicated by arrows, gives us
details about delays of oscillation of the two examined time series. Arrows pointing to the right when
the time series are in-phase are positively correlated. While arrows pointing to the left when time
series are anti-phase are negatively correlated. Arrow pointing up means that the first time series
leads the second one, arrow pointing down indicates that the second time series leads the first one.
The cross-wavelet coherence gives an indication of the correlation between rotary components that
are rotating in the same direction as a function of time and periodicity. It can be defined as the ratio of
the cross-spectrum to the product of the spectrum of each series, and can be thought of as the local
Coherence is very important when dealing with fluctuating quantities, indicating how closely X and Y
are related by a linear transformation. This happens if and only if their degree of coherence is close to
its maximum value of unity. In time-series, the degree of coherence of two time series x(t) and y(t)
with zero time-average values is the magnitude of their temporal correlation coefficient. Coherence is
like a correlation measure that indicates how strongly the two variables are related at business cycle
frequencies. It ranges from 0 (no correlation; completely incoherent) to 1 (perfect correlation;
completely coherent). The caveat is that this correlation may not be contemporaneous, but may
involve a lead or a lag, being the magnitude measured by the phase lead.
The theoretical distribution of the cross wavelet power of two time series with background power
spectra is given in Torrence and Compo (1998). Therefore, the wavelet power spectrum can be
interpreted as depicting the local variance of a time series, while cross-wavelet power of two times
series depicts the local covariance between these series at each scale or frequency. Cross-wavelet
power reveals areas with high common power. Another useful measure is how coherent the cross
wavelet transform is in the time frequency space.
4. DATA DESCRIPTION AND IDENTIFICATION OF CRISIS
We obtained the weekly prices of stock market indices, namely the Dow Jones (DJ) of Malaysia,
Thailand, Greece and United States from 1992 to 2011. Stock price data were taken from Datastream
(Reuters-Thompson), that has been adjusted given data availability.
However, weekly prices instead of returns are used since the main advantage of wavelet analysis is its
ability to decompose time-series data into their frequency and time-scale components. Due to the
translation and scale properties, non-stationarity in the data is not a problem when using wavelets, and
pre-filtering is not needed. As such, like the works of Floros (2005) and Charles and Darne´ (2006),
our study also uses prices instead of returns.
Table 1. Estimated Unconditional Volatility Matrix of the weekly return of stock market indices
under study
Estimated Unconditional Volatility Matrix 1026 observations used for estimation from 30-Jun-92 to 21-Feb-12 Unconditional Volatilities (Standard Errors) on the Diagonal Elements Unconditional Correlations on the Off-Diagonal Elements ****************************************************************
RDJGREC RDJMALY RDJTHAI RDTUSAM
RDJGREC .047993 .22998 .23845 .41067
RDJMALY .22998 .040940 .52570 .27203
RDJTHAI .23845 .52570 .048584 .30523
RDTUSAM .41067 .27203 .30523 .024405
**************************************************************** For the time-varying conditional volatilities and correlations see the Post Estimation Menu.
Table 1 presents the volatilities and correlation matrix between all four stock market indices under
analysis. It can be seen that the European index is more correlated with the US index than the Asian
stock markets, and that the latter has the highest correlation among them. This is shown by the
Malaysian index having the highest correlation of 0.5257 with the Thailand index.
In summary, less developed markets show lowest correlation values with the most distant indices in
geographical terms. Results for the simple cross correlation analysis of stock index prices indicate that
these stock markets do exhibit a significant degree of integration with each other in accordance with
Rua and Nunes (2009). As argued before, financial crisis also play an important role in stock market
integration. The problem presented by periods of financial crisis is that the fundamental relationship
linking asset returns appear to break down, both across national boundaries and across asset classes.
This presents serious problems for portfolio management as existing diversification strategies can be
undermined by changes in the correlation between assets, leaving portfolios exposed to international
shocks. Typical examples of financial crisis where the crisis has spread across national boundaries and
across asset classes are the Asian financial crisis of 1997–1998; the US 2001 (9/11terrorist attack) and
2002 (Enron accounting scandals and WorldCom fraud) crisis; the Dot-Com Bubble (2000 – 2003);
the Euro zone crisis (20002); the terrorist bombings in Madrid and London (2003-2004); the 2007–
2009 US financial crises (‘subprime crisis’) that has been spread out to the world and finally the
recent Greece debt crisis of 2011. Charles and Darne´ (2006) investigate the effects of the terrorist
attacks in US on September 11, 2001, on international stock markets. They examine 10 daily stock
market indices using the outlier detection methodology, showing that international stock markets
experienced large (permanent and temporary) shocks in response to the terrorist attacks and its
aftermath. They found that US macroeconomic news announcements can have a great impact on the
US and European stock markets by detecting large shocks. Awokuse et al. (2009) investigate the
interdependence of Asian, Japan, US and UK markets using cointegration methods, finding evidence
for an increase in international stock market integration as a result of the 1997 Asian Financial crisis.
Nevertheless, the prolonged downturn of the US stock market was also heavily influenced by a
slowdown of the American economy. Other crises episodes affecting stock markets, with more or less
intensity, were the 2003 Iraq Invasion, the terrorist attacks of Madrid (2004) and London (2005).The
US mortgage crisis and ‘toxic’ loans crisis led to bank collapses in the US and Europe, causing the
amount of available credit to be sharply curtailed, resulting in massive liquidity and solvency crises.
5. EMPIRICAL RESULTS
Until recently when wavelets were applied to the analysis of stock market indices, the use of the
discrete wavelet transform (DWT) or one of its variants dominated (Rua and Nunes, 2009). It was
only recently, that the same type of analysis can be done more easily and in a using the continuous
wavelet transform (CWT).
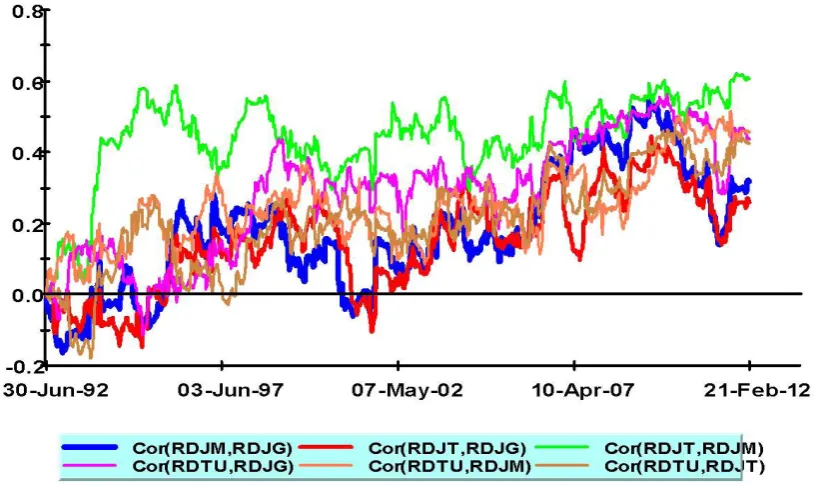
In Figure 1 we can see the correlation between the market indices return for the period 1992 to 2012.
We noticed an upward trend for correlations between all indices. The correlations between the index
return of Malaysia and Thailand is higher as compared to the correlations between Malaysia with
Greece and with USA. The correlation of the index return of Malaysia and Greece is the lowest of the
three. Secondly, the fluctuation in the correlation is the greatest between Malaysia and Thailand, from
zero in 2002 to a highest of 0.6 in 1997 and 2007. The correlation between Malaysia-Greece and
Malaysia-USA was less volatile throughout the period. This confirmed our expectation that index
return of market within a common trade region as Malaysia and Thailand is highly correlated due to
[image:10.595.96.510.432.675.2]the similar characteristics of the regional market.
Figure 1 – Plot of Conditional Volatilities and Correlations using Microfit 5
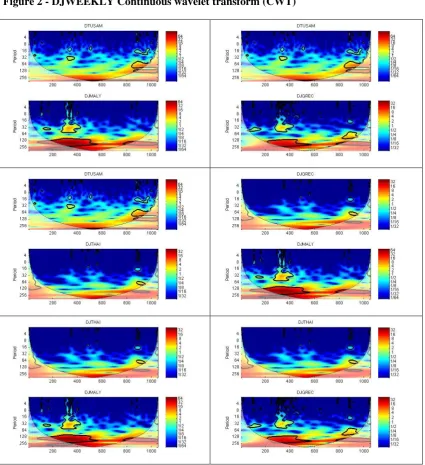
In Figure 2, Wavelet power spectrum of stock market indices: Malaysia (DJMALY), Thailand
(DJTHAI), Greece (DJGREC) and US (DTUSAM) respectively, for the period from 1 January 1992
to 31 December 2011. The scales with its respective dates are;
b. 400 (corresponding to 31/8/1999),
c. 600 (corresponding to 1/7/2003),
d. 800 (corresponding to 1/5/2007) and
e. 1000 (corresponding to 1/3/2011).
In these timescale, we are looking into the major crisis of 1997 Asian financial crisis, 2001 9/11 US
Terrorist attack, 2008 US Sub-prime crisis and 2011 Greece debt crisis. Looking at Figure 2 one can
immediately infer the evolution of the variance for the four stock market indices under analysis at
several time scales along the period 1992–2011 and extract most of the conclusions taken by the
previously mentioned researchers. Figure 2 shows the continuous wavelet power spectrum for the
four stock market indices mentioned.
In the wavelet power spectrum, the black contour in regions with energy indices designates the 5%
significance level (95% confidence level) assuming the bottom red noise defined by the variance and
the number of points of the original time series. The cone of influence, indicating the region affected
by edge effects, is shown with a dotted line. The periods outside the cone of influence must be
neglected since they do not possess statistical confidence.
Finally, colour code for power ranges from blue (low power) to red (high power).
Looking at the time scale decomposition of these variables, some interesting facts are revealed. Most
of the actions in the indices occurred at high scales (low frequencies). There are no clear and general
structural changes occurring for all the series at once in the years under analysis, since the red power
is spread through all of them.
The wavelet power spectrum (WPS) of DTUSAM shows a small significant power event in the period
from 400-600 in the weekly time scale of exceeding 256 days. The WPS of the DJMALY index
shows a highly significant power event from 128-256 days, time-scale band. The WPS of DJGREC
shows no significant high power event. Most of the actions in this index occurred at high scales (more
than six months). Finally, the WPS for the DJTHAI index also shows little the action and mostly
occurred at high scales.
It is clear that different time series have different characteristics in the time-frequency domain, but
volatility for all of them is quite high at low frequencies and low at higher frequencies (mostly at
periodicity until half an year). In the period of 2006–2009, probably as a consequence of the major
financial crisis, the variance of the stock market indices became higher, where the effect is clearer at
medium and high scales, suggesting we were facing medium to long-term shocks in stock market
indices.
Figure 3 Cross-wavelet coherency and phase plots between the Malaysia(DJMALY), Thailand
Figure 4 presents the estimated wavelet coherency and phase difference between the four indices.
Contours denote wavelet-squared coherency, the thick black contour is the 5% significance level and
outside of the thin line is the boundary affected zone. In the cross-wavelet power pictures, colour code
for power ranges from blue (low coherency) to red (high coherency). Vectors indicate the phase
difference between the two series.
All pictures show the cross-coherency between two indices. The name of the index presented first is
the first series, the other one being the second, given that we need to know their order for the
scheme to be valid. Let us just assume that two indices, A and B represent the first and the second
series respectively. When the arrow is pointing to east (right hand side), it is said to be in-phase
(positively correlated), that is both market moves together in the same direction. If the arrow is
pointing west (left hand side), both indices is said to be anti-phase (negatively correlated), that it
both moves in the opposite direction. If the arrow is pointing east and downwards, A is leading B, but
if the arrow is pointing upwards, A is lagging B. The opposite is true if, the arrow is pointing west and
upwards, A is leading B in a negatively correlated situation, but A is lagging B if the arrow is pointing
downwards.
Information on the phases shows us that the relationship among stock market indices was not
homogeneous across scales, since arrows point right and left, down and up constantly. Moreover, the
cross wavelet coherency is high at low frequencies, but in the highest scale of all, most of the
coherence results are not statistically significant since they rely below the cone of influence.
The wavelet cross-coherency shows low–to-medium statistically significant coherence, but we are
still able to observe some islands of medium power, mostly during the 9/11 2001 terrorist attack and
the 2007–2009 Asian financial crisis for most of the indices. For example, in the cross-coherency and
phase plot between DJMALY and DTUSAM we are able to observe an island of high statistically
significant power for the period 200 - 800. However, surprisingly, we see very high significant power
between DJMALY and DJGREC, between 200-1000. This suggest that both series were strongly
correlated and in phase during the period of the throughout all the major crisis mentioned, with the
Malaysia index leading Greece in the 200–600 days band, and Greece leading in the 600-1000 days
band. In between 400 – 800, (ref DTUSAM-DJGREC), US still leads but at lower day frequencies
(high scales) of 64-128 days and both were completely in phase i.e. both first and second series moves
together(with arrows being straight lines) and positively correlated (pointing right). We should also
notice that during the 9/11 terrorist attack and 2003 Madrid bombing, at frequencies 32–128 days, US
and Greece were in phase with US leading, but during the several US sub-prime crisis, at the same
6. CONCLUSION
It is of considerable interest to investors and financial market regulators to examine how vulnerable
stock markets are to different financial shocks. We provide additional evidence on co-movements
(correlations) between capital markets during the financial crises. By employing continuous wavelet
analysis, we could answer our research questions with index market prices and need not use the first
difference of index return. We can see clearly that the market co-movements between the markets
under study do exist and they are strengthening throughout the financial crises period of 1992 to early
2012. The usefulness of wavelet analysis to analyze financial contagion and co-movement is
illustrated, considering that the international investors distinguish between short and long run
relations. We have also demonstrated that the correlations (co-movements) show expected results
when two time-series are further decomposed into frequency-timescale domain. Indices of Malaysia
and Thailand showed no contagion effect but more of inter-dependence in nature. The high correlation
between the two indices, indicates that for the international investors, it is unwise to include both in
their portfolio diversification. Continuous wavelet and cross-wavelet analysis have the ability to
analyze transient dynamics for single time series, or for their association, allowing thus a multivariate
(bivariate) analysis. Strong coherence among stock market indices is found and at high scales the
index prices show a strong and significant relation. However, through the phase analysis, arrows point
to all directions, meaning that even if the series were mostly in phase, the relationship was not
homogeneous across scales and time. As for the third research question, investors might be interested
in knowing that the results point out that shocks in the US and Greece stock markets are not rapidly
transmitted to other markets, which may induce arbitrage opportunities. This could be because the investors took the stand of `wait and see’ attitude, allowing more time to consolidate their holdings, rather than incurring unnecessary transaction cost in response to short term market volatilities.
Moreover, business cycle periods, corresponding to historical financial crisis periods, were identified,
where the series show higher coherence, but mostly at low frequencies, favouring the contagion
hypothesis during these periods. However, it cannot be denied that possible market interdependence
over contagion is noticeable between all the indices studied especially in the high frequency, low time
scale period and the co-movements are unstable. Also, geographically and economically closer
countries exhibit higher levels of market co-movements. Finally, the importance of shock
transmissions has decreased in the last decade, with the exception given for the period 2007–2009.
This work may also be extended in several ways. First, results presented here for the different stock
market indices indicate cases of breaks in co-movements, which may induce that some stock markets
are independent of certain crisis or even benefit from crises elsewhere. The explanation of this
phenomenon could be the flow of information and flow of capital from the crisis market to the
non-crisis market. Further studies in this direction are certainly needed. Finally, the delay in responses
ACKNOWLEDGEMENTS
Empirical work was performed with MATLAB software. In doing so, we humbly acknowledged that
the code for wavelet cross-covariance and cross-correlation (using Big Stats) was from Mustafa Musa
and AbdelKader to whom we would like to say a very big thank you. We would also like to thank
Ginanjar Dewandaru in providing the link to pol.ac.uk for guidance in the interpretation of phase
differences in two time series in the frequency-time scale domain.
REFERENCES
Barunik,J., Vacha,L., and Christoufek,L., European Stock Market Using Wavelet Coherence:
Evidence from High Frequency Data, IES Working Paper: 22/2011, 2011
Candelon,B., Hecq,A.,and Verschoor,W.F.C., Measuring Common Cyclical Features During
Financial Turmoil : Evidence of Interdependence Not Turmoil, 2003
Dungey,M.and Tambakis,D., International Financial Contagion: What Do We Know?, Working Paper
No. 9, 2003
Fernandez, V., CAPM and Value at Risk at Different Time Scales, CEA, 2004
Forbes, K.and Rigobon, R., Measuring Contagion: Conceptual and Empirical Issues, International
Financial Contagion, Springer, 2004
Jammazi,R. and Aloui,C., Wavelet Decomposition and Regime Shifts : Assessing the Effects of
Crude Oil Shocks on Stock Market Returns, Energy Policy, 38 (3), 1415 -1435, 2010
Johansson, A.C., An examination of the Relationship Between Exchange Rates and Stock Price by
Time Scale Decomposition, 2007
Madaleno,M. and Pinho,C., International Stock Market Indices CoMovements: A New Look,
International Journal of Finance and Economics, 17, 89-102, 2012
Masih,M., Alzahrani,M. and Al-Titi,O., Systematic Risk and Time Scale: New Evidence from an
Application of Wavelet Approach to the Emerging Gulf Stock Markets, International Review of
Norsworthy,J.R., Ding Li and Gorener,R., Wavelet-Based Analysis of Time Series: An Export from
Engineering to Finance, Engineering Management Society, Proceedings of the IEEE conference,
126 -132, 2000
Rua,A., and Nunes,L., International Co-Movement of Stock Market Returns; A Wavelet Analysis,