Greenhouse Gas Emissions from Small
Industries
Mohajan, Haradhan
KASBIT Business Journal
22 February 2013
Online at
https://mpra.ub.uni-muenchen.de/50796/
Office of Research, Innovation and Commercialization (ORIC), Khadim Ali Shah Bukhari Institute of Technology (KASBIT)
Greenhouse Gas Emissions from Small Industries
Haradhan Kumar Mohajan
Premier University, Chittagong, Bangladesh
ABSTRACT
This paper discusses mathematical calculations of the greenhouse gas emissions from small industries which cause the global warming in the atmosphere. Due to global warming the ocean levels are increasing, it is estimated that most of the coastal areas of the world will be submerged by 2050, and some insects and animals will be extinct. Very simple calculations are presented here to estimate three greenhouse gases, carbon dioxide, methane, and nitrous oxide emissions from small industry. The emissions from fossil fuels in a small mill are given with mathematical calculations. Emissions from combined heat and power plants are allocated in this paper by using ‘The World Resources Institute and World Business Council for Sustainable Development Efficiency’ method.
JEL. Classification:
Keywords: Greenhouse gas emissions, Biomass, Fossil fuels, Kyoto Protocol 1997.
1. INTRODUCTION
The six gases; Carbon dioxide (CO2), methane (CH4), nitrous oxide (N2O), sulphurhexafluouride (SF6),
hydrofluourocarbon (HFC) and perfluourocarbon (PFC), together constitutes six GHG emissions. When an emission estimate is the sum of several GHGs expressed as the equivalent amount of CO2, the estimate is said to be in CO2
-equivalents (CO2e). CO2e gases covered in the Kyoto Protocol 1997, which is an international agreement linked to
the United Nations Framework Convention on Climate Change (UNFCCC). In environment science CO2e emissions
are defined as the sum of the mass emissions of each individual GHG adjusted for its global warming potential (Environmental Protection Agency, EPA 2011).
Greenhouse gases are often compared on the basis of their estimated potential to cause global warming. Factors
called Global Warming Potentials (GWPs) have been developed, and can be used to convert a quantity of non-CO2
greenhouse gas into an amount of CO2 with an equivalent warming potential. Although the derivation of these
factors involves a large number of assumptions, GWPs are almost universally used to compare one greenhouse gas to another.
In this paper we consider the emissions of three GHGs, CO2, CH4 and N2O, and an emission estimate is the sum of
these three GHGs expressed as in CO2-equivalents (CO2e). The International Council of Forest and Paper
Associations (ICFPA) Climate Change Working Group retained the research institute National Council for Air and Stream Improvement, Inc. (NCASI) to review existing GHG protocols and assist the industry in developing calculation tools for estimating GHG emissions. These industry specific tools should be used in conjunction with an accepted GHG accounting protocol such as the “Greenhouse Gas Protocol” issued by the World Resources Institute/World Business Council for Sustainable Development (WRI/WBCSD), the “Climate Leaders Greenhouse Gas Inventory Protocol Core Module Guidance” issued by the United States Environmental Protection Agency (USEPA), the “Challenge Registry Guide to Entity and Facility-Based Reporting” issued by the Voluntary Challenge and Registry (National Council for Air and Stream Improvement, Inc, NCASI 2005).
Office of Research, Innovation and Commercialization (ORIC), Khadim Ali Shah Bukhari Institute of Technology (KASBIT) primary contributor to rising atmospheric levels of carbon dioxide. In a number of countries of the world, more than half the industry’s energy requirements are faced using biomass fuels (NCASI 2005).
2. GLOBAL GREENHOUSE GAS EMISSIONS ARE INCREASING
Every nation in the world has realized that global warming is due to continuous GHG emissions. The people of the whole world are suffering from the effects of global warming and are projected to suffer much more acute effects as the climate change becomes more severe. Now we illustrate the inventories of three GHGs as follows (Mohajan 2011):
CO2 is the most significant GHG for its natural high atmospheric concentration and heat-trapping abilities. CO2 is
accumulating in the atmosphere due to human activities. Pre-industrial revolution period CO2 was at a level of
280ppm and in 2005 it is increased 35% and is reached to a level of 379ppm (Intergovernmental Panel on Climate Change, IPCC 2007).
CH4 is present in the atmosphere very low compared to CO2 but it is 21 times more potent per unit as a greenhouse
gas (EPA 2006). In the pre-industrial period CH4 was 715ppb (parts per billion) but in 2005 it increased 148% to
reach 1774ppb (IPCC 2007). About half of this increase is due to decomposition of wastes in landfills, natural gas systems, and enteric fermentation (EPA 2006).
N2O is 310 times more potent than CO2 as a heat trapping gas (EPA 2006). Pre-industrial period this gas was
270ppb but in 2005 it increases 18% to reach 319ppb (IPCC 2007). This gas mainly produced from agricultural soil management, mobile combustion, manure management, nitric acid production and human sewage.
Scientific research shows that ice losses from Antarctica and Greenland has accelerated over the last 20 years which will raise the sea level. From satellite data and climate models, scientists calculated that the two polar ice sheets are losing enough ice to raise sea levels by 1.3mm each year and scientists observed that the sea levels are rising by about 3mm per year. By 2006, the Greenland and Antarctic sheets were losing a combined mass of 475Gt (gigatons) of ice per year. If these increases continue water from the two polar ice sheets could have added 15cm to the average global sea level by 2050. So that all the nations especially developed countries must take immediate steps to reduce GHGs to a substantial level. If GHG emissions can not be controlled then the people of most of the countries will suffer for drinking water, shortage of foods and various heat related diseases. Scientists declared that some plants and animals will extinct in the 21st century due to increase global warming (Mohajan 2011).
The National Academy of Sciences (NAS) has expressed its expert opinion that concentrations of CO2 in the
atmosphere have increased and continue to increase more rapidly due to human activity (National Academy of Sciences, NAS 2001, 2010). The NAS cites the burning of fossil fuels is the primary source of anthropogenic CO2
emissions.
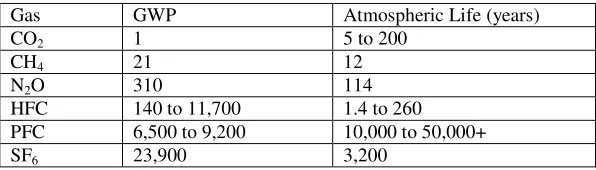
The GWP for CH4 is 21 so, from the standpoint of potential global warming, every gram of CH4 is equivalent to 21
grams of CO2. The following table gives GWPs of six GHGs and atmospheric life in years (NCASI 2005, Sharma
[image:3.595.149.447.608.693.2]2007, Mohajan 2011, 2012b).
Table 1: The GWP of six GHGs, Source: IPCC 2001.
Gas GWP Atmospheric Life (years)
CO2 1 5 to 200
CH4 21 12
N2O 310 114
HFC 140 to 11,700 1.4 to 260
PFC 6,500 to 9,200 10,000 to 50,000+
SF6 23,900 3,200
Office of Research, Innovation and Commercialization (ORIC), Khadim Ali Shah Bukhari Institute of Technology (KASBIT) negative forcing cools it and which can be expressed in watts per square meter, Wm-2 (IPCC 2007). The combined radiative forcing of CO2, CH4 and N2O is +2.30 Wm-2 compared to the radiative forcing of solar irradiance of +0.12
Wm-2. Oceans have warmed from surface of the sea to up to a depth of at least 3km. It is estimated that absorbed 80% of the additional heat added to the climate. Warmer water is taking more spaces of the sea than the colder water, so that sea level is rising alarmingly (Sharma 2007, Mohajan 2011, 2012b).
3. GHG EMISSIONS FROM FOSSIL FUELS IN A SMALL INDUSTRY
3.1 Heat Content of Fuels
Some countries of the world measure fuel according to its gross calorific value (GCV) or higher heating value (HHV), while other countries use net calorific value (NCV) or lower heating value (LHV). The distinction between GCV and NCV arises from the different physical states (liquid or gaseous) of water may be in following combustion. The GCV includes the latent energy of condensation of water following combustion. The NCV is computed for product water in the gaseous state. The latent energy of vaporization of water is deducted from the GCV. When a moist fuel is combusted, two sources of product water exist, the moisture present in the fuel and the water formed from the hydrogen in the fuel during the combustion. The NCV of a fuel at any moisture content can be determined as follows (Kitana and Hall 1989):
NCV
=
(
1
−
M
wet)
(
GCV
solids−
λ
(
M
dry+
9
H
)
)
, (1)where, NCV = net calorific value at any moisture content,
GCVsolids = gross calorific value of dry fuel (zero moisture content),
λ = latent heat of vaporization of water (2.31 MJ/kg at 25°C),
Mwet = moisture content of fuel on a wet basis (expressed as a fraction),
Mdry = moisture content of fuel on a dry basis (expressed as a fraction), and
H = mass fraction of hydrogen in dry fuel (expressed as a fraction).
If the NCV be expressed in terms of dry fuel i.e., to the dry solids in the fuel, then it can be determined from the
GCV of the dry fuel as follows:
NCV
solids=
GCV
solids−
9
λ
H
(2)where, NCVsolids = net calorific value of dry fuel (zero moisture content).
Equation (2) can be used to develop a relationship between NCV and GCV for biomass fuels on a dry basis. A hydrogen content value representative of many wood species is approximately 6% = 0.06 (Browning 1975). A typical NCVsolids value for wood is 20 MJ/kg (IPCC 1997). Hence (2) can be expressed as follows:
NCV
solids= 20MJ/kg dry wood=
GCV
solids−
9× 2.31 MJ/kg water×0.06,
GCV
solids= 21.25 MJ/kg dry wood. (3)From (3) we an approximate relationship between NCVsolidsand GCVsolids as follows:
0
.
95
25
.
21
20
≈
=
solids solids
GCV
NCV
. (4)
Office of Research, Innovation and Commercialization (ORIC), Khadim Ali Shah Bukhari Institute of Technology (KASBIT)
3.2 GHG Emissions from Natural Gas Use at a Mill
Usually a mill uses natural gas in a small boiler and in several infrared dryers. Let the mill used 20 Mm3 (million cubic meters) of natural gas. The mill decides to estimate the emissions from overall natural gas consumption instead of attempting to separate boiler emissions from the infrared dryer emissions. The mill does not know the carbon content of its gas supply, but the IPCC emission factor is 55.9 metric tons CO2/TJ (Tera joule). Let the mill
uses the CH4 and N2O emission factors 5 kg CH4/TJ and 0.1 kg N2O/TJ and let it estimates the heating value of the
natural gas to be 52TJ/kton and the density to be 0.673 kg/m3. The annual emissions being estimated as follows:
CO2 emissions;
20×106 m3 gas/y×0.673 kg/m3 = 13.46 kton gas/y, 13.46 kton gas/y×52TJ/kton = 699.92 TJ/y, and 699.92 TJ/y×55.9 ton CO2/TJ = 39,125.53 ton CO2e/y.
CH4 emissions;
699.92 TJ NCV/y×5 kg CH4/TJ NCV = 3.4996 ton CH4/y.
Using the IPCC GWP of 21, this is equal to 73.491 ton CO2e/y.
N2O emissions;
699.92 TJ NCV/y ×0.1 kg N2O/TJ NCV = 0.069992 ton N2O/y,
Using the IPCC GWP of 310, this is equal to 21.7 ton CO2e/y,
Total GHG emissions = 39,125.53 + 73.491 + 21.7 = 39221 ton CO2e/y.
3.3 GHG Emissions from a Large Dry-bottom, Wall Fired Boiler Burning Pulverized Bituminous Coal Use at a Mill
Let the boiler produces 400,000 kg steam per hour. Over a year’s time, the mill’s records indicate that the boiler consumed 336,000 ton (370,000 short tons) of coal having a higher heating value (HHV), on average, of 13,000 Btu HHV/lb. The mill has information on the carbon content of the coal being burned in the boiler (80.1% carbon by weight). The mill decides that the default IPCC correction for unburned carbon in coal-fired boilers (2% unburned carbon) is appropriate. The IPCC Tier 2 emission factors for dry bottom, wall fired boilers burning pulverized bituminous coal are 0.7 kg CH4/TJ NCV and 1.6 kg N2O/TJ NCV. The mill applies the usual assumption that the
NCV (or LHV) for coal is 5% lower than the GCV (or HHV).
CO2 emissions:
336,000 Mg/y coal×0.801 Mg carbon/Mg coal×0.98 Mg carbon burned ×44Mg CO2 /12 Mg carbon = 967×103t
CO2/y
CH4 emissions:
370,000 short tons coal/y = 740 × 106 pounds/y,
740×106 pounds/y×13,000 Btu HHV/pound = 9.62 × 10¹² Btu HHV/y for coal.
Given that LHV is 0.95 times HHV,
9.62×10¹² Btu HHV/y×0.95 to correct to LHV = 9.14×10¹² Btu LHV/y, 9.14×10¹² Btu LHV/y×1055 J/Btu = 9.64×10¹⁵ J NCV/y = 9.64×10³ TJ NCV/y.
CH4 emissions = 9.64×10³ TJ NCV/y×0.7 kg CH4/TJ NCV = 6.75×10³ kg CH4/y or 6.75 t CH4/y.
Using the IPCC GWP of 21 for CH4, this equals to 142t CO2e/y.
N2O emissions:
N2O emissions = 9.64×10³ TJ NCV/y×1.6 kg N2O/TJ NCV = 15.4t N2O/y.
Using the IPCC GWP of 310 for N2O, is to 4780t CO2e/y.
Office of Research, Innovation and Commercialization (ORIC), Khadim Ali Shah Bukhari Institute of Technology (KASBIT)
3.4 GHG Emissions from a Natural Gas-fired Lime Kiln
A 1000 ton/day kraft mill has a single gas-fired lime kiln. The mill’s records indicate that it used 28.6×10⁶ pounds of gas last year with a typical heat content of 21,000Btu HHV/lb and a density of 0.77kg/m3. The IPCC CO2 emission
factor for natural gas from boilers can be used for lime kilns since the CO2 emissions are a function only of gas
composition. The IPCC CO2 emission factor for natural gas is 55.9t CO2/TJ (after correcting for 0.5% unoxidized
carbon). For CH4, the mill decides to use the only available emission factor for kraft mill lime kilns (2.7 kg CH4/TJ)
and assumes that N2O emissions are negligible based on the IPCC discussion of temperatures needed to generate
N2O. The kiln’s GHG emissions are estimated as follows (NCASI 2005):
CO2 emissions:
28.6×10⁶ pounds gas/y×21,000 Btu HHV/lb = 601×109 Btu HHV/y, for natural gas. Given that LHV is 0.9 times HHV,
601×109 Btu HHV/y×0.9 (to convert to LHV) = 541×109 Btu LHV/y, 541×109 Btu/y×1.055×10-6 GJ/Btu = 570,000 GJ/y = 570 TJ/y, 570 TJ/y×55.9 t CO2/TJ = 31,900t CO2/y.
CH4 emissions:
570 TJ/y×2.7 kg CH4/TJ = 1540 kg CH4/y.
Using the IPCC CO2 equivalency factor of 21, this equals 32t CO2e.
N2O emissions:
IPCC’s analysis of the temperatures needed to form N2O in combustion processes suggests that it is unlikely that
significant amounts of N2O would be formed in lime kilns.
Total GHG emissions = 31,900 + 32 + 0 = 31,900 CO2e/y.
3.5 GHG Emissions when a Mill Operates with a Bark Boiler
A mill has a 250,000 kg steam/hour (550,000 pound/hr) circulating fluidized bed (CFB) bark boiler. In a year, the boiler burns approximately 6.9×10⁶ GJ of bark and 0.8×10⁶ GJ of residual fuel oil. Because the boiler receives supplemental fossil fuel, it is necessary to estimate the CO2 from the fossil fuel use and the CH4 and N2O emissions
based on the total firing rate. The mill decides to use the IPCC emission factor for residual oil (76.6tCO2/TJ, after
correcting for 1% unoxidized carbon) and to estimate CH4 and N2O emissions based on the total firing rate and the
emission factors developed by Fortum on CFB boilers. The average emission factors found by Fortum are 1 kg CH4/TJ and 8.8 kg N2O/TJ.
CO2 emissions from fossil fuel:
0.8×10⁶ GJ/y = 0.8×10³ TJ/y,
0.8×10³ TJ/y×76.6 t CO2/TJ = 61,300t CO2/y.
CH4 emissions:
Total heat input = 6.9×10⁶ GJ/y + 0.8 ×10⁶ GJ/y = 7.7×10⁶ GJ/y = 7.7×10³ TJ/y, 7.7×10³ TJ/y×1 kg CH4/TJ = 7,700 kg CH4/y = 7.7t CH4/y.
Using the IPCC warming potential of 21, this equates to 162t CO2e/y.
N2O emissions:
Total heat input = 7.7×10³ TJ/y,
7.7×10³ TJ/y×8.8 kg N2O/TJ = 67,800 kg N2O/y = 67.8 t N2O/y.
Using the IPCC warming potential of 310, this equates to 21,000t CO2e/y.
Total CO2 equivalents emitted = 61,300 + 162 + 21,000 = 82,500t CO2e/y.
Office of Research, Innovation and Commercialization (ORIC), Khadim Ali Shah Bukhari Institute of Technology (KASBIT) Where electricity is produced by combined heat and power (CHP) systems, it may be necessary to allocate the emissions from the CHP system to the various output energy streams. The efficiency method is one of three methods recommended by World Resources Institute (WRI) and World Business Council for Sustainable Development (WBCSD) (WRI and WBCSD 2004 a,b). Of the two methods the simplified efficiency method is less complex but involves several assumptions about equipment efficiencies. It is expected that the simplified method will be adequate for many mills. The detailed efficiency method is more complicated but can use site-specific design and operating data that companies sometimes have for CHP systems. We will discuss both methods in some details as follows:
4.1 Simplified Efficiency Method
This efficiency method requires use of assumed efficiency factors for the production of power and steam, or actual efficiency factors for each steam or power generation device based on detailed process design and operating information. It is assumed that the efficiency of producing hot water is the same as the efficiency of producing steam. The simplest approach to applying the efficiency method is to assign a single efficiency factor to all power output and a single efficiency factor to all heat output. This information is used to compute an efficiency ratio equal to the heat production efficiency divided by the power production efficiency. For example, if the CHP system produces steam at 90% efficiency and power at 45% efficiency, then the ratio is 2. Emissions from the CHP system are allocated between the heat and power outputs, based on this ratio of efficiencies as follows:
T
eff
H
E
R
P
H
H
E
×
×
+
=
, (5)where
P H eff
e
e
R
=
.Here, EH = emissions share attributable to heat production, t GHG/y,
ET = total emissions from the CHP plant,t GHG/y,
H = heat output,GJ/y,
P = power output,GJ/y,
Reff = ratio of heat production efficiency to power production efficiency,
eH = assumed efficiency of typical heat production (default = 0.8), and
eP = assumed efficiency of typical electric power production (default = 0.35).
The emission share trait to electric power production is assigned from the following relation;
E
P=
E
T−
E
H, (6)where, EP= emissions share attributable to electric power production.
Total System Emissions with WRI/WBCSD Recommended Default Efficiency Factors for the USA (for simplified efficiency method)
Fuel-1:
Natural gas used in Fuel-1 section = 1538 m3/h.
CO2 = 1538 m3/h×0.039 GJ/m3×55.9 kg CO2/GJ = 3353 kg CO2/h,
CH4= 1538 m3/h×0.039 GJ/m3×0.0006 kg CH4 /GJ×21 CO2e/CH4 = 0.76 kg CO2e/h,
N2O = 1538 m3/h×0.039 GJ/m3×0.0001 kg N2O /GJ×310 CO2e/ N2O = 1.86 kg CO2e/h.
Total Fuel-1 emissions = 3356 kg CO2e/h.
Fuel-2:
Office of Research, Innovation and Commercialization (ORIC), Khadim Ali Shah Bukhari Institute of Technology (KASBIT) CO2 = 974 m3/h×0.039 GJ/m3×55.9 kg CO2/GJ = 2123 kg CO2/h.
CH4 = 974 m3/h×0.039 GJ/m3×0.0014 kg CH4 /GJ×21 CO2e/CH4 = 1.12 kg CO2e/h.
N2O = 974 m3/h×0.039 GJ/m3×0.0001 kg N2O /GJ×310 CO2e/ N2O = 1.18 kg CO2e/h.
Total Fuel-2 emissions = 2126 kg CO2e/h.
Total CHP system emissions ET = 3356 + 2126 = 5482 kg CO2e/h.
Total system power output, P = P1 + P2 = 5+3 = 8 MW.
Output heat, H = 15 MW.
The efficiencies for power generation and for steam generation are used in the USA respectively 0.35 and 0.8, then
the ratio of efficiencies be,
35
.
0
8
.
0
=
eff
R
= 2.3.
5482
3
.
2
8
15
15
×
×
+
=
H
E
= 2462 kg CO2e/h= 20,681tCO2e/y at 350 working days/year operation.
EP= 5482 kg CO2e/h - 2462 kg CO2e/h = 3020 kg CO2e/h
= 25,368tCO2e/y at 350 working days/year operation.
Percentage of CHP emissions to heat output =
100
5482
2462
×
= 44.9%.Percentage of CHP emissions to power output =
100
5482
3020
×
= 55.1%.
These percentages can be used to allocate all GHG emissions from the CHP system. Emission factors can be developed for the energy outputs as follows:
Emission factor for CHP heat output = 2462 kg CO2e/hr/15MW = 164.1 kg CO2e/MWh.
Emission factor for CHP power output = 3020 kg CO2e/hr/8MW= 377.5 kg CO2e/MWh.
4.2 Detailed Efficiency Method
Application of the relations in (5) and (6) to allocate GHG emissions among the energy outputs of a simple CHP system which includes only a single heat stream and a single electric power stream may be fairly straightforward. But many industrial CHP systems include multiple heat output streams and incorporate electric power production from multiple generators driven by different motive forces. To use the efficiency method to allocate GHG emissions among the multiple energy outputs of more complex CHP systems (5) and (6) can be modified to more general forms as follows:
T
P P H
H
H
H
E
e
P
e
P
e
H
e
H
e
H
E
×
+
+
+
+
+
=
...
...
2 1 2
1
1 1
2 1 2
1
1
Office of Research, Innovation and Commercialization (ORIC), Khadim Ali Shah Bukhari Institute of Technology (KASBIT) T P P H H P P
E
e
P
e
P
e
H
e
H
e
P
E
×
+
+
+
+
+
=
...
...
2 1 2 1 1 1 2 1 2 1 1 (8) where, 1 HE
= emissions share attributable to heat production as contained in steam stream-1,1
P
E
=emissions share attributable to electric power production via generator-1,ET = total emissions from the CHP plant,
H1= heat output contained in steam stream-1,
H2=heat output contained in steam stream-2,
P1=power output from generator-1,
P2= power output from generator-2,
1
H
e
=overall efficiency of producing heat contained in steam stream-1,2
H
e
=overall efficiency of producing heat contained in steam stream-2,1
P
e
= overall efficiency of producing electric power via generator-1, and2
P
e
=overall efficiency of producing electric power via generator-2.Total System Emissions with WRI/WBCSD Recommended Default Efficiency Factors for the USA (for complex efficiency method)
We have obtained in the simple efficiency method; Total Fuel-1 emissions,
1
F
E
= 3356 kg CO2e/h.Total Fuel-2 emissions,
2
F
E
= 2126 kg CO2e/h.The efficiency for P1, the power output from the gas-fired turbine, has been estimated at 30% = 0.3 based on
information from the manufacturer. Mechanical losses in the gas turbine are approximately 5% =0.05, so the
efficiency of producing the (waste) heat in the turbine exhaust,
e
H=1-0.05-0.3=0.65, or 65% and required heat, H=10.83MW. The emissions from combustion of fuel in the gas-fired turbine can now be allocated between P1 and the
waste heat using (7) and (8), with one hour of operation as the basis for the calculations as follows:
1 1 1 F H P H H
E
e
H
e
P
e
H
E
×
+
=
3356
65
.
0
83
.
10
3
.
0
5
65
.
0
83
.
10
×
+
=
= 1678 kg CO2e,1 1 1 1 1 1 F H P P P
E
e
H
e
P
e
P
E
×
+
=
3356
65
.
0
83
.
10
3
.
0
5
3
.
0
5
×
+
=
= 1678 kg CO2e.Development of efficiency factors for H1 and P2 are complicated by the fact that the CHP system incorporates two
fuel inputs (F1 and F2). Steam energy produced in the heat recovery steam generator (HRSG) is derived from a
combination of waste heat from the gas-fired turbine (heat that originated from part of the energy in fuel stream F1)
Office of Research, Innovation and Commercialization (ORIC), Khadim Ali Shah Bukhari Institute of Technology (KASBIT) from the gas turbine is treated as a fuel and the emissions allocated to this stream (EHeat) are added to the emissions associated with
2
F
E
, and these total emissions2
F
E
are allocated between H1 and P2. The mill has information thatindicates that the efficiency of the HRSG in converting the heat in the turbine exhaust gas into steam energy is 80%. The efficiency associated with combustion of the auxiliary fuel in the duct burner is 100%. This information can be used to develop an overall efficiency of the HRSG as follows:
80
%
90
%
83
.
10
55
.
10
55
.
10
%
100
83
.
10
55
.
10
55
.
10
×
=
+
+
×
+
=
Beff
.In the USA, the efficiency associated with H1 is equivalent to that of producing steam in the HRSG (Hs), 90%. The mill has information indicating that the efficiency of the back pressure steam turbine in converting expansion into mechanical work (isotropic expansion efficiency) is 75%, and the generator which converts the mechanical work into electrical power is 95% efficient. Therefore, the efficiency of producing electrical power output P2 is given by:
eff
B×
eff
Turbine×
eff
Generator= 0.9×0.75×0.95 = 64%.
E
F′=
E
F+
E
Heat2
2 = 2,126+1,678 = 3,804 kg CO2e.
3804
9
.
0
15
64
.
0
3
64
.
0
3
2×
+
=
PE
= 835 kg CO2e,
3804
9
.
0
15
64
.
0
3
9
.
0
15
1×
+
=
HE
= 2,969 kg CO2e.5. CONCLUDING REMARKS
In this paper we have shown the GHG emissions of mills with mathematical calculations in those use biomass and fossil fuels to run the mills. We have followed the techniques of the efficiency methods of World Resources Institute, World Business Council for Sustainable Development, National Council for Air and Stream Improvement, Inc. and Intergovernmental Panel on Climate Change. All the portions of the paper are given with detail and mathematical calculations. The readers can find a concept of total GHG emissions from a small mill. Calculations of GHG emissions from mills are given in various methods. We have used both SI and FPS units to calculate the GHG emissions. Factors called Global Warming Potentials have been developed, and used to convert a quantity of non-CO2 greenhouse gas into an amount of CO2 with an equivalent warming potential.
REFERENCES
Browning, B.L. (ed.). 1975. The Chemistry of Wood, New York: Robert E. Krieger Publishing Company. EPA. 2006. Inventory of U.S. Greenhouse Gas Emissions and Sinks: 1990-2004.
EPA. 2011. PSD and Title V Permitting Guidance for Greenhouse Gases. Office of Air Quality Planning and Standards US Environmental Protection Agency.
IPCC. 1997. Revised 1996 IPCC Guidelines for National Greenhouse Gas Inventories: Reference manual (Vol. 3).
IPCC National Greenhouse Gas Inventory Program.
IPCC. 2001. Climate Change 2001: The Scientific Basis. Technical Summary: C.1 Observed Changes in Globally Well-Mixed Greenhouse Gas Concentrations and Radiative Forcing.
Office of Research, Innovation and Commercialization (ORIC), Khadim Ali Shah Bukhari Institute of Technology (KASBIT) Kitana, O. and Hall, C.W. (eds.). 1989. Biomass Handbook. New York: Gordon and Breach Science Publishers.
Mohajan, H.K. 2011. Greenhouse Gas Emission Increase Global Warming, International Journal of Economic and
Political Integration, 1(2): 21-34.
Mohajan, H.K. 2012a. Present and Future of Biofuels Production for Sustainability, International Journal of Economics and Research, 3(3): 12-23.
Mohajan, H.K. 2012b. Dangerous Effects of Methane Gas in Atmosphere, International Journal of Economic and
Political Integration, 2(1): 3-10.
NAS. 2001. National Academy of Sciences. Climate Change Science.
NAS. 2010. Advancing the Science of Climate Change. Washington, D.C.: National Academies Press.
NCASI. 2005. Calculation Tools for Estimating Greenhouse Gas Emissions from Pulp and Paper Mills-Version 1.1, Research Triangle Park, NC, USA.
Sharma, T. 2007. Greenhouse Gas Emissions: Policy and Economics: A Report Prepared for the Kansas Energy Council.
Winjum, J.K.; Brown, S. and Schlamadinger, B. 1998. Forest Harvests and Wood Products: Sources and Sinks of Atmospheric Carbon Dioxide, Forest Science,44(2):274.
WRI and WBCSD. 2004a. Calculating CO2 Emissions from the Combustion of Standard Fuels and from
Electricity/Steam Purchase-Guide to Calculation Worksheets (February 2004) v2.0. Washington, DC: World Resources Institute. http://www.ghgprotocol.org/standard/tools.htm
WRI and WBCSD. 2004b. Calculating CO2 Emissions from the Combustion of Standard Fuels and from
Electricity/Steam Purchase- Calculation Worksheets (February 2004) v2.0. Washington, DC: World Resources Institute. http://www.ghgprotocol.org/standard/tools.htm
Author's History
* Author is an Assistant Professor at Premier University, Chittagong, Bangladesh. E mail: haradhan_km@yahoo.com
Acknowledgement
Acknowledgement: Author would like to thank the editors and anonymous referees for their comments and insight in improving the draft copy of this article. Author further would like to declare that this manuscript is original, has not previously been published, not currently on offer to another publisher; and willingly transfers its copy rights to the publisher of this journal.
DECLARATION
The material presented by the author does not necessarily represent the viewpoint of editors and the management of Khadim Ali Shah Bukhari Institute of Technology as well (KASBIT) as the author’s institute.