Munich Personal RePEc Archive
Recognizing Contributors: An
Experiment on Public Goods
Samek, Anya and Sheremeta, Roman
26 December 2013
Online at
https://mpra.ub.uni-muenchen.de/52921/
1
Recognizing Contributors: An Experiment on Public Goods
Anya Savikhin Samek a and Roman M. Sheremeta b
a School of Human Ecology, University of Wisconsin-Madison
1300 Linden Drive, Madison, WI 53706, U.S.A.
b Weatherhead School of Management, Case Western Reserve University
and the Economic Science Institute, Chapman University 11119 Bellflower Road, Cleveland, OH 44106, U.S.A.
December 26, 2013
Abstract
We experimentally investigate the impact of recognizing contributors on public good contributions. We vary recognizing all, highest or lowest contributors. Consistent with previous studies, recognizing all contributors significantly increases contributions relative to the baseline. Recognizing only the highest contributors does not increase contributions compared to not recognizing contributors, while recognizing only the lowest contributors is as effective as recognizing all contributors. These findings support our conjecture that aversion from shame is a more powerful motivator for giving than anticipation of prestige.
JEL Classifications: C72, C91, H41
Keywords: public-goods, information, experiments
2 1. Introduction
The desire for social approval is one of the reasons why individuals will act more
generously in public if their generosity is viewable by others (Hollander, 1990). It has been
generally acknowledged that recognizing contributors by revealing their identity increases
contributions to public goods (Andreoni and Petrie, 2004; Rege and Telle, 2004). Social groups,
charity organizations and online communities publicize individuals’ contributions for this reason,
and very few contributions are actually done anonymously. Social recognition has also been
found effective in disparate settings that include voter turnout and blood donation (Gerber et al.,
2008; Lacetera and Macis, 2010).
While there is agreement among researchers and practitioners that recognizing
contributors has a positive effect, the underlying reasons for this effect are less clear.1 The
increase of contributions could be driven by prestige of being recognized as a “high” contributor,
or by shame from being recognized as a “low” contributor. Many organizations publicize the
names of largest donors to take advantage of prestige – e.g., by naming a building after the
highest contributor, or by publicly announcing contributors in categories by size of contribution
(Harbaugh, 1998; Andreoni and Petrie, 2004; Li and Riyanto, 2009). Prestige and shame have
also been explored in field experiments on voter turnout. For instance, Gerber et al. (2010) found
that being reminded that one did not vote in the past (shame) was more effective than being
reminded that one did vote (prestige) on voter turnout. Panagopoulos (2010) compared telling
potential voters that names of non-voters or voters would be published in a newspaper, and found
that publicizing non-voters (shame) had the most pronounced effect. We contribute to this
literature through a series of controlled laboratory experiments that systematically investigate
1 One laboratory experiment that does not find a positive effect of recognition is the experiment of Dufwenberg and
3
whether the effect of recognition on public goods contributions is driven by prestige or by
shame.
Following Andreoni and Petrie (2004), we investigate a public goods setting with a
baseline treatment in which no identifiable information about participants is displayed and a
treatment in which photos and names of participants are displayed. Then we introduce two novel
treatments, where only the highest two or only the lowest two (of five) contributors are identified
in each period. These treatments allow us to disentangle whether it is the aversion from shame or
the anticipation of prestige that causes the observed increase in contributions.
We find that contributions are significantly increased when all contributors are
recognized (i.e., photos and names of all contributors are displayed after the contribution stage)
relative to when contributors are not recognized. We also pinpoint which information is most
effective at increasing contributions. Recognizing only the highest contributors is not
significantly different from not recognizing contributors, while recognizing only the lowest
contributors is as effective as recognizing all contributors. This finding suggests that it is the fear
of shame, rather than the anticipation of prestige, that drives the identification-related increase in
contributions in our experiment.
2. Experimental Environment, Design and Procedures
While the link between the public goods game in the laboratory and social organizations
in the field is imperfect, public goods games have been studied extensively to answer questions
about charitable giving and contributions to social communities (e.g., Ledyard, 1995; Andreoni
and Petrie, 2004; Landry et al., 2006; Chen et al., 2010). In a simple linear public goods game
4
endowments e to contribute to a public good. Individual i’s contribution ci to the public good is
multiplied by m and given to each of n individuals in the group, where 0 < m < 1 and m×n > 1.
The payoff of each individual i is πi = e - (1-m)ci + m∑j≠icj.
We employ the linear public goods game to study how visibility of high and low
contributors impact individual contributions. To this end, we conducted four treatments,
summarized in Table 1: a baseline treatment in which none of the participants are publicly
recognized for their contributions (NONE), a treatment in which all of the participants are
recognized for their contributions (ALL), a treatment in which only the participants who
contribute the highest (higher than the median) amounts are recognized for their contributions
(TOP), and a treatment in which only the participants who contribute the lowest (lower than the
median) amounts are recognized for their contributions (BOTTOM).
Similar to the design of Andreoni and Petrie (2004), we chose to use digital photos to
identify individuals to one another.2 Digital photos capture and preserve the appearance of the
person but do not allow for communication, which may confound the effects of identification
alone. In addition to the photo, we included first names as part of the identification of
individuals. Upon arriving at the lab, each individual wrote his or her first name on a name card,
and the experimenter took a photo of the individual holding up the name card. Each individual
was then randomly assigned to a computer station in the lab. We used z-Tree (Fischbacher,
2007) to record individual decisions and display photos of individuals.
Individuals were assigned to a group of n = 5, and stayed in the same group throughout
the entire experiment, playing a public goods game for a total of 20 periods.3 At the beginning of
2 As one reviewer pointed out, anonymity is a hallmark of laboratory experiments. Making group members known to
one another moves us closer to a field setting.
3 We decided to employ a fixed matching design for several reasons. First, by using fixed matching we amplify the
5
each period, each individual received an endowment of e = 80 experimental francs and was
asked to choose his or her contribution c to the public good. Each individual’s contribution to the
public good was multiplied by m = 0.4 and the total of all contributions given to each of the 5
individuals in the group. Each individual kept the remainder of the 80-franc endowment that he
or she did not allocate to the public good. Individuals did not know others’ decisions before
making their own decisions. After all individuals made their contributions, the computer
displayed the total contribution to the group account and the individual contributions of all 5
group members, sorted by contribution amount from largest to smallest.4
The photos and names of each group member were displayed on the input screen for all
individuals, but we varied the display of identifiable information about contributors on the
outcome screen across treatments. In the NONE treatment, no additional identifiable information
about contributors was revealed (including not revealing/assigning any ID numbers). In the ALL
treatment, the names and photos of each member were displayed below his or her contribution,
such that each individual was recognized and also “ranked” (see Figure 1). In the TOP treatment,
the names and photos of only the top two contributors (those ranked #1 and #2) were displayed
below their contributions. In the BOTTOM treatment, the names and photos of only the bottom
two contributors (those ranked #4 and #5) were displayed below their contributions. Displaying
just the top or bottom two contributors allows us to recognize individuals who contributed above
and below the median contributor in that period, respectively.
create the most conducive environment wherein our conjectures could be tested. Second, individuals repeatedly participate in social groups and online communities, and thus the fixed matching design better represents these environments. Finally, a fixed matching design gives us an opportunity to investigate group dynamics over periods and to maintain independence among the matched groups. However, one potential drawback of our fixed matching design is that some prestige may come from not being identified as a low contributor in the BOTTOM treatment, and some shame may occur from not being identified as a high contributor in the TOP treatment. It would be interesting to see if our results hold when employing a random matching design (which would have controlled of the latter drawback).
4 While social groups of 5 are rarely observed in practice, the choice of small group allows us to assume that all 5
6
The experiment was conducted at the Vernon Smith Experimental Economics
Laboratory. Participants were recruited from a pool of undergraduate students at Purdue
University. A total of 160 individuals participated in 8 sessions, with 20 individuals participating
in each session. All individuals participated in only one session of this study. Some individuals
had participated in other economics experiments that were unrelated to this research. At the end
of the experiment, 2 out of 20 periods were selected for payment using a random draw from a
bingo cage. Experimental francs were used throughout the experiment, with a conversion rate of
20 francs = $1. Individuals earned $14 on average, and sessions (including instruction time)
lasted approximately 60 minutes. Individuals also completed a demographic questionnaire at the
end of each session.
3. Hypothesis Development
Our goal is to document behavior when display of identifiable information is varied. The
standard Nash equilibrium prediction of the linear public goods game is to contribute nothing
(free-ride), i.e. c* = 0. However, most experimental studies find that individuals tend to
contribute significant amounts (see Ledyard et al, 1995; Fehr and Gachter, 2000). A common
explanation is that, in addition to monetary incentives, individuals have intrinsic motivations.
Behavioral arguments for the intrinsic motivation to contribute positive amounts to public goods
include pure altruism, “warm glow” (Andreoni, 1989, 1990), inequality aversion (Fehr and
Schmidt, 1999), fairness and efficiency concerns (Rabin, 1993).5
Revealing individual identities, as in the ALL treatment, may provide an additional
incentive for individuals to contribute to the public good. Indeed, several studies find that
recognizing contributors by revealing their identities increases contributions to public goods
7
(Andreoni and Petrie, 2004; Rege and Telle, 2004; Soetevent, 2005). This is usually attributed to
the fact that individuals are concerned about their social image (Benabou and Tirole, 2006;
Andreoni and Bernheim, 2009; Ariely et al., 2009).6 Therefore, given that in the ALL treatment
individual identities are observable while in the NONE treatment individual identities are
unobservable, we should expect higher contributions in the ALL treatment.
Hypothesis 1: Recognizing all contributors increases contributions to the public good.
In the TOP and BOTTOM treatments, we compare the effect of identifying only the
highest or only the lowest contributors. Identifying top contributors, as in the TOP treatment,
may activate prestige or pride (Hollander, 1990; Gilbert, 1998; Harbaugh, 1998). Pride is a
positive emotion that arises when one is approved of or admired by others (Hollander, 1990;
Gilbert, 1998). Harbaugh (1998) refers to prestige as the increase in utility that comes from
having the amount of a contribution publicly known. We will use the term ‘prestige’ to refer to
any increase in utility from recognition. We conjecture that individuals in our experiment
experience prestige when their contributions are higher than the median and such contributions
are recognized. Therefore, given that in the TOP treatment individuals contributing more than
the median are recognized while in the NONE treatment individual identities are unobservable,
we should expect individuals to increase their contributions in the TOP treatment in order to
achieve higher prestige.
Hypothesis 2: Recognizing the highest contributors increases contributions to the public
good due to prestige.
Another argument for why people give is to avoid feeling shame and guilt (Frank, 1988;
Ketelaar, 2004). Shame may arise when an individual has committed a moral transgression, such
6 Several additional theories of the link between social image concerns and prosocial behavior have been advanced.
8
as choosing to free-ride on others’ contributions. In the literature, shame is defined as an emotion
that induces behavior due to the fear of what others will think, and it is associated with a
decrease in utility due to being believed to have acted inadequately (Tangney et al., 1992;
Keltner and Buswell, 1996; Tadelis, 2011).7 We conjecture that individuals in our experiment
experience shame when their contributions are lower than the median and such contributions are
recognized. Therefore, given that in the BOTTOM treatment individuals contributing less than
the median are recognized while in the NONE treatment individual identities are unobservable,
we should expect individuals to increase their contributions in the BOTTOM treatment in order
to avoid shame.
Hypothesis 3: Recognizing the lowest contributors increases contributions to the public
good due to shame.
4. Experiment Results
4.1. Overview
We use the results of our experiment to test the hypotheses from the previous section.
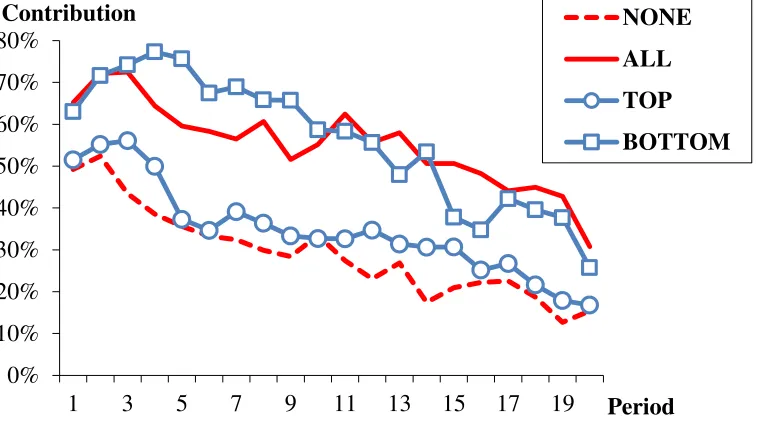
The summary statistics of our experiment are reported in Table 2 and the average contributions
over all 20 periods are displayed in Figure 2. Although contributions are declining over time in
all treatments, they are higher than the standard theoretical benchmark of zero (c* = 0). These
results are consistent with previous studies of public goods games. For example, the results from
7 Similarly, guilt arises when an individual realizes that she has hurt someone with her behavior and perceives
9
our baseline NONE treatment indicate that on average contributions are at 29.3% of the
endowment over all periods. Andreoni (1988, 1995) reported overall contributions at 33.2%,
while Croson (1996) reported contributions at 35.7% of the endowment.
4.2. The Role of Recognition
When comparing contributions in the NONE treatment to contributions in the ALL
treatment, we find that, consistent with Hypothesis 1, recognizing all contributors significantly
increases overall contributions relative to the baseline (Wilcoxon Mann-Whitney test; average
individual contribution over 20 periods as one observation, p-value < 0.01; average group
contribution over 20 periods as one observation, p-value < 0.05). This finding is consistent with
previous findings of Andreoni and Petrie (2004), Rege and Telle (2004) and Soetevent (2005).
For example, while Andreoni and Petrie (2004) report average contributions of 48.1% of
endowment in their recognition treatment, we find marginally higher contributions of 55.3% of
endowment.8 It is interesting to note that our result is different from the result of Filiz-Ozbay and
Ozbay (2013), who find that monetary public goods contributions are not increased by adding a
third-party observer. As conjectured by Filiz-Ozbay and Ozbay, one possible reason for this
discrepancy is that recognition is most relevant when one is identified to members of one’s own
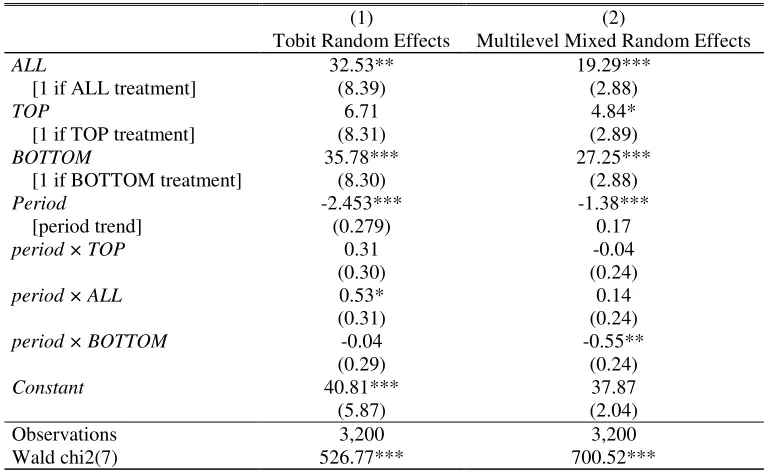
group, rather than to a third party. Our complementary regression analysis reported in Table 3
confirms this result. The coefficient on ALL is significant both in the tobit random effects model
and in the multilevel mixed random effects model.
Result 1: Recognizing all contributors significantly increases contributions relative to no
recognition.
8 One difference between our work and Andreoni and Petrie (2004), is that we use a fixed matching while they use a
10
In the TOP and BOTTOM treatments, we compare the effect of recognizing only the
highest or lowest contributors. We find that displaying the identities of only the highest
contributors, as in the TOP treatment, marginally increases contributions, but average
contributions in this treatment are not significantly different from contributions in the NONE
baseline treatment (Wilcoxon Mann-Whitney test; average individual contribution over 20
periods as one observation, p-value = 0.35; average group contribution over 20 periods as one
observation, p-value = 0.92). In our complementary regression analysis reported in Table 3, the
coefficient on TOP is not significant in the tobit random effects model, and only marginally (at a
10% level) significant in the multilevel mixed random effects model. The tobit results are likely
to be more appropriate since 23% of observations are right censored and 19% are left censored.
These findings indicate that in our experiment, displaying only the top contributors is not an
effective way to increase overall contributions to the public good.
Result 2: Recognizing only the highest contributors does not increases contributions
relative to no recognition.
When comparing contributions between the TOP and ALL treatments, we find that
contributions in the TOP treatment are significantly lower than in the ALL treatment (Wilcoxon
Mann-Whitney test; average individual contribution over 20 periods as one observation, p-value
< 0.01; average group contribution over 20 periods as one observation, p-value = 0.11). This
finding further indicates the ineffectiveness of displaying only the top contributors. It also
suggests that the increase in contribution levels in the ALL treatment relative to the NONE
treatment (Result 1) is not caused by the display of top contributors. A post-estimation Wald test
for the tobit regression in Table 3 confirms that the coefficient on TOP is significantly different
11
The findings from the TOP treatment may seem surprising given the large literature on
prestige and the success of increasing giving through categorizing contributors by size of
contribution (Harbaugh, 1998; Li and Riyanto, 2009). We suggest that one reason why we do not
find a significant effect of prestige is that in our experiment, prestige is relative. That is, one has
to give more than three individuals in the group in order to gain prestige. On the other hand,
when contributors are categorized by gift amount as in Harbaugh (1998), prestige is absolute. In
addition, according to Fischbacher and Gachter (2010), individuals prefer to contribute slightly
below the group average. Perhaps the preference is stronger in the TOP treatment relative to
other treatments. Finally, it is also possible that individuals who give more in the TOP treatment
do not want to be viewed as ‘suckers’, and thus, after being displayed as top contributors, they
may want to reduce their subsequent contributions to the public good. In Section 4.3, we provide
evidence for this conjecture.
In the BOTTOM treatment, we find that displaying the identities of only the lowest
contributors significantly increases contributions relative to both the NONE and TOP treatments
(Wilcoxon Mann-Whitney test; average individual contribution over 20 periods as one
observation, p-value < 0.01; average group contribution over 20 periods as one observation,
p-value < 0.01). Moreover, contributions in the BOTTOM treatment are not significantly different
from contributions in the ALL treatment (Wilcoxon Mann-Whitney test; average individual
contribution over 20 periods as one observation, p-value = 0.55; average group contribution over
20 periods as one observation, p-value = 0.59). This finding indicates that recognizing only the
bottom contributors is an effective way to increase contributions. Moreover, recognizing only the
bottom contributors seems as effective as recognizing all contributors. Post estimation Wald tests
p-12
value < 0.01; coefficient on BOTTOM = coefficient on ALL, p-value = 0.69; coefficient on TOP
= coefficient on ALL, p-value < 0.01).
Result 3: Recognizing only the lowest contributors increases contributions relative to no
recognition, and is not significantly different from recognizing all contributors.
Displaying only the bottom contributors can serve as an exogenous punishment
mechanism for low contributors. It has been shown in the literature that social disapproval or
sanctioning are powerful mechanisms that improve individual contributions to public goods in
anonymous environments (Yamagishi, 1986; Ostrom et al., 1992; Fehr and Gaechter, 2000,
2002; Masclet et al., 2003). Masclet et al. (2003) find that informal sanctions that do not carry a
monetary fine are also effective. Therefore, individuals trying to avoid social disapproval and
shame should contribute sufficient amounts in order to avoid being the lowest contributors. In
Section 4.3, we provide evidence that in the BOTTOM treatment individuals who are seen as
low contributors choose to increase their subsequent contributions to the public good.
The finding that contributions in the TOP treatment are not significantly different from
contributions in the NONE treatment, but contributions in the BOTTOM treatment are
significantly greater than contributions in the NONE treatment, indicates that the effect from
identifying contributors is primarily driven by motivators such as avoiding shame from being a
low contributor, rather than by motivators such as seeking prestige from being a high contributor.
4.3. Dynamics of Contributions
Next, we examine the dynamics of contributions over the duration of the experiment.
Table 4 shows the estimation results of regressions separately for each treatment using the
13
individual’s contribution in the previous period (own-contribution-lag) significantly increases
the individual’s contribution in the current period. Also, we find that in all treatments, being
above the median in the previous period (above-lag) significantly reduces contributions, while
being below the median in the previous period (below-lag) significantly increases contributions
in the current period.9 These findings indicate the presence of conditional cooperation, also
observed in related work (Fischbacher et al., 2001). Conditional cooperators tend to cooperate
when others in the group do so, and tend not to cooperate when they observe defection.
When examining behavior in individual treatments, we find that being above the median
in the TOP treatment is correlated with an expected contribution drop of 17.94, while being
below the median is correlated with an expected contribution increase of only 5.29. This is
consistent with our earlier conjecture that individuals who give more in the TOP treatment do not
want to be viewed as ‘suckers’, and thus, after being displayed as top contributors, they may
want to reduce their subsequent contributions to the public good. On the other hand, we find that
being above the median in the BOTTOM treatment is correlated with an expected contribution
drop of only 9.74, while being below the median is correlated with an expected contribution
increase of 13.72. This is also consistent with our earlier conjecture that individuals trying to
avoid social disapproval and shame should increase their contributions in order to avoid being
the lowest contributors in the BOTTOM treatment.
As evidenced by the significant and negative coefficient on period, contributions decline
over time. Interestingly, we observe a steeper decline in contributions in the most effective
treatment – BOTTOM has both the largest (negative) coefficient on period-trend and the largest
initial contribution rate. Despite the declining trend, we still see significant differences in
9 Since individual contribution information is viewed in all treatments, individuals would always know whether they
14
contributions for the ALL and BOTTOM treatments relative to the NONE and TOP treatments in
the last periods of the experiment. For example, in periods 16-20, we observe average
contribution rates of 34% and 29% in the ALL and BOTTOM treatments, and only 15% and
17% in the NONE and TOP treatments. Using non-parametric tests, the differences between
these contribution levels remain significant between the BOTTOM and NONE treatments, and
between the ALL and NONE treatments.
4.4. Leaders and Laggards
Similar to Gunnthorsdottir et al. (2001) and Andreoni and Petrie (2004), we investigate
the presence of leaders and laggards in our experiment. We use a simple classification system to
discover “leaders” and “laggards,” where a leader is defined as any individual who contributed
60 or more experimental francs (75% of the endowment) and a laggard is defined as any
individual contributed 20 or fewer experimental francs (25% of the endowment) in the first
period.10 The remaining individuals are therefore neither leaders nor laggards. The analysis of
behavior in the first period allows us to consider the effect of visibility of contributors
independent of the reputation that forms when participating in the game over several periods.
We conjecture that recognizing all contributors (as in the ALL treatment) should increase
leaders and decrease laggards relative to no recognition (as in the NONE treatment). In the TOP
treatment, leaders are more likely while laggards are less likely to be revealed, so the proportion
of leaders should be increased but the proportion of laggards should not change relative to the
NONE treatment. In the BOTTOM treatment, leaders are less likely while laggards are more
10 Andreoni and Petrie (2004) use a similar approach of classifying leaders who contributed 15 or more tokens out of
15
likely to be revealed, so the proportion of leaders should not change while the proportion of
laggards should decrease relative to the NONE treatment.
Table 5 shows the distribution of leaders and laggards as a percentage of total number of
individuals. Comparing treatment NONE with ALL, we find that in the ALL treatment there are
almost twice as many leaders (52.5% versus 30.0%), and almost four times fewer laggards
(10.0% versus 35.0%), and these differences are significant.11 Leaders contribute an average of
92.5% of their endowment, while laggards contribute an average of 11.6%.
If individuals care about prestige of being displayed as one of the top two contributors,
we should expect to see a greater number of leaders in the TOP relative to the NONE treatment.
However, we do not find this in the data. The proportion of leaders in both treatments is the
same.12 Moreover, Figure 3, which displays the distribution of contributions in all treatments,
indicates that there are almost no differences in distributions between treatments NONE and
TOP. This finding further supports our earlier suggestion that prestige is not the primary factor
that causes higher contributions from identifying contributors.13
If individuals are concerned about feeling shame by being displayed as one of the
BOTTOM two contributors, we should expect to see a lower number of laggards in the
BOTTOM relative to the NONE treatment. This is exactly what our data indicate. There are
significantly fewer laggards in the BOTTOM than in the NONE treatment (17.5% versus
11 A Chi^2 goodness of fit test has a p-value of 0.04 when comparing leaders, and a p-value of 0.01 when comparing
laggards.
12 Interestingly, there are more laggards in the TOP treatment even compared to the NONE treatment. This may be
because highlighting only the top contributors implicitly emphasizes that the rest of individuals are laggards and thus they should not contribute as much. It is also possible that highlighting only top contributors may implicitly de-emphasize the guilt effect, and thus cause more laggards in the TOP treatment relative to the NONE treatment.
13 This finding also may be due to the fact that prestige is relative in this setting, and depends heavily on
participants’ expectations. If participants do not expect the highest contributors to give over 75% of the endowment,
16
35.0%).14 This finding further supports our conclusion that shame is one of the main factors in
increasing contributions when participants are identified.15 It is also interesting to note that there
are more leaders in the BOTTOM than in the NONE treatment (42.5% versus 30.0%).16 It is
likely that individuals who are trying to avoid shame are doing so by contributing very
substantial amounts, which brings them into the category of leaders. This could be due to the
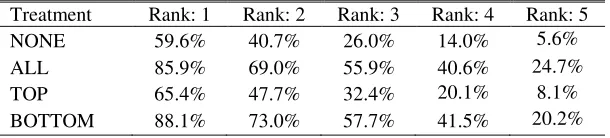
relative nature of being identified as a bottom contributor. Finally, Table 6 provides the
proportion of endowment contributed by ranking across all treatments. Notice that the treatment
shifts up, but does not change the distribution of contribution amounts by ranking.
5. Discussion and Conclusion
We replicate previous findings in the literature, documenting that recognizing
contributors is an effective way to increase contributions to the public goods. Additionally, we
find that the improvement resulting from recognizing only top contributors relative to not
recognizing contributors is marginal and not significant, while recognizing only the lowest
contributors is as effective as recognizing all contributors.
What can explain the fact that recognizing the lowest contributors (the BOTTOM
treatment) is more effective in increasing contributions to the public goods than recognizing the
highest contributors (the TOP treatment)? We conjecture that anticipation of prestige is one of
the main motives for contributing in the TOP treatment, while aversion from shame in one of the
main motives in the BOTTOM treatment. Given that we found that contributions in the
BOTTOM treatment are significantly higher than contributions in the TOP treatment, suggests
14 A Chi^2 goodness of fit test has a p-value of 0.08 when comparing laggards.
15 The proportion of leaders and laggards in the Bottom is not significantly different from the All (p-values are 0.37
and 0.33).
16 This difference is not significant, however. A Chi^2 goodness of fit test has a p-value of 0.25 when comparing
17
that aversion from shame is a more powerful motivator for giving than anticipation of prestige. A
possible explanation for this result is based on the prospect theory of Kahneman and Tversky
(1979). According to the prospect theory, loss aversion causes individuals to weigh losses more
heavily than gains relative to the reference point. In line with this theory, individuals may be
concerned more with avoiding a loss in social image than with seeking a gain in social image
relative to the reference point of the median contributor. Given that prestige represents a gain in
social image while shame represents a loss in social image, we should expect for shame to be a
stronger motivator for giving than prestige. As a consequence, recognizing the lowest
contributors should have a greater effect on increasing contributions than recognizing the highest
contributors (for which we find evidence).17
Because shame appears to be a powerful motivator to contribute, one may ask the
question: why don’t social groups, charity organizations and online communities practice
displaying only bottom contributors? While these institutions face the problem of increasing
contributions, they also face the first-order problem of attracting and retaining contributors.
Given the opportunity of free entry and exit, individuals may simply avoid contributing to
communal and charity groups that identify the lowest contributors.18 Although future work
should explore in detail how the possibility of entry and exit affects contributions, our findings
may be relevant for increasing socially desirable participation and contribution within
organizations or communities when entry and exit is costly or impossible. For example, alumni
donations make up a large portion of a university’s endowment. One becomes an alumnus
17 The loss aversion argument is also in line with findings in the sanction and reward literature. Sefton et al. (2007)
find that monetary rewards by themselves cannot sustain cooperation the way that monetary sanctions can.
18 Related work on monetary sanctions and incentive schemes has similarly identified a preference for bonuses over
18
through receipt of a diploma from a particular university, and it is fairly difficult to remove
oneself from this group due to social ties to fellow alumni. Alumni giving, thus, represents a
potential community in which exit is costly. In this case, alumni organizations may choose to
publish lists of alumni in which both high, low and no gifts are displayed to others.19 In fact, as a
news article recently revealed, senior class gift campaigns at several universities used publicizing
non-givers as a tactic to drive over 99% of students to contribute (relative to 50% when using
standard approaches).20 As noted by the news article, the goal of these campaigns is to encourage
a habit of giving for the long-term, but the long-term effects of these tactics are less clear.
The findings of our experiment also have practical implications for online communities
that rely on user-provided content to be successful. Similar to charity organizations, online
communities can increase contributions of effort through publicly acknowledging members. In
online communities and forums, contributions usually take the form of user-provided content
such as responding to questions on a Question and Answer forum or rating items on the site –
there is a large literature on how to increase contributions online (Ludford et al., 2004; Rafaeli et
al., 2004; Rana and Hinze, 2004; Harper et al., 2007; Yang et al., 2008; Zhang and Zhu, 2011).
For instance, Chen et al. (2010) found that social comparisons affect the behavior of users in.
Our study suggests that if participation by all members of an online community is desired, then
recognizing all, rather than only top, contributors may be most effective.
The observed effects of inducing prestige and shame through recognition are of general
importance. Recognition may play a role in maintaining social norms in diverse settings such as
charity contributions, online community participation, team production, health choices and
collective action. Therefore, we see a lot of potential in this area of research. Specifically, as we
19 Of course, these lists could be prohibitively long for larger universities, which is why these lists could be
published online.
19
have already noted, future research should address the questions of how the possibility of entry
and exit affects contributions when contributors are recognized (ALL versus TOP versus
BOTTOM). Note also that identifying highest two, rather than highest one, contributors may
dampen the effect of prestige. Similarly, identifying the lowest two, rather than lowest one,
contributors may dampen the effect of shame. While we believe that the relative (TOP versus
BOTTOM) findings of our study would not change, identifying the top one or the bottom one
20 Acknowledgements
21 References
Andreoni J. & Bernheim, D. (2009). Social image and the 50-50 norm: A theoretical and experimental analysis of audience effects. Econometrica, 77, 1607-1636.
Andreoni, J. (1989). Giving with Impure Altruism: Applications to Charity and Ricardian Equivalence. Journal of Political Economy, 97, 1447-1458.
Andreoni, J. (1990). Impure Altruism and Donations to Public Goods: A Theory of Warm-Glow Giving. Economic Journal, 100, 464-477.
Andreoni, J., & Petrie, R. (2004). Public goods experiments without confidentiality: a glimpse into fund-raising. Journal of Public Economics, 88, 1605-1623.
Ariely, D., Bracha, A., & Meier, S. (2009). Doing good or doing well? Image motivation and monetary incentives in behaving prosocially. American Economic Review, 99, 544-555.
Baumeister, R.F., Stillwell, A.M., & Heatherton, T.F. (1994). Guilt: An interpersonal approach. Psychological Bulletin, 115, 243-267.
Benabou, R., & Tirole, J. (2006). Incentives and prosocial behavior. American Economic Review, 99, 544-555.
Broberg, T., Ellingsen, T., & Johannesson, M. (2007). Is generosity involuntary? Economics Letters, 94, 32-37.
Broucek, F.J. (1991). Shame and the Self. New York: Guilford Press.
Carpenter, J. (2007). Punishing free-riders: How group size affects mutual monitoring and the provision of public goods. Games and Economic Behavior, 60, 31-51.
Charness, G., & Gneezy, U. (2008). What's in a name? Anonymity and social distance in dictator and ultimatum games. Journal of Economic Behavior and Organization, 68, 29-35.
Chen, Y., Harper, F.M., Konstan, J., & Li, S.X. (2010). Social Comparisons and Contributions to Online Communities: A Field Experiment on MovieLens. American Economic Review, 100, 1358–98.
Chen, Y., Ho, T.H., & Kim, Y.M. (2010). Knowledge Market Design: A Field Experiment at Google Answers. Journal of Public Economic Theory, 12, 641–664.
Croson, R.T.A. (1996). Partners and strangers revisited. Economics Letters, 53, 25-32.
de Hooge, I.E., Zeelenberg, M., & Breugelmans, S.M. (2007). Moral sentiments and cooperation: Differential influences of shame and guilt. Cognition and Emotion, 21, 1025-1042.
Duffy, J., & Kornienko, T. (2010). Does competition affect giving? Journal of Economic Behavior and Organization, 74, 82-103.
Dufwenberg, M., & Muren, A. (2006). Generosity, anonymity, gender. Journal of Economic Behavior and Organization, 61, 42-49.
Fehr, E., & Gachter, S. (2000). Cooperation and Punishment in Public Goods Experiments. American Economic Review, 90, 980-994.
Fehr, E., & Gaechter, S. (2002). Altruistic Punishment in Humans. Nature, 415, 137-140.
Filiz-Ozbay, E. & Ozbay, E. (2013). Effect of an Audience in Public Goods Provision. Experimental Economics, forthcoming.
Fischbacher, U and Gachter, S. (2010). Social preferences, beliefs, and the dynamics of free riding in public good experiments, American Economic Review, 100, 541-56.
22
Funk, P. (2010). Social incentives and voter turnout: evidence from the Swiss mail ballot system. Journal of the European Economic Association, 8, 1077-1103.
Gabaix, X., Laibson, D., Moloche, G., & Weinberg, S. (2006). Costly information acquisition: Experimental analysis of a boundedly rational model. American Economic Review, 1043-1068.
Gerber, A.S., Green, D.P., & Larimer, C.W. (2008). Social Pressure and Voter Turnout: Evidence from a Large-Scale Field Experiment. American Political Science Review, 102, 33-48.
Gerber, A.S., Green, D.P., & Larimer, C.W. (2010). An Experiment Testing the Relative Effectiveness of Encouraging Voter Participation by Inducing Feelings of Pride or Shame. Political Behavior, 32, 409-422.
Gilbert, P. (1998). What is shame? Some core issues and controversies. In P. Gilbert & B. Andrews (Eds), Shame: Interpersonal behaviour, psychopathology and culture (pp. 3– 38). New York: Oxford University Press.
Glazer, A., & Konrad, K. (1996). A signaling Explanation for Charity. American Economic Review, 86, 1019-1028.
Groves, T., & Ledyard, J. (1977). Optimal Allocation of Public Goods: A Solution to the Free Rider Problem. Econometrica, 45, 783-809.
Gunnthorsdottir, A., Houser, D., & McCabe, K. (2007). Disposition, history and contributions in public goods experiments. Journal of Economic Behavior and Organization, 62, 304-315. Harbaugh, W. (1998). The prestige motive for making charitable transfers. American Economic
Review, 88, 277-282.
Harper, F.M. (2007). Encouraging Contributions to Online Communities with Personalization and Incentives. Lecture Notes in Computer Science, 4511, 460.
Harper, F.M., Li, S.X., Chen, Y., & Konstan, J.A. (2007). Social comparisons to motivate contributions to an online community. Lecture Notes in Computer Science, 4744, 148. Hollander, H. (1990). A social exchange approach to voluntary cooperation. American Economic
Review, 1157-1167.
Kahneman, D., & Tversky, A. (1979). Prospect theory: An analysis of decision under risk. Econometrica, 263-291.
Keltner, D. (1996). Evidence for the distinctness of embarrassment, shame, and guilt: A study of recalled antecedents and facial expressions of emotion. Cognition and Emotion, 10, 155-172.
Ketelaar, T. (2004). Ancestral emotions, current decisions: Using evolutionary game theory to explore the role of emotions in decision-making. In C. Crawford & C. Salmon (Eds.), Darwinism, public policy and private decisions (pp. 145–168). Mahwah, NJ: Erlbaum. Ketelaar, T., & Au, W.T. (2003). The effects of guilt on the behaviour of uncooperative
individuals in repeated social bargaining games: An affect-as-information interpretation of the role of emotion in social interaction. Cognition and Emotion, 17, 429-453.
Kurzban, R., & DeScioli, P. (2008). Reciprocity in groups: information-seeking in a public goods game. European Journal of Social Psychology, 38, 139–158.
Kurzban, R., DeScioli, P., & O’Brien, E. (2007). Audience Effects on Moralistic Punishment.
Evolution and Human Behavior, 28, 75-84.
23
Landry, C.E., Lange, A., List, J.A., Price, M.K., & Rupp, N.G. (2006). Toward an Understanding of the Economics of Charity: Evidence from a Field Experiment. Quarterly Journal of Economics, 121, 747-782.
Ledyard, J. (1995). Public Goods: A Survey of Experimental Research. In J. Kagel and A.E. Roth (Eds.) Handbook of Experimental Economics, Princeton, NJ.
Lewis, H.B. (1971). Shame and Guilt in Neurosis. Psychoanalytic Review, 58, 419-438.
Li, J., & Riyanto, Y.E. (2009). Category Reporting in Charitable Giving: An Experimental Analysis, Working Paper.
List, J.A., Berrens, R.P., Bohara, A.K., & Kerkvliet, J. (2004). Examining the role of social isolation on stated preferences. American Economic Review, 94, 741-752.
Lopez, M., Murphy, J., Spraggon, J., & Stranlund, J. (2012). Comparing the Effectiveness of Regulation and Pro-Social Emotions to Enhance Cooperation: Experimental Evidence from Fishing Communities in Colombia. Economic Inquiry, 50, 131-142.
Ludford, P. J., Cosley, D., Frankowski, D., & Terveen, L. (2004). Think different: increasing online community participation using uniqueness and group dissimilarity. Proceedings of the SIGCHI conference on Human factors in computing systems (2004) ACM Press: Vienna, Austria, 631-638.
Mago, S.D., Savikhin, A.C., & Sheremeta, R.M. (2012). Facing Your Opponents: Social Identification and Information Feedback in Contests. ESI Working Paper.
Masclet, D., Noussair, C., Tucker, S., & Villeval, M. (2003). Monetary and Non-Monetary Punishment in the Voluntary Contributions Mechanism. American Economic Review, 93, 366-380.
Morgan, J., & Sefton, M. (2000). Funding Public Goods with Lotteries: Experimental Evidence. Review of Economic Studies, 67, 785-810.
Nathanson, D. L. (1987). The many faces of shame. New York: Guilford Press.
Noussair, C., & Tucker, S. (2007). Public Observability of Decisions and Voluntary Contributions in a Multiperiod Context. Public Finance Review, 35, 176-198.
Ostrom, E., Walker, J., & Gardner, R. (1992). Covenants with and without a sword: Self-governance is possible. American Political Science Review, 86, 404-417.
Panagopoulos, C. (2010). Affect, Social Pressure and Prosocial Motivation: Field Experimental Evidence of the Mobilizing Effects of Pride, Shame and Publicizing Voting Behavior. Political Behavior, 32, 369-386.
Rabin, M. (1993). Incorporating Fairness into Game Theory and Economics. American Economic Review, 83, 1281-1302.
Rafaeli, S., Ravid, G., & Soroka, V. (2004). De-lurking in virtual communities: a social communication network approach to measuring the effects of social and cultural capital. Paper presented at the 37th Hawaii International Conference on System Sciences, Waikoloa, Big Island, Hawaii.
Rana, O. F., & Hinze, A. (2004). Trust and reputation in dynamic scientific communities. IEEE Distributed Systems Online, 5.
Rege, M., & Telle K., (2004). The impact of social approval and framing on cooperation in public good situations. Journal of Public Economics, 88, 1625-1644.
Rege, M., (2004). Social Norms and Private Provision of Public Goods. Journal of Public Economic Theory, 6, 65-77.
24
Sefton, M, Shupp, R, & Walker, J. (2007). The effect of rewards and sanctions in provision of public goods. Economic Inquiry, 45, 671-690.
Soetevent, A. (2005). Anonymity in giving in a natural context- a field experiment in 30 churches. Journal of Public Economics, 89, 2301-2323.
Sutter, M., Haigner, S., & Kocher, M.G. (2010). Choosing the Carrot or the Stick? Endogenous Institutional Choice in Social Dilemma Situations. Review of Economic Studies, 77, 1540-1566.
Tadelis, S., (2011). The Power of Shame and the Rationality of Trust. UC Berkeley, Working Paper.
Tangney, J.P.E., & Fischer, K.W. (1995). Self-conscious emotions: The psychology of shame, guilt, embarrassment, and pride. New York: Guilford Press.
Yamagishi, T. (1986). The provision of a sanctioning system as a public good. Journal of Personality and Social Psychology, 51, 110-116.
Yang, J., Adamic, L.A., & Ackerman, M.S. (2008). Crowdsourcing and Knowledge Sharing:
Strategic User Behavior. In EC’08, 246–255.
25
Table 1: Summary of Treatments
Treatment Display of Identities Cost of Information Number of Individuals Number of Independent Observations
NONE None Free 40 8
ALL All players Free 40 8
TOP Top 2 players Free 40 8
[image:26.612.106.505.220.297.2]BOTTOM Bottom 2 players Free 40 8
Table 2: Average Statistics
Treatment Average Contribution
Contribution as % of Endowment
% of Contributions = 0
% of Contributions = Endowment
NONE 23.4 (0.9) 29.3% 34.4% 8.3%
ALL 44.2 (1.2) 55.3% 22.0% 32.8%
TOP 27.8 (1.0) 34.8% 24.4% 10.9%
BOTTOM 44.9 (1.0) 56.1% 12.4% 25.1%
The standard error of the mean is in parentheses.
Table 3: Effect of Treatment on Contribution Rates
(1) (2)
Tobit Random Effects Multilevel Mixed Random Effects
ALL 32.53** 19.29***
[1 if ALL treatment] (8.39) (2.88)
TOP 6.71 4.84*
[1 if TOP treatment] (8.31) (2.89)
BOTTOM 35.78*** 27.25*** [1 if BOTTOM treatment] (8.30) (2.88)
Period -2.453*** -1.38***
[period trend] (0.279) 0.17
period × TOP 0.31 -0.04
(0.30) (0.24)
period × ALL 0.53* 0.14
(0.31) (0.24)
period × BOTTOM -0.04 -0.55**
(0.29) (0.24)
Constant 40.81*** 37.87
(5.87) (2.04)
Observations 3,200 3,200
Wald chi2(7) 526.77*** 700.52***
[image:26.612.114.499.351.587.2]26
Table 4: GMM Estimation with Lagged Contributions
(1) (2) (3) (4)
NONE ALL TOP BOTTOM
lag-own-contribution 0.37*** 0.29*** 0.40*** 0.27*** [individual contribution in period t-1] (0.07) (0.08) (0.09) (0.08)
lag-group-contributions 0.04 0.03 0.00 0.01 [group contribution in period t-1] (0.04) (0.03) (0.03) (0.03)
above-lag -8.73*** -6.84*** -17.94*** -9.74*** [in the top two in period t-1] (2.47) (2.32) (2.89) (3.07)
below-lag 8.17*** 5.14** 5.29** 13.72*** [in the bottom two in period t-1] (3.06) (2.49) (2.54) (3.18)
Period -0.78** -0.87*** -0.92*** -1.75*** [period trend] (0.33) (0.17) (0.22) (0.34)
Constant 18.21** 35.02*** 30.43*** 48.50*** (7.83) (6.41) (6.75) (9.24)
Observations 720 720 720 720
Number of subject 40 40 40 40
* significant at 10%, ** significant at 5%, *** significant at 1%. Robust standard errors in parentheses. Using STATA command xtabond.
Table 5: Distribution of Leaders and Laggards
[image:27.612.155.460.416.485.2]NONE ALL TOP BOTTOM Leaders 30.0% 52.5% 30.0% 42.5% Laggards 35.0% 10.0% 32.5% 17.5%
Table 6: Contributions as % of Endowment by Contributor Ranking
27
Figure 1: Output Screens (Names and Photos are Removed)
Treatment ALL
Treatment TOP
Treatment NONE
28
Figure 2: Average Contribution as Percentage of the Endowment over Time
0% 10% 20% 30% 40% 50% 60% 70% 80%
1 3 5 7 9 11 13 15 17 19 Period
NONE
ALL
TOP
29
Figure 3: Distribution of Contributions in all 20 Periods
0 0.1 0.2 0.3 0.4 0.5
0-10 11-20 21-30 31-40 41-50 51-60 61-70 71-80
F rac tion Contribution NONE 0 0.1 0.2 0.3 0.4 0.5
0-10 11-20 21-30 31-40 41-50 51-60 61-70 71-80
F rac tion Contribution TOP 0 0.1 0.2 0.3 0.4 0.5
0-10 11-20 21-30 31-40 41-50 51-60 61-70 71-80
F rac tion Contribution ALL 0 0.1 0.2 0.3 0.4 0.5
0-10 11-20 21-30 31-40 41-50 51-60 61-70 71-80
F
rac
tion
30
Appendix (For Online Publication): Instructions for TOP Treatment
INSTRUCTIONS
In this experiment you will be placed in a group of 5 participants (including you). You will remain in the same group for the entire experiment. The experiment will consist of 20 periods. At the end of the experiment 2 out of 20 periods will be randomly selected for payment. After you have completed all periods two tokens will be randomly drawn out of a bingo cage containing tokens numbered from 1 to 20. The token numbers determine which two periods are going to be paid in the game.
Each period you will be given 80 francs. Francs will be converted to U.S. dollars at the end of the experiment at the rate of 20 francs = $1. Each period you will be asked to decide how many francs you want to allocate to a Group Account. You may allocate any integer number of francs between 0 and 80. The remainder will be automatically allocated to your Individual Account.
EARNINGS
After all participants have made their decisions, your earnings for the period are calculated. These earnings will be converted to cash and paid at the end of the experiment if the current period is the period that is randomly chosen for payment. Your earnings consist of two parts:
1) Your earnings from the Individual Account 2) Your earnings from the Group Account
Your earnings from the Individual Account equal to the francs that you keep for yourself and do not depend on the decisions of others. Therefore, for every franc you keep for yourself in your Individual Account, you earn 1 franc.
Your earnings from the Group Account depend on the total number of francs allocated to the Group Account by all 5 group members (including you). In particular, your earnings from the Group Account are 40 percent of the total allocation of all 5 group members (including you) to the Group Account. Therefore, for every franc you allocate to the Group Account, you increase the total allocation to the Group Account by 1 franc. Therefore, your earnings from the Group Account rise by 0.4×1=0.4 francs. And the earnings of the other group members also rise by 0.4 francs each, so that the total earnings of the group from the Group Account rise by 2.4 francs.
In summary, your period earnings are determined as follows:
Your earnings = earnings from the Individual Account + earnings from the Group Account =
= 80 - (your allocation to the Group Account) + 0.4×(allocation of 5 group members to the Group Account)
Example: Suppose that you allocated 40 francs to the Group Account and that the other four members of your group allocated a total of 120 francs. This makes a total of 160 francs in the Group Account. In this case each member of the group receives earnings from the Group Account of 0.4×160 = 64 francs. In addition, you also receive 40 francs from your Individual Account since you have kept 40 francs to your Individual Account.
OUTCOME SCREEN
At the end of each period, your allocation and the sum of all allocations in your group are reported on the outcome screen as shown below. To aid you in your calculation, you are also shown your earnings from your individual account and your earnings from the group account. Once the outcome screen is displayed you should record your results for the period on your Personal Record Sheet under the appropriate heading.
The photos and names of each member of your group will be displayed on the top of your screen at all times. At the end of each period, the photos of all group members will be re-arranged by the number of francs allocated to the Group Account in that period.
The allocations will be ranked from highest allocation to lowest allocation, and the amount of each group member's allocation will be listed on the screen.
RANKING
You will see the top two ranked group members, and their names and photos will be listed below their ranking. The ranking corresponds to the number of tokens allocated in that period within the group.