http://www.scirp.org/journal/msa ISSN Online: 2153-1188 ISSN Print: 2153-117X
The Barrier Properties of Flake-Filled
Composites with Precise Control of Flake
Orientation
A. Tsiantis, T. D. Papathanasiou
*Department of Mechanical Engineering, University of Thessaly, Volos, Greece
Abstract
Additive manufacturing, especially in the form of 3D printing, offers the ex-citing possibility of generating heterogeneous articles with precisely controlled internal microstructure. One area in which this feature can be of significant advantage is in diffusion control, specifically in the design and fabrication of microstructures which optimize the rate of transport of a solute to and from a contained fluid. In this work we focus on the use of flakes as diffusion-control agents and study computationally and theoretically the effect of orientation on the barrier properties of flake-filled composites. We conducted over 1500 si-mulations in two-dimensional, doubly-periodic unit cells each containing up to 3000 individual flake cross-sections which are randomly placed and with their axes forming an angle (π 2−θ) with the direction of macroscopic diffu-sion. We consider long-flake systems of aspect ratio (α) 100 and 1000, from the dilute (
αϕ
=0.01) and into the concentrated (αϕ
=40) regime. Based on the rotation properties of the diffusivity tensor, we derive a model which is capable of accurately reproducing all computational results (0.01<αϕ
<40 and 0< <θ π 2). The model requires as inputs the two principal diffusivities of the composite, normal and parallel to the flake axis. In this respect, we find the models of Lape et al. [1] and Nielsen [2] form an excellent combination. Both our model and our computational data predict that atθ
>0 the qua-dratic dependence of the Barrier Improvement Factor (BIF) on (αϕ
) is lost, with the BIF approaching a plateau at higher values of (αϕ). This plateau is lower as (θ
) increases. We derive analytical estimates of this maximum achievable BIF at each level of misalignment; these are also shown to be in ex-cellent agreement with the computational results. Finally we show that our computational results and model are in agreement with experimental evidence at small values of (θ
).How to cite this paper: Tsiantis, A. and Papathanasiou, T.D. (2017) The Barrier Properties of Flake-Filled Composites with Precise Control of Flake Orientation. Mate-rials Sciences and Applications, 8, 234-246.
https://doi.org/10.4236/msa.2017.83016
Received: January 7, 2017 Accepted: March 6, 2017 Published: March 9, 2017
Copyright © 2017 by authors and Scientific Research Publishing Inc. This work is licensed under the Creative Commons Attribution International License (CC BY 4.0).
Keywords
Barrier Properties, Composite Films, Diffusion, Flakes, Platelets, 3D Printing
1. Introduction
Additive manufacturing, especially in the form of 3D printing, offers the exciting possibility of generating articles with precisely controlled internal microstruc-ture. One area in which this feature can be of significant advantage is in diffu-sion control, specifically in the design and fabrication of microstructures which allow for minimization of the transport of a solute to/from a contained fluid. Flake-filled polymeric composites, incorporating mica, glass or metallic flakes have found many uses in this direction, as they offer significant processing and property advantages, namely high dimensional stability and low warpage in molding, uniform in-plane mechanical properties, corrosion protection, sound insulation as well as appearance and color control [3] [4] [5] [6] [7]. Mi-cron-sized flakes of inorganic materials such as mica, nano-scale platelets of clay minerals such as hectrite, saponite and montmorillonite and more recently gra-phene-oxide platelets of aspect ratios well over 1000, have been used for this purpose [8]. It has been demonstrated that incorporation of such fillers aligned perpendicular to the direction of macroscopic diffusion can be very effective in increasing the tortuosity of the diffusion path of the diffusing species. When the flakes are randomly placed, as would be the case in a flake composite manufac-tured from the melt, the predicted improvement in barrier efficiency ranges from being ~(
αϕ
) in dilute systems, where (α) is the aspect ratio and (ϕ
) the volume fraction of the flakes, to being ~( )
αϕ 2in more concentrated disper-sions [1] [9]-[16].
One notable disadvantage of traditional processing methods vis-à-vis flake- filled composites is the fact that flake orientation cannot be precisely controlled. In such operations (extrusion, compression or injection molding, thermoform-ing and others) flake orientation is achieved due to the propensity of the flakes to orient in accordance to the prevailing flow field—either in the main direction of flow when the flow is shear or transverse to it when the flow is extensional [17]. An additional shortcoming of traditional flow-processing routes is the ina-bility to utilize high flake loadings since, in that case, the viscosity of the result-ing melt becomes prohibitively high. Given the capability afforded by 3D print-ing to fully control flake orientation as well as generate articles with flake load-ings approaching those at maximum packing, it is desirable to predict the effec-tive diffusion coefficient (or its inverse, the barrier improvement factor, BIF) as an explicit function of the flake orientation angle and for very high, previously untenable, concentrations.
calculations [19] [20] [21]. In both cases, the proposed models have been derived for low or very-low flake concentrations and have not been extensively tested in the moderate to high-concentration regime, which will be of importance in any 3D printing application. In addition, by not respecting the rotational properties of the diffusivity tensor, these models are not grounded on a sound theoretical footing. This paper addresses the above issues both computationally and theo-retically, by proposing a model based on the two principal diffusivities of a flake composite. We also show that the implications of our theoretical model are fully supported by extensive computational results.
2. Computational
We carry out steady-state diffusion computations in doubly-periodic unit cells containing up to 3000 individual flake cross-sections. These are added in the domain sequentially, using a Random Sequential Addition (RSA) procedure. Specifically, at each flake placement attempt, two random numbers are used to assign the coordinates of the flake center while its orientation angle (
θ
) is fixed and the same for all flakes. If, after placement, no overlap with other flakes is detected, the process continues with the next flake, until the desired number of flakes has been placed, or, until no flake can be placed after 50,000 attempts; in this case no geometry is generated. In order to enable subsequent meshing of the computational domain, a minimum allowable distance between flakes is im-posed; this is (2t) where (t) is the thickness of the flake. Since in this work we have dealt with flakes of high aspect ratio (α
=100 andα
=1000), this mini-mum distance requirement is deemed reasonable so as to not result in excessive local mesh refinement. In a rectangular unit cell of dimensions (H) and (L) con-taining (N) flakes of dimensions (t,α
), the flake area fraction (ϕ
) is2 N t LH
ϕ
=α
and the length (l) of each flake l= LH( )
αφ N . We have looked at systems in which 0.01 ≤αϕ
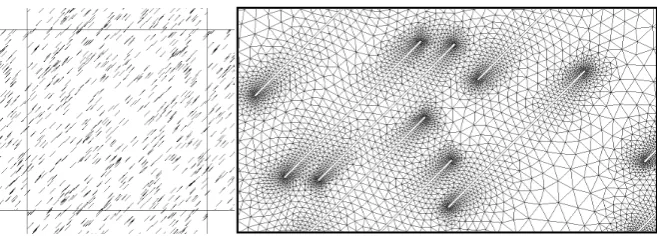
40≤ . At higher values of (αϕ) it be-comes impossible to fill the space with non-overlapping flake crossections. This not-withstanding, the present study is to our knowledge the first to investigate systems of such large concentration.In multi-particle simulations, use of doubly-periodic cells is essential when dealing with elongated particles so as to eliminate artifacts of oriented (or, dep-leted) layers which would otherwise appear adjacent to cell boundaries [11] [16]. The effect of the RVE dimensions on the computed effective diffusivity is also eliminated when using periodic unit cells. A sample unit cell, showing flakes oriented at an angle θ = 0.8 rad with respect to the horizontal (x) axis (extended slightly outside the limits of the unit cell to show the doubly-periodic geometry) is shown in Figure 1.
The boundary conditions are cyclic on the right and left boundaries, namely
( )
(
)
left 0, right ,
C y =C L y . On the top and bottom boundaries, fixed values of concentration are prescribed. On the surface of each flake we impose
0 C
Figure 1. Sample unit cell—doubly-periodic—containing 500 flake crossections, all oriented at an angle θ = 0.8 rad to the horizontal (x) axis. α=100, αϕ =1. On the right is shown a detail of the computational mesh.
placed flakes. The computational meshes are created by the mesh generating program Salome through an in-house automated procedure and contain ~106
triangular elements.
These meshes are then used by Open Foam to solve the steady-state diffusion equation 2
0 C
∇ = , (C) being the solute concentration, and provide its distribu-tion in the domain of interest. The assumpdistribu-tion of an isotropic matrix material is also made. The solution also supplies the value of ∂ ∂nC at each point on the upper (or lower) boundary. As a result, the mass flux along this boundary can be calculated as
0 0
d L
n
C
J = −D ∂ x
∂
∫
nwhere the subscript (n) indicates numerically computed value, n is the outward unit vector and (L) is the width of the unit cell. Because of impermeable flakes crossing boundaries, which results in sudden local changes of the flux, care must be taken in performing this integration. In this work, we used adaptive intervals and only accepted values of the integral when these were convergent with re-finement. Equating this flux with the one obtained from Fick’s law in a macros-copic equivalent cell (whose diffusivity is Deff) we obtain
0 eff
0
d L
HD C
D x
C L
∂
=
∆ ⋅
∫
∂nwhere ∆C is the macroscopically imposed concentration difference and (H) the height of the unit cell. These effective diffusivities will be presented and dis-cussed for various values of (
θ
), (α) and (ϕ
) in the following sections.3. Results and Discussion
ob-tained Deff were practically indistinguishable; this conclusion extended for (
αϕ
)as large as 40; therefore most of our computations have been carried out in RVEs containing 500 flake cross sections. We look at systems ranging from dilute to concentrated and in which the fiber orientation (θ) changes between zero (flake orientation perpendicular to the direction of diffusion) to π 2 (fibers oriented along the direction of macroscopic diffusion). We have carried out computations in unit cells similar to those of Figure 1 for
α
=100 andαϕ
=0.01, 0.1, 1.0 andαϕ
=10, as well as forα
=1000 and 0.01≤αϕ
≤40.3.1. Effect of Flake Misalignment on Effective Diffusivity
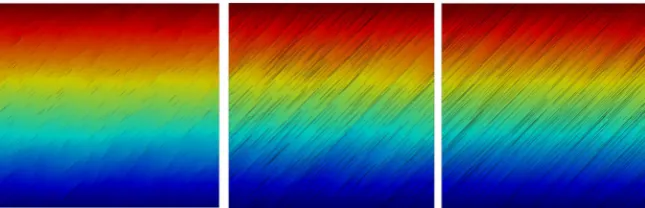
Representative results of the distribution of (C), also showing the corresponding flake distributions, are shown in Figure 2 and Figure 3.
We define as D11 the diffusivity of such a system when θ = 0˚ (all flakes
oriented perpendicular to the direction of macroscopic diffusion) and D22 the
diffusivity when θ = 90˚ (all flakes oriented parallel to the direction of diffusion).
D11 and D22 are the principal values of the two-dimensional diffusivity tensor, D.
The diffusivity tensor D′ corresponding to a system in which the flakes assume an orientation angle θ (counterclockwise with respect to the x-axis) can be de-termined according to the relation ′ = T
Q QDQ , where Q is the rotation ten-sor (Q11=cos
( )
θ
, Q12= −sin( )
θ
, Q21= −Q12, Q22=cos( )
θ
).Hence
2 2
11 22 11 22
2 2
11 22 11 22
cos sin sin cos sin cos
sin cos sin cos sin cos
D D D D
D D D D
θ θ θ θ θ θ
θ θ θ θ θ θ
+ − +
′ =
− + +
D (1)
[image:5.595.210.538.452.554.2]Therefore, the effective diffusivity of this system in the direction (y) forming
Figure 2. Distribution of concentration in geometries with θ = 0 and αϕ =1,10, 40. The distribution of flakes is also visible. N = 500.
[image:5.595.212.535.599.703.2]an angle (π 2−θ ) with the axis of the flakes will be
( )
2( )
2( )
eff 11cos 22sin
D θ =D θ +D θ (2)
We will investigate the use of Equation (2) to determine Deff
( )
θ
, provided the principal permeabilities D11 and D22 are known. By comparing its predictionsto our computational results we will identify which models for D11 and D22 give
the best agreement with computation.
In the first instance we have compared the computational results for dilute cases (
αϕ
=0.01 andαϕ
=0.1) with the predictions of Equation (2), in which Nielsen’s [2], model has been used for D11 and D22, namely 22 01
1 2
D D ϕ
ϕ α − =
+
and 11 0
1
1 2
D D ϕ
αϕ − =
+ .
Extensive comparisons have shown that predictions of Equation (2) based on Nielsen’s model for D11 and D22 are close to the computational results only for
the very dilute regime (
αϕ
~ 0.01). For progressively higher of (αϕ
) there is a growing discrepancy.It is of course possible to use diffusivity models for D11 and D22 more suitable
for concentrated suspensions. A review and evaluation of available models has been carried out by Chen and Papathanasiou [11]. Of the models discussed there, we single out those of Cussler and co-workers [1] [9] mainly because of their relevance to the systems modeled here (randomly placed flakes) as well as due to the small number of adjustable parameters needed in their implementa-tion and their extensive use in the literature. Lape et al. [1] proposed that for diffusion across arrays of unidirectional randomly placed flakes it is
(
)
20 eff 1 3 1 D D αφ φ + = −
In deriving this model, the tortuosity factor was taken to be 1 + αφ/3 and it was further assumed that the ratio of the areas available for diffusion is
(
) (
)
0 f 1 3 1A A = +
αφ
−φ
Implicit in the above derivation is the assumption that the diffusion paths around a flake form straight lines; therefore it is not unreasonable to treat the factor “3” in the expression above as a geometrical parameter that may be ad-justed if so suggested by the data. Since that was found to be the case in analyz-ing our data, we use the model of Lape et al. [1] in the form:
(
)
(
)
2 0 eff 1 1 D D αφ λ φ + =− (3)
in which (
λ
) is an adjustable geometrical parameter. Another model suitable for concentrated aligned flake systems [9] reads(
)
2 2 0 eff 1 1 D D α φ β φ = +− (4)
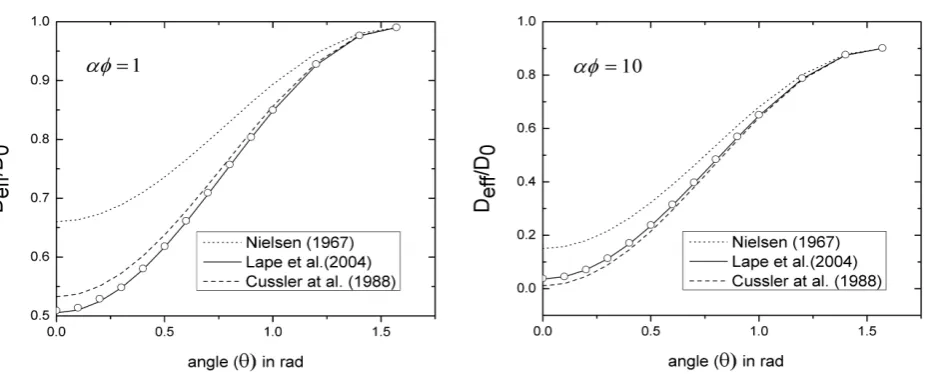
Figure 4. Comparison of computational results (points) with predictions of Equation (2) for αϕ =1 and αϕ =10. The legend refers to the model used in place of D11. For D22 Nielsen’s model [2] was used. In all cases α=100, β =1.15 in Equation (4) and λ=2.5 in Equation (3).
comparison between the computational results, for flakes with
α
=100 and for 1αϕ
= andαϕ
=10, in unit cells similar to those of Figure 3 and the predic-tions of Equation (2), in which D11 is taken from [1] [9] and D22 from [2]. It isevident that use of models for D11 more suitable for concentrated systems results
in significantly improved predictions of Deff for all (θ). The model of Lape et
al. [1] gives an excellent agreement with the computational results for
λ
=2.5 even forαϕ
as low as 0.01 (especially away from θ~π 2) with a slight ad-justment ofλ
to 2.7 atαϕ
=0.01, while the model of Cussler et al. [1] gave a very good fit withβ
=1.15 atαϕ
≥1. The latter model Equation (4) can also be used at lower (αϕ
) values with proper adjustment of the parameter (β
); at0.1
αϕ
= best agreement was obtained forβ
=0.117 and atαϕ
=0.01 best agreement was obtained forβ
=0.014. Finally, it is noteworthy that nearπ 2
θ = (flakes oriented almost parallel to the direction of diffusion) the nu-merical results are in very close agreement with Equation (2) for all concentra-tions. Since at θ~π 2 the term containing D22 dominates, this shows that
Nielsen’s model for diffusion parallel to the flakes is a reliable one, even for (αφ) as high as 10.
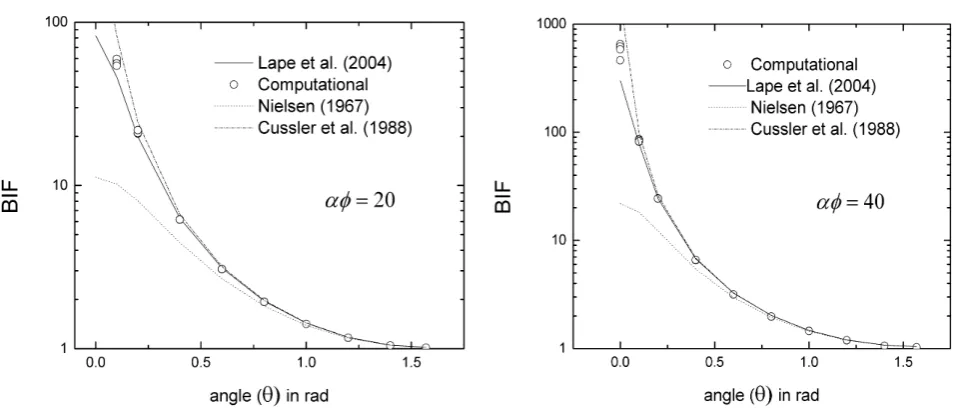
Additional comparisons for
α
=1000 and higher values of (αϕ
) are shown in Figure 5, in terms of the BIF. There are 50 computational data-points at each value of (αϕ
) and those at the same (θ
) almost completely overlap. This has been shown before [11], namely that spatial randomness has a very small effect on the diffusivity of such systems.In summary, our computational results and the comparisons presented above have shown that the effective diffusivity Deff of a system of randomly placed
flakes oriented at an angle (π 2−θ) with the direction of macroscopic diffusion can be predicted by
( )
(
)
(
)
( ) (
)
( )
eff 2 2
2 0
1 1
cos sin
1 2
1
D
D
θ φ φ
θ θ
φ α αφ λ
− −
= +
+
Figure 5. Comparison of computational results (points) with predictions of Equation (2) for αϕ =20 and αϕ =40. The legend refers to the model used in place of D11. For D22 Nielsen’s model [2] was used. In all cases α=1000, β =1.15 in Equation (4) and λ=2.5 in Equation (3).
where
λ
=2.5. As explained above, this model is in excellent agreement with the computational data for the entire range of (αϕ
) and (θ) studied. In addition, we compare the predictions of our model to an experimental result [22] [23], namely that for small values of the misalignment angle (θ) it is(
)
( )
( )
eff 2
eff 0
cos D
D θ
θ θ
= =
in which
θ
=0 corresponds to a composite fully aligned normal to the direc-tion of diffusion. If D11 is the diffusivity of the fully-aligned system, the BIFim-plied by the above statement will be
2
2 1
11
cos
BIF cos
D θ αφ θ
= ≈ (6)
From Equation (2) it can be seen that the BIF implied by our model, (setting, without loss of generality or relevance, D22~D0~1) is
(
)
( )
2 2
11
1 BIF
1 D 1 cos θ =
+ − ⋅ (7)
As shown in Figure 6, at each value of (
θ
) the predictions of Equation (7) approach asymptotically those of Equation (6) albeit at progressively higher val-ues of D11 (that is, for more dilute systems) as (θ
) increases. However, theli-miting behavior of Equation (7) in the concentrated regime (small D11) suggests
a qualitatively different behavior for the BIF. Our computational results support this prediction, as will be elaborated upon in the following section. With refer-ence to Figure 6, if the model of Lape et al. [1] is adopted for D11, a value of
11 0.1
3.2. The Effect of Flake Concentration
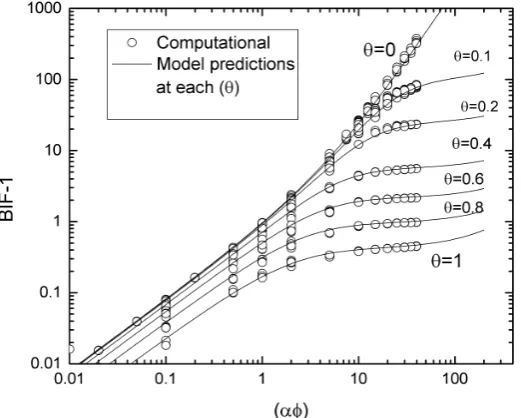
[image:9.595.241.504.192.396.2]In aligned systems, it is known [1] [9] [10] that the BIF scales with
( )
αϕ 2 at higher concentrations, and linearly with( )
αϕ
in the dilute regime. No such definitive information is available when deviations from perfect alignment oc-cur. Figure 7 shows all our computational results forα
=1000. It is clear that while the quadratic rise with (αϕ
) is indeed observed in aligned systems (θ
=0), this asymptotic behavior is lost as (θ) increase and the BIF approaches aFigure 6. Predictions of Equation (7) (broken lines) showing its asymptotic approach to the experimental result represented by Equation (6) (solid line). Larger values of D11 cor-respond to more dilute systems.
[image:9.595.244.505.454.663.2]plateau value; this plateau is lower the larger the misalignment angle (θ) is. The implication of this result is that for the full potential of large-α flake systems as diffusion barriers to be realized, good alignment is essential. Also shown in Fig-ure 7 are the predictions of Equation (5); as in FigFig-ure 4 and Figure 5 the agreement between the two is excellent.
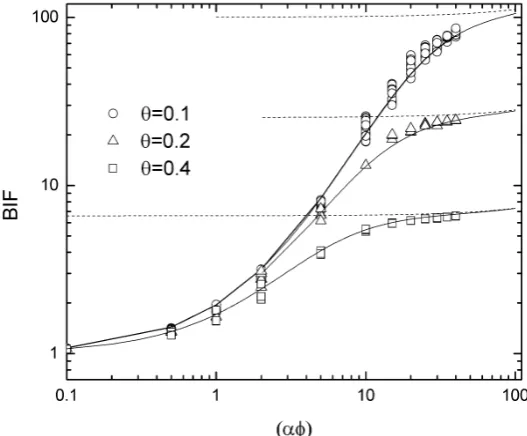
3.3. Limiting Behavior of the BIF at Very High (
αφ
).
In light of the excellent agreement between computational results and Equation (5) it is possible to use the latter to obtain analytical estimates of the leveling-off values of the BIF at each (θ), by observing that the first term of Equation (5) be-comes negligible at high (
αϕ
), leaving(
)
(
(
)
)
( )
1 2
1
lim BIF sin
1 2
αφ
φ
θ φ α
−
→∞
−
= ⋅
+
(8)
Figure 8 compares our computational results to the predictions of Equation (8) as well as the approach to that limit based on Equation (5). A conclusion is obvious—the quadratic rise of the BIF with (
αϕ
) is lost whenθ
>0. For a mi-salignment as small as 5.7˚ (0.1 rad) the upper limit on the achievable BIF from Equation (13) is 104—a three-fold decrease from the theoretical BIF of a per-fectly aligned composite withαϕ
=40 and a multi-fold decrease from an aligned composite of even higher (αϕ
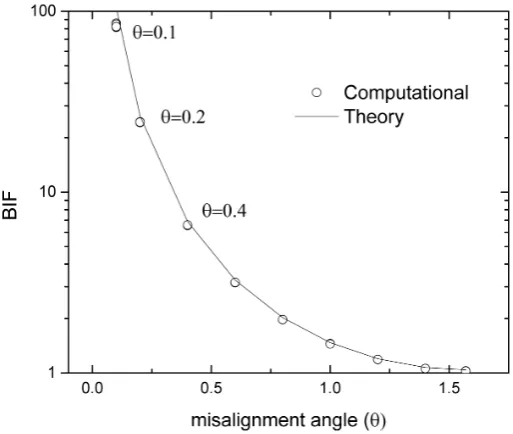
). In fact, for such concentrated systems the departure from the theoretical BIF can be very rapid at small misalignment angles, as can be inferred from Equation (8). This we show in Figure 9 in which we plot the predictions of Equation (8) along with our computational results for1000
α
= andαϕ
=40. [image:10.595.240.504.473.691.2]The above comments and results are particularly pertinent to high aspect ratio
Figure 9. Computed BIF at αϕ=40
(
α=1000)
as a function of the misalignment angle (θ). With a solid line are shown the predictions of Equation (8). The rate of decline in barrier performance with even a slight misalignment is very significant at small (θ), when (αφ) is large.flakes, such as found in exfoliated nanoclay or graphene composites, for which even at low (
ϕ
) a high (αϕ
) value can be achieved; in our simulations in which1000
α
= , the maximumαϕ
of 40 translates intoϕ
=4% . Evidently, Εquation (8) in that case says that the limiting BIF is only a function of the misa-lignment angle—and our computations are in complete agreement with this prediction. At higher loadings, Equation (8) predicts that the limiting BIF will increase for larger values of (αϕ
).4. Conclusion
esti-mates of this maximum achievable BIF at each level of misalignment; these are also shown to be in excellent agreement with the computational results. Finally we show that our computational results and model are in agreement with expe-rimental evidence at small values of (θ). Future work involves extension to even higher values of (
αϕ
) as well as comparison with 3D computations.References
[1] Lape, N.K., Nuxoll, E.E. and Cussler, E.L. (2004) Polydisperse Flakes in Barrier Films. Journal of Membrane Science, 236, 29-37.
https://doi.org/10.1016/j.memsci.2003.12.026
[2] Nielsen, L.E. (1967) Models for the Permeability of Filled Polymer Systems. Journal of Macromolecular Science Part A: Chemistry, 5, 929-942.
https://doi.org/10.1080/10601326708053745
[3] Panwar, A., Choudhary, V. and Sharma, D.K. (2013) Role of Compatibilizer and Processing Method on the Mechanical, Thermal and Barrier Properties of PS/ Organoclay Nanocomposites. Journal of Reinforced Plastics and Composites, 32, 998-1002. https://doi.org/10.1177/0731684413477770
[4] Pavlidou, S. and Papaspyrides, C.D. (2008) A Review on Polymer-Layered Silicate Nano-Composites. Progress in Polymer Science, 33, 1119-1198.
https://doi.org/10.1016/j.progpolymsci.2008.07.008
[5] Pajarito, B. and Kubuchi, M. (2013) Flake-Filled Polymers for Corrosion Protection. Journal of Chemical Engineering of Japan, 46, 18-26.
https://doi.org/10.1252/jcej.12we133
[6] Mohamadi, M., Garmabi, H. and Keshavarzi, F. (2016) An Investigation on the Ef-fects of Organo-Modified Fluoromica on Mechanical and Barrier Properties of Compatibilized HDPE Nanocomposite Films. Journal of Plastic Film and Sheeting, 32, 10-33. https://doi.org/10.1177/8756087915569097
[7] Lagaron, J.M. and Nunez, E. (2011) Nanocomposites of Moisture-Sensitive Poly-mers and BiopolyPoly-mers with Enhanced Performance for Flexible Packaging Applica-tions. Journal of Plastic Film and Sheeting, 28, 79-89.
https://doi.org/10.1177/8756087911427756
[8] Lee, K.-H., Hong, J., Kwak, S.J., Park, M. and Son, J.G. (2015) Spin Self-Assembly of Highly Ordered Multilayers of Graphene-Oxide Sheets for Improving Oxygen Bar-rier Performance in Polyolefins. Carbon, 83, 40-47.
https://doi.org/10.1016/j.carbon.2014.11.025
[9] Cussler, E.L., Hughes, S.E., Ward, W.J. and Aris, R. (1988) Barrier Membranes. Journal of Membrane Science, 38, 161-74.
https://doi.org/10.1016/S0376-7388(00)80877-7
[10] Lebovka, N., Khrapatiy, S., Vygornitskyi. and Pivovarova, N. (2014) Barrier Proper-ties of K-Mer Packings. Physica A, 408, 19-27.
https://doi.org/10.1016/j.physa.2014.04.019
[11] Chen, X. and Papathanasiou, T.D. (2007) Barrier Properties of Flake-Filled Mem-branes: Review and Numerical Evaluation. Journal of Plastic Film and Sheeting, 23, 319-346. https://doi.org/10.1177/8756087907088437
[12] Dondero, M., Cisilino, A.P. and Tomba, J.P. (2013) Experimental Validation of Computational Models for Mass Transport through Micro Heterogeneous Mem-branes. Journal of Membrane Science, 437, 25-32.
https://doi.org/10.1016/j.memsci.2013.02.039
Mass Transport Properties in Nanocomposites. Journal of Membrane Science, 381, 10-20. https://doi.org/10.1016/j.memsci.2011.06.036
[14] Tan, B. and Thomas, N.L. (2016) A Review of the Water Barrier Properties of Po-lymer/Clay and Polymer/Grapheme Nanocomposites. Journal of Membrane Sci- ence, 514, 595-612. https://doi.org/10.1016/j.memsci.2016.05.026
[15] DeRocher, J.P., Gettelfinger, B.T., Wang, J., Nuxoll, E.E. and Cussler, E.L. (2005) Barrier Membranes with Different Sizes of Aligned Flakes. Journal of Membrane Science, 254, 21-30. https://doi.org/10.1016/j.memsci.2004.12.025
[16] Papathanasiou, T.D. and Tsiantis, A. (2016) Orientational Randomness and Its In-fluence on the Barrier Properties of Flake-Filled Composite Films. Journal of Plastic Film and Sheeting, On Line.
[17] Papathanasiou, T.D. and Guell, D.C. (1997) Flow Induced Alignment in Composite Materials. Woodhead Publishing, Cambridge.
https://doi.org/10.1201/9781439822739
[18] Bharadwaj, R.K. (2001) Modeling the Barrier Properties of Polymer-Layered Silicate Nanocomposites. Macromolecules, 34, 9189-9192.
https://doi.org/10.1021/ma010780b
[19] Greco, A. (2014) Simulation and Modeling of Diffusion in Oriented Lamellar Na-nocomposites. Computational Materials Science, 83, 164-170.
https://doi.org/10.1016/j.commatsci.2013.11.019
[20] Greco, A. and Maffezzoli, A. (2013) Two-Dimensional and Three-Dimensional Si-mulation of Diffusion in Nanocomposite with Arbitrarily Oriented Lamellae. Jour-nal of Membrane Science, 442, 238-244.
https://doi.org/10.1016/j.memsci.2013.04.038
[21] Sorrentino, A., Tortora, M. and Vittoria, V. (2006) Diffusion Behavior in Poly-mer-Clay Nanocomposites. Journal of Polymer Science Part B: Polymer Physics, 44, 265-274. https://doi.org/10.1002/polb.20684
[22] Yang, C., Smyrl, W.H. and Cussler, E.L. (2004) Flake Alignment in Composite Coatings. Journal of Membrane Science, 231, 1-12.
https://doi.org/10.1016/j.memsci.2003.09.022
[23] Eitzman, D.M., Melkote, R.R. and Cussler, E.L. (1996) Barrier Membranes with Tipped Impermeable Flakes. AIChE Journal, 42, 2-9.
Submit or recommend next manuscript to SCIRP and we will provide best service for you:
Accepting pre-submission inquiries through Email, Facebook, LinkedIn, Twitter, etc. A wide selection of journals (inclusive of 9 subjects, more than 200 journals)
Providing 24-hour high-quality service User-friendly online submission system Fair and swift peer-review system
Efficient typesetting and proofreading procedure
Display of the result of downloads and visits, as well as the number of cited articles Maximum dissemination of your research work