Effect of Virgin Coconut Meal (VCM) on the
Textural, Thermal and Physico Chemical
Properties of Biscuits
Yashi Srivastava*, Anil Dutt Semwal, Gopal Kumar Sharma, Amarinder Singh Bawa
Defence Food Research Laboratory, Sidhhartha Nagar, Mysore, India. Email: [email protected]
Received July 8th, 2010; revised July 12th, 2010; accepted July 12th, 2010.
ABSTRACT
Biscuits were prepared by incorporating virgin coconut meal (VCM) into refined wheat flour (maida) at 5-25% level and evaluated for physical, chemical, nutritional, textural and sensory attributes. All the prepared biscuits had high protein and fiber contents as compared to control (100% refined wheat flour based product). With the incorporation of VCM, hardness and toughness of dough increased while there was a decrease in stickiness and adhesiveness values. Incorporation of VCM had a significant effect on color values of biscuits as the concentration of VCM was increased. The values of L* decreased while those for a* and b* increased. Sensory analysis revealed that 15% VCM biscuits were the most acceptable. The Differential scanning calorimetry (DSC) analysis revealed that the onset (To) decreased while end set (Tc) and enthalpy of gelatinization (ΔH) increased with the increase level of VCM.
Keywords: Virgin Coconut Meal (VCM), Biscuits, Dough, Texture Profile, Thermal Profile, Sensory Evaluation
1. Introduction
The term biscuit is used in Britain to describe a flat crisp baked product. Biscuits are chemically leavened, ready to eat, quick snacks with good eating quality and long shelf life [1]. The basic constituent of biscuit is flour, water, sugar and fat. The variation in these constituents causes the changes in textural properties of biscuits [2]. Biscuits are highly popular among the large segment of popula-tion in urban and rural places and its demand and con-sumption are increasing by leaps and bounds. Children also like the biscuits as these are available in different attractive shape and size as well as taste and palatability. The bakery industry are one of the largest organized food industries all over the world and particularly biscuits are one of the most popular products because it is economi-cally cheaper as well as consider to be luxurious gifts for infants and school going children who are under weight [3]. Bakery products are generally used as a source for incorporation of different nutritionally rich ingredients for their diversification [4].
Various types of nutritious biscuits have been prepared by fortifying the wheat flour with various types of oil seed meals like soy flour [5], peanut [6], corn germ flour [7], cotton seed flour [8], sunflower kernel [9], safflower
protein isolate [10], and coconut residue [11], and re-ceived popularity being nutritionally rich in protein and vitamins.
cakes. Dairo [18] has reported the protein quality indices of sun dried coconut oil meal, oven dried coconut oil meal and fermented coconut oil meal on rats. However, data on the use of VCM in the development of various processed foods are scanty. Hence, the objective of pre-sent investigation were to develop nutritious virgin co-conut meal based biscuits and study the changes in the physico-chemical, textural and thermal characteristics.
2. Materials and Methods
2.1. Raw Materials
Refined wheat flour was procured from local market. Virgin coconut meal was supplied by Central Plantation Crops Research Institute (CPCRI), kasargod, Kerala, India after the extraction of VCO. The VCM was pow-dered in an ultra centrifugal mill (Retsch RI, Germany) using 0.5 mm sieve.
2.2. Preparation of Biscuits
Biscuits were prepared by the incorporation of VCM with the replacement of refined wheat flour at the level of 5, 10, 15, 20 and 25% in the standardized formulations. The preliminary step for the preparation of biscuit was creaming. The creaming was carried out by using short-ening i.e. hydrogenated fat and sugar in Hobart Mixer for 4 min and subsequently added a mixture of refined wheat flour and baking powder along with measured quantity of water in the Hobart mixer. The mixing was done for five minutes till the soft dough was formed. The prepared dough was subjected to sheeting of 4 mm thickness manually. Finally sheets were cut to 4.5 cm diameter by using the die and were subjected to baking at 150°C for 30 min.
2.3. Nutritional Analysis
Moisture, protein, fat, ash and crude fiber were deter-mined as per AOAC method [19]. Fatty acid profile of extracted fat from biscuit samples were determined as AOCS [19] method by using gas liquid chromatograph (Model Chemito 8510 HR, Mumbai, India) with 10% diethylene glycol succinate column (DEGS 8“X1/8”). The minerals like Ca, Fe, Zn, Na, K were determined by Atomic Absorption Spectrometer (AAS Varion 6, Ana-lytik Jena AG, Germany) at 422.7, 248.3, 213.9, 589.0 and 766.5 nm wavelength respectively. For determining minerals the biscuits were converted into ash in muffle furnance. After ashing, 15 ml of 3 N HCl was added to the crucible having ash material and boiled until it was reduced to 2-3 ml. The volume was made up to 50 ml in volumetric flask and mineral content estimated by AAS by flame mode and results were expressed in mg/100 g of sample.
2.4. Physical Property
Biscuits were cooled for 1hrs for the determination of spread ratio as per the method described in AACC [20], six biscuits were taken randomly and placed them edge to edge and stacking for the estimation of diameter and thickness and finally by the subtraction of their average value spread ratios were obtained.
2.5. Texture Properties of VCM Based Biscuits
Texture attribute of biscuits like hardness, cutting force, breaking strength, toughness properties were taken as quality parameters to check the textural properties of VCM based dough and biscuits by using TAHDI Tex-ture analyzer (Stable Micro System Ltd. London, UK) using a 25 Kg load cell and the application programme provided with the apparatus (Texture Expert for Win-dows, TM version 1.22). Hardness and cutting strength of biscuits were determined as mentioned by Singh et al.
[1]. Both were measured using cylindrical probe P/2 and HDS/BS blade respectively with 25 Kg of load cell. For hardness some minor modifications in TA settings were performed, i.e., test speed kept at 2 mm/s. The first peak of graph was considered as initial fracture force and absolute peak force was considered as the hardness of the biscuit.
2.6. Texture Properties of VCM Based Dough
Hardness and toughness of dough was determined as method mentioned in Tyagi et al. [21] with some minor modifications using 40 mm cylindrical cup, probe 10mm and settings were kept as pre test speed of 2 mm/s, test speed of 3 mm/s, post test speed of 10 mm/s with 25 Kg load cell and strain was set at 60%. The obtained peak force was considered as Hardness of dough and area un-der curve was consiun-dered as toughness of dough. Dough stickiness fixture having 25 mm diameter has been used to measure the stickiness and adhesiveness of dough. The pre test speed, post test speed and test speed were same
i.e., 10 mm/min and clearance, hold time, compression force were 3 mm, 10 s and 10 N respectively.
2.7. Color Measurements
2.8. Thermal Properties
The thermal properties of biscuit were determined by using DSC-821 (Mettler Toledo, Switzerland) equipped with a thermal analysis data station. The samples were weighed into a 40 µl capacity aluminum pan (Mettler, ME 27331) and distilled water was added with the help of Hamilton micro-syringe. The samples were hermetically sealed and allowed to stand for 30 min at room tempera-ture before heating in DSC. The DSC analyzer was cali-brated using indium and an empty aluminum pan was used as reference sample pans. Both were heated at the rate of 10°C/min from 20°C to 200°C for the estimation endo-thermal changes as the temperature increased.
2.9. Sensory Properties
Sensory quality of VCM biscuits were evaluated by a panel of 15 semi trained judges by grading for color, taste, texture and overall acceptability on 9 point hedonic scale, with 9 as excellent in all respects and 1 for unac-ceptable samples [21].
2.10. Statistical Analysis
The data analysis, for Duncan multiple comparisons and response optimization were done using STATISTICA stat software release 8.0 package.
3. Results and Discussion
3.1. Proximate Composition of VCM
Virgin coconut meal contains 10.8 ± 0.62% moisture, 54.98 ± 1.05% fat, 14.9 ± 0.25% protein, 15.2 ± 0.2% crude fiber, 2.54 ± 0.05% ash content and 1.57 ± 0.02% carbohydrate (by difference). It is a rich source of miner-als like calcium (83.78 ± 0.015 mg/100 g), Sodium (98.77 ± 0.03 mg/100 g) and potassium (1700 ± 0.15 mg/100 g). Iron and zinc are present comparatively lower concentra-tion, i.e., 22.76 ± 0.14 and 2.57±0.05 mg/100 g respec-tively. Its water absorption capacity and solubility index were 4.82 g/g and 0.45 g/g respectively. Major fatty acid present in VCM was lauric acid (54.37%) followed by myristic acid (20.13%), palmitic acid (8.61%), capric acid (5.81%), oleic acid (5.49%), stearic acid (3.14%), linoleic acid (1.55%) and caprylic acid (0.69%).
3.2. Proximate Composition and Nutritional Value of VCM Biscuits
Proximate composition of biscuits prepared by using VCM (5-25%) is given in Table 1. It is evident that in-corporation of VCM resulted change in moisture content from 3.32 to 4.46%, fat 24.79 to 39.34%, protein 4.56 to 5.97%, ash content 0.26 to 0.73% and fibre 0.15 to 3.55%. The statistical analysis of proximate composition revealed that there was no significant difference in moisture
con-tent up to 15% incorporation of VCM but addition of VCM above 15% level, showed significant increase in moisture content (p > 0.05). This may be due to high water absorption capacity of meal, i.e., 4.82 g/g which gradually increase with rise in the concentration of VCM in biscuits. Similar, results has been reported by Talati et al. [23] and Tyagi et al. [22] in mustard flour biscuit. The incorporation of VCM (5-25%) resulted in considerable increase in the fat, protein, fibre and ash content of biscuit as mentioned in Table 1. Control biscuits samples con-tained oleic acid as the major fatty acid followed by palmitic, stearic acid, myristic acid, lauric acid, capric and capryllic acid. Addition of 5-25% VCM in biscuits recipe resulted significant decreased in oleic acid and palmitic acid while myristic acid, lauric acid, capric and caprylic increased as figured in Table 2. Lauric acid is a medium chain fatty acid, which has the additional benefi-cial function of being formed into monolaurin in the hu-man or animal body. The mineral content of biscuits was tabulated in Table 1. As the VCM content increased from 5-25% in refined wheat flour, the mineral content, particu-larly calcium, potassium, iron and sodium contents were increased and improved the nutritional quality characteris-tic of biscuits. Calcium content was increased from 9.55 to 24.35 mg/100 g, potassium 59.24 to 442.06 mg/100 g, iron 1.05 to 5.97 mg/100 g, zinc 0.22 to 0.73 mg/100 g and sodium 99.37 to 132.35 mg/100 g (Table 1).
3.3. Effect on Physical Properties of VCM Biscuits
Spread ratio was slightly increased with rise in concen-tration of VCM in biscuits (Table 3). This may be due to the increase in fat content in biscuits with higher VCM. The similar results were reported with corn and potato flour biscuit [24], Oat bran biscuit [4] and raw, toasted wheat bran biscuit [25]. Some authors reported that spread factor is highly affected by fat content, as the content of fat increased spread ratio gradually increased [26] or some had been supported this effect due to the increased ex-tension of the dough [27].
3.4. Influence of VCM on Textural Properties of Biscuits
Table 1. Chemical and nutritional components of biscuits containing VCM (n = 3).
VCM
(%) Moisture (%) Fat (%) Protein (%) Ash content (%) Fiber (%) (mg/100 g)Ca Zn (mg/ 100 g) Na (mg/ 100 g) (mg/100 g) K (mg/100 g) Fe (mg/100 g)Ca
0 3.32a 24.79a 4.56a 0.26a 0.15a 9.55a 0.22a 99.37a 59.24a 1.05a 9.55a
5 3.38a 28.62b 4.78b 0.34b 0.86b 10.51a 0.30ab 104.21a 127.22b 1.78b 10.51a
10 3.48a 31.08c 5.25c 0.44c 1.55c 15.99b 0.39b 120.48b 151.33c 3.03c 15.99b
15 3.56a 32.39d 5.52d 0.53d 2.26d 18.26c 0.52c 123.47b 282.38d 3.65c 18.26c
20 4.04b 36.81e 5.82d 0.62e 2.9e 22.47d 0.58d 130.55c 365.14e 5.07d 22.47d
25 4.46c 39.34f 5.97e 0.73f 3.55f 24.35d 0.73d 132.35c 442.06f 5.97e 24.35d
[image:4.595.60.545.315.419.2]Mean values with the same superscript letters within the same column do not differ significantly (p > 0.05)
Table 2.Fatty Acid Profile (%) of VCM Biscuits (n = 3).
VCM (%) Capric (%) Caprylic (%) Lauric (%) Myristic (%) Palmitic (%) Stearic (%) Oleic (%)
0 0.75 ± 0.07* 0.45 ± 0.04 0.94 ± 0.04 2.11 ± 0.02 42.95 ± 0.02 4.99 ± 0.01 47.77 ± 0.03
5 0.86 ± 0.12 0.61 ± 0.05 5.98 ± 0.01 3.25 ± 0.08 39.72 ± 0.03 4.48 ± 0.02 45.05 ± 0.01
10 1.14 ± 0.05 1.54 ± 0.01 9.98 ± 0.01 5.29 ± 0.08 38.14 ± 0.05 4.49 ± 0.07 39.40 ± 0.06
15 1.17 ± 0.01 1.64 ± 0.04 11.39 ± 0.01 6.26 ± 0.14 36.56 ± 0.03 4.44 ± 0.02 38.53 ± 0.07
20 2.17 ± 0.01 1.77 ± 0.02 14.47 ± 0.10 6.93 ± 0.01 32.29 ± 0.06 4.36 ± 0.03 37.54 ± 0.02
25 2.27 ± 0.02 1.82 ± 0.01 17.39 ± 0.06 8.56 ± 0.08 29.34 ± 0.04 4.18 ± 0.03 34.77 ± 0.07
*Mean ± S. D
Table 3. Textural Properties of biscuits containing VCM (n = 3).
VCM (%)
Spread ratio
Breaking strength (N)
Hardness (N)
Cutting force (N)
0 9.63a 68.89a 10.90a 46.23a
5 9.67a 69.09a 9.98a 39.56b
10 9.72ab 63.32b 9.38a 37.59bc
15 9.81b 47.77c 9.49a 35.44cd
20 9.92c 21.84d 7.21b 33.21d
25 9.88c 16.54e 6.22b 28.09e
Mean values with the same superscript letters within the same column do not differ significantly (p > 0.05)
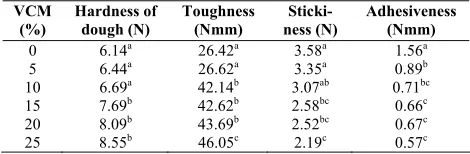
Table 4.Effect of incorporation of VCM on textural char-acteristics of biscuit dough (n = 3).
VCM (%)
Hardness of dough (N)
Toughness (Nmm)
Sticki-ness (N)
Adhesiveness (Nmm)
0 6.14a 26.42a 3.58a 1.56a
5 6.44a 26.62a 3.35a 0.89b
10 6.69a 42.14b 3.07ab 0.71bc
15 7.69b 42.62b 2.58bc 0.66c
20 8.09b 43.69b 2.52bc 0.67c
25 8.55b 46.05c 2.19c 0.57c
Mean values with the same superscript letters within the same column do not differ significantly (p > 0.05)
case of hardness there was no significant difference showed till the level of 15% and then there was significant decrease showed at 20-25% incorporation level.
3.5. Influence of VCM on Textural Properties of Dough
[image:4.595.55.289.472.569.2] [image:4.595.54.289.625.702.2]stickiness of dough due to presence of VCM may be at-tributed to the larger particle size of VCM (0.5 mm) than the refined flour (0.15 mm) as the larger particle absorbed more water and free water content for dough formation become less and resulted decrease in stickiness [29].
3.6. Influence of VCM on Color Values of Biscuits
Surface browning is a common phenomenon for biscuits during baking. Brown pigments are formed in the ad-vanced stages of browning reactions and can be measured by color determination. Color measurements provide a useful index to evaluate the intensity of browning reac-tions and have been used to monitor the processing of bread [30]. In the present study the L* value of VCM biscuit decreased while a* and b* value increased with increased proportion of VCM (Table 5). The increase in a* and b* stimulus may be due to increase in redness and yellowness during baking. The similar trend has been reported biscuits fortified with corn and potato flour [24]. The decreased L*values and increased a* and b* values resulted in darkening of the biscuits, which ultimately affected the sensory scores for colour.
3.7. Effect on Thermal Properties of VCM Biscuits
The thermal properties of the biscuits were examined using Differential scanning calorimetry and results were shown in Table 6. The onset temperature (To)
signifi-cantly decreased while end set temperature (Tc) and
en-thalpy of gelatonization (ΔH) significantly (p > 0.05) increased from 60.78 to 59.04°C, 86.74 to 98.75°C and 14.87 to 90.53 J/g respectively for 5 to 25% incorporation of VCM. In present study Tc and ΔH were higher than control because of the presence of other ingredients in the system, especially VCM. As percentage of fiber increased with increasing level of VCM it may be competing with starch for water absorption and hence limiting starch swelling and gelation events resulting in higher Tc value
similar findings has been reported in pasta containing pea fiber [31]. As per result obtained in this study suggest that the enthalpy of a complex increased with increasing VCM concentration. It may be due to increase in moisture con-tent as earlier researchers have reported that the gelaniza-tion enthalpy increased with increasing moisture content [32,33].
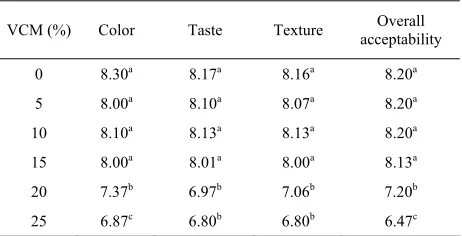
3.8. Changes in Sensory Quality
[image:5.595.307.536.101.189.2]Results of sensory evaluation in terms of sensory attrib-utes such as color, taste, texture and Overall acceptability showed that VCM incorporated biscuits were in accept-able range (Table 7). Substitution of refined wheat flour with VCM up to 15% did not change the sensory attributes of biscuits. However, further addition of VCM (above 15%) significantly decreased all the sensory parameters of
Table 5.Effect of VCM on color values of biscuit crust (n = 3).
VCM (%) L* a* b*
0 55.06a 5.55a 21.41a
5 54.85a 6.03a 21.69a
10 54.91a 6.16ab 22.49a
15 54.31b 7.57bc 22.68a
20 52.15b 7.73c 25.10b
25 50.94b 8.91c 25.15b
[image:5.595.307.539.247.357.2]Mean values with the same superscript letters within the same column do not differ significantly (p > 0.05)
Table 6.Effect of VCM on the onset, endset temperature and enthalpy of gelatinization of biscuits (n = 3).
VCM (%) To(°C) Tc(°C) ∆H(J/g)
0 60.78a 86.74a 14.87a
5 59.64b 88.79b 45.93b
10 59.44b 89.08b 61.87c
15 59.43b 89.89b 74.77d
20 59.25b 93.81c 84.66e
25 59.04b 98.75d 90.53f
Mean values with the same superscript letters within the same column do not differ significantly (p > 0.05)
Table 7.Sensory parameters of biscuits containing VCM (n = 3).
VCM (%) Color Taste Texture acceptability Overall
0 8.30a 8.17a 8.16a 8.20a
5 8.00a 8.10a 8.07a 8.20a
10 8.10a 8.13a 8.13a 8.20a
15 8.00a 8.01a 8.00a 8.13a
20 7.37b 6.97b 7.06b 7.20b
25 6.87c 6.80b 6.80b 6.47c
Mean values with the same superscript letters within the same column do not differ significantly (p > 0.05)
the biscuits. Based on the results, biscuits contained up to 15% VCM were rated as the most acceptable as their overall acceptability was comparable to the control sam-ples (without VCM).
4. Conclusions
[image:5.595.308.539.413.531.2]varied significantly with addition of VCM than the control. The data obtained from thermal property showed that onset (To), endset (Tc) temperatures and enthalpy of
ge-latinization (ΔH) got affected by VCM. The study estab-lished that the incorporation of 15% VCM results in more nutritious product with acceptable sensory and textural characteristics.
5. Acknowledgement
Authors express their gratitude to the National Agricul-tural Innovation Project (NAIP) and Director, Central Plantation Crops Research Institute (CPCRI), kasargod, Kerala for providing the VCM required for the study.
REFERENCES
[1] B. Singh, M. Bajaj, A. Kaur, S. Sharma and J. S. Sidhu, “Studies on the Development of High Protein Biscuits from Composite Flour,” Plant Foods for Human Nutrition, Vol. 43, No. 2, March 1993, pp. 181-189.
[2] M. R. Zoulikha, B. Jean-Marie, A. Karim and P. Christian, “Effect of Principal Ingredients on Rheological Behaviour of Biscuit Dough and on Quality of Biscuit,” Journal of Food Engineering, Vol. 35, No. 1, January 1998, pp. 23-42.
[3] A. Sindhuja, M. L. Sudha and A. Rahim, “Effect of Incorporation of Amaranth Flour on the Quality of Cookies,” European Food Research and Technology, Vol. 221, No. 5, October 2005, pp. 597-601.
[4] M. L. Sudha, R. Vetrimani and K. Leelavathi, “Influence of Fibre from Different Cereals on the Rheological Characteristics of Wheat Flour Dough and on Biscuit Quality,” Food Chemistry, Vol. 100, No. 4, January 2007, pp. 1365-1370.
[5] C. C. Tsen, E. M. Peters, T. Schaffer and W. J. Hoover, “High Protein Cookies: Effect of Soy Fortification and Surfactants,” Bakers Digest, Vol. 47, No. 4, 1983, pp. 34-37.
[6] V. Subrahmanyan, “Manufacture of Nutro Biscuits,” Research Industry, Vol. 3, 1958, pp. 178-179.
[7] C. W. Blessin, G. E. Inglett, W. J. Garcia and W. L. Deathrage, “Defatted Germ Flour-Food Ingredients from Corn,” Food Product Development, Vol. 6, No. 3, May 1972, pp. 34-35.
[8] N. E. Fogg and G. L. Tinklin, “Influence of Glandless Cottonseed Flour on Quality Acceptability and Amino Acid of Sugar Cookies,” Cereal Science Today, Vol. 17, No. 70, January 1972, pp. 70-75.
[9] C. W. Bajaj, A. Kaur and J. S. Sidhu, “Studies on the Development of Nutritious Cookies Utilizing Sunflower Kernels and Wheat Germ,” Plant Food for Human Nutrition, Vol. 41, No. 4, October 1991, pp. 381-387. [10] C. Ordorica-Falomir and O. Pareds-Lopez, “Effect of
Safflower Protein Isolate on Cookies Characteristics,” International Journal of Food Science and Technology, Vol. 26, No. 1, June 1991, pp. 39-43.
[11] M. N. Khan, R. D. Hagenmaier, L. W. Rooney and K. F. Mattil, “High Fibre Coconut Products for Baking Systems,” Baker’s Digest, Vol. 50, August 1976, pp. 19- 25.
[12] P. Corpuz, “Philippine Oil Seeds and Products Annual,” Global Agricultural Information Network, USDA Foreign Agricultural Service, 2004. http://www.cocoscience.com/ pdf/descriptive_sensory_evaluation.pd
[13] M. Moorthy and K. Viswanathan, “Feeding Value of Extracted Coconut Meal for White Leghorn Layers,” International Journal of Poultry Science, Vol. 5, No. 11, February 2006, pp. 1040-1045.
[14] J. E. D. C. L. Siebra, D. C. M. M. L. Maria, V. B. Jorge, M. D. J. Teresinha and M. Wilson, “Bioeconomic Performance of Growing Finishing Pigs Fed Diet with Coconut Meal,” Revista Brasileira De Zootecnia, Vol. 37, No. 11, November 2008, pp. 1996-2002.
[15] R. S. Lima, F. F. F. Maria de, R. S. Ednardo, S. M. Francisiene, F. B. Rafaele and M. Nadia de, “Coconut Meal in Laying Hens Diets: Nutrients Digestibility, Performance and Egg Quality,” Revista Brasileira De Zootecnia, Vol. 36, No. 5, October 2007, pp. 1340-1346. [16] S. C. S. Barreto, J. F. F. Zapata, E. R. de F. F. Freitas, M.
do Fuentes, R. F. Dos, R. M. Nascimento, R. S. Aranjo and A. D. G. N. Amorim, “Yolk Fatty Acids and Egg Components from Layers Fed Diets with Coconut Meal,” Pesquisa Agropecuária Brasileira, Vol. 41, No. 12, December 2006, pp. 1767-1773.
[17] S. Panigrahi, “Effects of Different Copra Meals and Amino Acid Supplementation on Broiler Chick Growth,” Broiler Poultry Science, Vol. 33, No. 3, July 1992, pp. 683-687.
[18] F. A. S. Dairo, “Evaluation of Protein Replacement Value of Sun Dried and Oven Dried Coconut Oil Meal and Fermented Coconut Oil Meal in Rats,” International Journal Agriculture Research, Vol. 2, 2007, pp. 246-253. [19] Association of Official Analytical Chemists, “Methods
14.002 (Moisture), 14.006 (Ash), 14.019 (oil) and 14.068 (protein),” Official Methods of Analysis, 13th Edition, AOAC, Washington, DC, 1980.
[20] American Association of Cereal Chemist, “Methods 08-50D,” Approved methods of the AACC, 10th Edition; AACC, St. Paul, 1995.
[21] E. Larmond, “Laboratory Methods for Sensory Evaluation of Foods,” Canada Department of Agriculture Publication, Ottawa, 1997.
[22] S. K. Tyagi, M. R. Manikantan, H. S. Oberoi and G. Kaur, “Effect of Mustard Flour Incorporation on Nutrition, Textural and Organoleptic Characteristics of Biscuits,” Journal of Food Engineering, Vol. 80, No. 4, June 2007, pp. 1043-1050.
[24] J. Singh, N. Singh, T. R. Sharma and S. K. Saxena, “Physicochemical, Rheological and Cookie Making Properties of Corn and Potato Flours,” Food Chemistry, Vol. 83, No. 3, November 2003, pp. 387-393.
[25] K. Leelavathi and P. Haridas Rao, “Development of High Fibre Biscuits Using Wheat Bran,” Journal of Food Science and Technology, Vol. 30, No. 3, May/June 1993, pp. 187-190.
[26] A. K. Srivastava and R. P. Haridas, “Studies on Low-Fat Soft Dough Biscuits,” Journal of Food Science and Technology, Vol. 30, No. 1, January/February 1993, pp. 21-24.
[27] S. Chandrashekara and S. R. Shurpalekar, “On the Use of Potato and Cassava Flours in Soft Dough Biscuits,” Journal of Food Science and Technology, Vol. 21, No. 4, July/August 1984, pp. 239-241.
[28] S.-D. Esther, A. L. Jocelyn, J. P. N. Torbgor, A. A. George and B. Agnes, “Effect of Cowpea Addition on Quality and Sensory Characteristics of Cassava-Cowpea Composite Flour Biscuits,” International Union of Food Science and Technology, Nantes, 2006, pp. 1575-1576. http://works. bepress.com/cgi/viewcontent.cgi?article=1014&context=
georgeamponsahannor.
[29] A. Sangnark and A. Noomhorm, “Chemical, Physical and Baking Properties of Dietary Fiber Prepared from Rice Straw,” Food Research International, Vol. 37, No. 1, January 2004, pp. 66-74.
[30] A. Ramírez-Jiménez, E. Guerra-Hernández and B. García-Villanova, “Browning Indicators in Bread,” Journal of Agricultural and Food Chemistry, Vol. 48, No. 9, September 2000, pp. 4176-4181.
[31] C. M. Tudorica, V. Kuri and C. S. Brennan, “Nutritional and Physicochemical Characteristics of Dietary Fiber Enriched Pasta,” Journal of Agriculture and Food Chemistry, Vol. 50, No. 2, January 2002, pp. 347-356. [32] A. M. Abboud and R. C. Hoseney, “Differential Scanning
Calorimetry of Sugar Cookies and Cookie Doughs,” Cereal Chemistry, Vol. 61, No. 1, January 1984, pp. 34-37.