ISSN Online: 2327-5901 ISSN Print: 2327-588X
DOI: 10.4236/jpee.2019.79002 Sep. 18, 2019 11 Journal of Power and Energy Engineering
Impact of Sustainable Electricity for
Cameroonian Population through Energy
Efficiency and Renewable Energies
Fotsing Metegam Isabelle Flora
1, Njomo Donatien
1, René Tchinda
2, Oumarou Hamandjoda
31Environmental Energy Technologies Laboratory (EETL) of the University of Yaounde 1, Yaounde, Cameroon 2Laboratory of Industrial Systems and Environment of the University of Dschang, Dschang, Cameroon 3Energetic Laboratory, National Higher Polytechnic School, Yaounde, Cameroon
Abstract
Access to electricity and a reliable supply of energy are essential elements of local economic development and poverty reduction. To address these chal-lenges, appropriate policies and mechanisms at the national and regional le-vels need to be implemented. In this study, we used Johanson cointegration and Granger causality techniques to examine the different cointegration and causal relationships that exist between the growth of electricity consumption (CE) and socio-economic parameters (GDP, tertiary GDP, GDP per capita, number of households, number of subscribers and population) in Cameroon during the period from 1975 to 2011. The results from the software Eviews 7.2 show that there are cointegration relationships between electricity con-sumption and socio-economic indicators (LGDPH, LPO and LS) thus re-flecting the long-term relationship between socio-economic growth and electricity consumption (CE). Consumption growth could, therefore, follow socio-economic growth. In addition, the analysis of the Granger causality test results reveals that there is a unidirectional causal relationship of macroeco-nomic indicators towards electricity consumption. That is, LGDPG to LCE, LGDPH to LCE, and LGDPT to LCE. There is also a unidirectional relation-ship between LCE and the demographic indicators that is the relationrelation-ship of LCE to LS (number of subscribers). We can, therefore, conclude that the indi-cators that have a better influence on electricity consumption are the overall GDP for the macroeconomic indicators and the population for the so-cio-demographic indicators respectively. In addition, the analysis of renewa-ble energy potential (EnRs) shows us that Cameroon enjoys good irradiation throughout its territory, hence its high solar potential. The wind speed is un-evenly distributed over the territory, it has anaverage speed in the region of
How to cite this paper: Flora, F.M.I., Donatien, N., Tchinda, R. and Hamandjo-da, O. (2019) Impact of Sustainable Elec-tricity for Cameroonian Population through Energy Efficiency and Renewable Energies. Journal of Power and Energy Engineering, 7, 11-51.
https://doi.org/10.4236/jpee.2019.79002
Received: August 15, 2019 Accepted: September 15, 2019 Published: September 18, 2019
Copyright © 2019 by author(s) and Scientific Research Publishing Inc. This work is licensed under the Creative Commons Attribution International License (CC BY 4.0).
DOI: 10.4236/jpee.2019.79002 12 Journal of Power and Energy Engineering
the very north of the country, but a low speed in the rest of the territory, which justifies the low wind potential in the country. We also noticed that the forest is concentrated in the southernmost part of the country, mainly in the eastern and southern regions. After study, we concluded that it is possible to truncate thermal power plants with renewable energy plants. We proposed to trade the thermal power stations of additions by biomass plants. We also offer hybrid solar-biomass power plants for isolated power plants; and solar-wind hybrid power plants for the Far North region of the country, given its strong wind power potential. We also identified the sources of over-consumption and estimated the amount of energy that could be saved by developing an energy efficiency plan (10%) with the standard scenario that would take into account good energy-saving practices. We then estimated at 336,938 Kg the gain in CO2 emissions if we exchanged the thermal power stations into EnRs.
Recommendations are then suggested for the successful implementation of an energy efficiency plan and implementation of renewable energy in Cameroon.
Keywords
Energy Efficiency, Renewable Energy, Cointegration, Causality, Fossil Fuels, Mini-Grids
1. Introduction
In recent decades, global warming has increased dramatically, as evidenced by the continuing deterioration of the environment due to economic growth based on traditional energy consumption. Energy is the building block of the develop-ment of economic activity and has increased its demand as a result of the overall modernization of the economy. One of the pillars of the fight against climate change is to reduce greenhouse gas (GHG) emissions through the use of sus-tainable energies, such as biofuels, biomass, hydroelectricity, solar energy, the wind.
The strong economic growth of Cameroon for more than ten years is accom-panied by an increase in the demand for electricity consumption. In 2012, elec-tricity consumption accounted for only 7.3% of Cameroon’s energy consump-tion. One of the main reasons for this low ratio is the country’s low electrifica-tion rate. It has increased over the 2005-2011 period, from 49.7% to 57%, thanks to the government’s efforts to expand and intensity the electricity grid. This ef-fort has had very positive effects in urban areas but poor results in rural areas where the majority of the population remains without access to the electricity grid: the rate of rural electrification stagnates around 19%.
refrige-DOI: 10.4236/jpee.2019.79002 13 Journal of Power and Energy Engineering
rate vaccines and fragile medicines. Without light, children cannot easily study at night. More and more families are leaving their farms which are their livelih-ood to join the ranks of the poorest people on the outskirts of urban areas. The energy crisis in Cameroon also has economic impacts: electricity is very expen-sive and is only accessible to the most affluent classes. Unstable access to the network hampers the development of businesses and economic activities. It also results in significant food wastage, because the food cannot be refrigerated. However, despite a huge potential in electricity and renewable energy, Came-roon has significant energy deficits. The country’s resources are under-exploited and wasted during transport. As a result, the supply available to the population is largely insufficient.
The electrical operator ENEO, in charge of the management of the electricity system as a whole (production, transmission and distribution of electricity) is having difficulties to meet this strong demand, particularly at peak hours, and is not in a position of meeting all the electricity needs of the country, both in terms of quantity and quality of electricity delivered. Plans have been made to streng-then production capacity in the future, but it is certain that the necessarily long time frames for implementing these investment programs will not allow for quick and effective solutions to the current imbalance between supply and de-mand of electricity.
Energy efficiency and renewable energies thus become the essential instru-ment for responding in the short and medium term the growing consumer de-mand, but also as a long-term policy to reduce energy consumption and limit investment in electrical energy production. Energy efficiency means rational use of energy by increasing the efficiency of its production, transportation, distribu-tion and final consumpdistribu-tion. This is to disconnect economic growth (which must not be compromised at all) from energy growth. A one-way causality relation-ship of GDP to the electricity consumption of the population should be observed, so that it can be argued that the implementation of an energy efficien-cy poliefficien-cy will not jeopardize the country’s economic growth. Thus the energy security of the country could be increased and substantial savings could be made in the import of fossil fuels whose price continues to grow. It should be noted that the cost of generating electricity from thermal power plants is more expen-sive than that generated by hydroelectric power plants. Since some thermal power plants are used for peak power management, controlling electricity de-mand would reduce the high dede-mand at the peak and thus reduce the use of fos-sil fuels. It should also be noted that the consumption of fosfos-sil fuels produces greenhouse gases (GHGs) that are responsible for climate change. Cameroon, however, has huge resources in renewable energy that are biomass, hydropower, solar energy. These renewable energies are now the best way to fight against the observed climate change.
coun-DOI: 10.4236/jpee.2019.79002 14 Journal of Power and Energy Engineering
try. Mini-grid technologies are mature enough which can be fully integrated into rural electrification plans. In addition, the use of mini-grids based on renewable energies can provide electricity at a lower cost than using fossil fuels (fossil-fired power plants). They also increase energy security and improve adaptability un-der changing climatic conditions. Rural population could thus contribute to the production of their electricity by collecting biomass. However, in Cameroon, neither 2030 Electricity Sector Development Plan (ESDP 2030), 2035 Strategic Document for Growth and Employment (ECSD 2035), really seem to integrate renewable energies into development action programs, despite the diversified potential available through agro-ecological factors.
In this work, we will first present the socio-economic indicators likely to in-fluence the consumption of electricity in Cameroon; we will then show the rela-tionship between these indicators and electricity consumption. Then, we will present the current production of electricity in Cameroon (hydroelectric plants and thermal power plants) to evaluate the energy produced by thermal power plants. We will then present the potential of biomass, solar and wind power in Cameroon to show that it is possible to substitute thermal power plants for solar or biomass plants. We will then lead to a prospective modeling of the electricity demand of the Cameroonian population. A scenario test including energy effi-ciency will be done and an assessment of the CO2 emission gain and
recom-mendations for the success of an energy efficiency plan and implementation of the EnRs will close this study. We will then present ten recommendations for the success of sustainable electrification in Cameroon. This may be an example for many developing countries.
2. Literature Review
2.1. Socio-Demographic Indicators
At the end of 2012, the total population of Cameroon was estimated at about 21.7 million, corresponding to an average density of 44.8 inhabitants/km2 and a
population growth of 2.54% (World Bank,2018) [1]).
The spatial coverage of Cameroon’s current electricity grid is subdivided into three networks, as follows:
• The South Interconnected Network (RIS) covering the six regions of the
Center, Littoral, West, North-West, South-West and South.
• The North Interconnected Network (RIN) covering the three northern
re-gions (Adamawa, North and Far North).
• And the East Network (RIE) which is not interconnected and whose spatial
coverage is exclusively within the Eastern region.
cov-DOI: 10.4236/jpee.2019.79002 15 Journal of Power and Energy Engineering
ered by forest and sparsely populated, is decreasing (from 4.8% in 1976 to 4% in 2012) (INS, 2010) [2].
The proportion of the rural population in Cameroon continues to remain sig-nificant, i.e. 48% in 2010 according to the NSI’s estimates, despite a clear down-ward trend since 1976. The rate of urbanization of the population in Cameroon is, however, from 28.5% in 1976 to 52% in 2010, reflecting sustained growth in the total urban population, with an average annual growth rate (AAGR) esti-mated at 4.6% over the entire period 1976-2010, compared with 1.5% average annual growth of the rural population. Poverty is more pronounced in rural areas, particularly in the three regions of the RIN zone, since the income of this population comes mainly from the agricultural sector and this sector is vulnera-ble to climatic hazards; the intermittency of the incomes it offers and its charac-ter which has remained traditional and very little mechanized in several regions of the country. Thus, poverty is most prevalent and accentuated among the em-ployed labor force in the informal agricultural sector. Those with formal private or administrative activities appear to be the least affected by poverty. These ac-tivities are more developed in urban areas and in the largest socio-economic centers of the country, such as Douala and Yaounde.
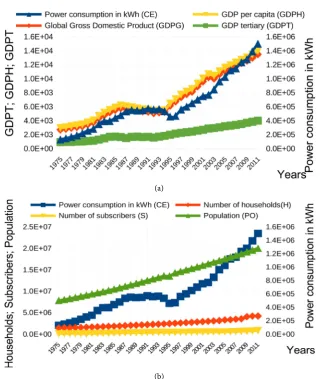
Figure 1 shows the evolution of the distribution of the Cameroonian popula-tion until 2017. The analysis of Figure 1(a) shows us that in 2008, the percentage of the rural population falls below that of the urban population and reaches re-spectively 44% against 56%. This decrease in the percentage of the rural popula-tion with respect to the urban populapopula-tion is mainly due to the rural exodus and the urbanization of several rural areas which thus become urban areas. The analysis in Figure 1(b) shows that the rate of access to electricity has changed significantly for the urban area, but has not changed much in the ru-ral area.
2.2. Macroeconomic Aggregates (INS, 2010) [2]
The analysis of the real GDP structure for 2009 shows that the tertiary sector (trade, hotels and restaurants, transport and communication, finance and real estate, administrative services, miscellaneous services) was the main component of the national GDP, with an estimated share of nearly 47%. Commercial activi-ties, with restaurant and hotel services, are the mainstay of this sector, account-ing for 20.1% of total national GDP, due to the low investment requirement compared to other economic sectors.
The share of the secondary sector (mining and extractions and oil activities included, manufacturing industries, construction, electricity, gas and water) represents the second largest economic sector, with a share estimated at nearly 30% of real GDP in 2009. Manufacturing industries represent here the main sub-sector, with a contribution to the national GDP of nearly 16%, estimated in the same year.
fish-DOI: 10.4236/jpee.2019.79002 16 Journal of Power and Energy Engineering
ing, hunting and livestock farming) accounted for less than a quarter of national GDP at constant prices, or nearly 23% in 2009. The main primary subsector is subsistence agriculture, which accounted for 63% of primary GDP in the same year, compared to 13% for forestry, 12% for livestock and hunting, 6.5% for in-dustrial and agricultural export and 5.5% for fishing (INS, 2010) [2].
Figure 2 shows the electricity consumption in kWh per capita in Cameroon from 1971 to 2014. We note that this consumption increases over time. The pe-riod from 2006 to 2011 corresponds to the pepe-riod of strong growth of this elec-tricity consumption by inhabitant. This can be justified by a greater electric cov-erage and the increase of electrical appliances in households as well as their standard of living.
2.3. Context of Electric Power in Cameroon
The electricity generation fleet managed by ENEO includes three hydroelectric plants, two of which supply the RIS, and nine thermal power plants connected to the grid, of which eight (8) are on the RIS. At the end of 2011, there were also 27 isolated generating stations, of which 12 exist in RIS-assisted areas, 8 in the
(a)
[image:6.595.211.541.330.695.2](b)
DOI: 10.4236/jpee.2019.79002 17 Journal of Power and Energy Engineering Figure 2. Evolution of the GDP per person employed in Cameroon (Source: World Bank, 2018) [1].
North regions served by the RIN, and 6 more are located in the Eastern network area. The latter will be designated by RIE, by analogy with RIS and RIN. Thus, more than 56% of the workforce of the electric park is concentrated in the large zone of the South with 83% of the main plants connected to the network and 44% of the isolated plants; this should reflect the relative importance of the de-mand for the Great South network. Hydroelectric generation accounted for the bulk of national production, with over 92% of the national production of power plants managed by ENEO over the period 2005-2011.
Isolated thermal power plants represented, for their part, an average of 1.6% of the national production of ENEO, with a maximum of 1.8% recorded in 2011. It should be recalled here that isolated thermal power plants supply very often isolated areas which correspond to rural areas. We understand why rural areas are not electrified. In Cameroon, most mini-grids rely solely on fossil fuels (fuel oil) for electricity generation. However, the use of renewable energies in mini-grids would reduce electricity generation costs, improve energy security and reduce environmental pollution.
Figure 3 shows the energy map of Cameroon. Blue hexes represent hydroe-lectric power stations, black power plants. We also represent the existing power grid in Cameroon. The various streams and roads are also represented in Figure 3 as well as population density. Figure 4 shows the proportions of energy sources produced in Cameroon. We find that hydropower production is predo-minant and is only rescued by oil-fired power plants up to 2006. However, starting in 2007, we see the introduction of a new source of energy production, which is natural gas from the Kribi gas station. Between 2006 and 2015, there was a drop in production of hydroelectric power plants in favor of a growing production of oil and gas thermal power plants.
DOI: 10.4236/jpee.2019.79002 18 Journal of Power and Energy Engineering
[image:8.595.152.541.139.691.2]of this electricity until 2015. The electricity production of the various power plants accounts for about 75% of the total production of all plants in 2015. The share of oil-fired power plants is about 18% of the total and the gas-fired power plant about 6% in 2015. Let us recall here that electricity from gas-fired power
DOI: 10.4236/jpee.2019.79002 19 Journal of Power and Energy Engineering
plants began in 2007 with the Kribi gas-fired power station. We can also note from Figure 5 that transmission and distribution losses accounted for more than 11% of total electricity generation in 2014. This is due to the aging of transmis-sion lines that are obsolete today. The new, more efficient transmistransmis-sion lines would improve the transport and distribution of electricity. Off-shored produc-tion would also reduce the length of transmission lines and thus the losses allo-cated to it.
Figure 6shows the evolution per capita annual of electricity consumption and per capita as well as CO2 emissions in Cameroon. We can see that in 2014,
an-nual per capita consumption was about 280 kWh, or about 0.76 kWh per capita per day. This low per capita electricity consumption is due to the fact that a large part of the population is not yet electrified. This population is greatly constituted of the rural population which represents about 46% of the total population of Cameroon and therefore only about 22% had access to electricity in 2014. We also find that the CO2 emission per capita is less than 0.7 metric tons. This CO2
[image:9.595.138.540.331.509.2]emission per inhabitant decreases sharply over time and reaches 0.3 metric tons
[image:9.595.209.536.536.664.2]Figure 4. Proportion of sources of energy production in Cameroon (Source: World Bank 2018) [1].
DOI: 10.4236/jpee.2019.79002 20 Journal of Power and Energy Engineering Figure 6. Electric power consumption and CO2 emission per capita of Cameroon (Source: World bank, 2018) [1].
in 2014. This low emission rate could be due to the fact that electricity produc-tion in 2014 was 74% hydroelectric and only 24% thermal (oil and natural gas). Remember that natural gas produces very little CO2 compared to fuel oil.
For the period of use of the plants during the peak, the calculations were made by comparing the energy produced at each plant to the annual peak of the same plant. The duration of use thus calculated for each plant makes it possible to con-vert the energy produced by a power plant (MWh) into peak power (in MW).
The study of the daily average load curves of RIS and RIN shows us that the daily peak is observed in both networks around 8 pm. This is due to the return of households in their different homes and the high use of electrical appliances and also lighting due to the darkness. We can also note that the peak of the RIS network always occurs, during the period studied, in December, on a working day around 8 pm. This peak has evolved with an average annual growth rate of 6.3% per year between 2005 and 2011. Moreover, the tip of the RIN is shifted in time from two to three months compared to that of RIS. It took place, over the period considered, twice in February, but most often in March, on a working day around 8 pm. This peak has evolved at an average rate of 4.5% per year. For the period of use of the plants during the peak, the calculations were made by com-paring the energy produced at each plant to the annual peak of the same plant. The duration of use thus calculated for each plant makes it possible to convert the energy produced by a power plant (MWh) into peak power (in MW).
2.4. GHG Emissions in Thermal Power Plants
Thermal power plants used in Cameroon use oil or gas.
We can see from Table 1 that electricity generation from hydro has the lowest CO2 emissions and that from coal has the highest emission. It should be noted
DOI: 10.4236/jpee.2019.79002 21 Journal of Power and Energy Engineering Table 1. CO2 emission of the different electricity production sectors.
Modes of
production Hydraulic 1 kWh Nuclear 1 kWh 1 kWh Wind Photovoltaic 1 kWh 1 kWh Thermal combined cycle 1 kWh Thermal Natural Gas Thermal oil 1 kWh Thermal Coal 1 kWh CO2 emission in g
CO2 eq/kWh 4 6 3 à 22 60 à 150 427 883 891 978
may arise from its supply (dependence on the Middle East), its future scarcity, its negative effects on the environment and disruption of climate change, it will be necessary to think of migrating towards renewable energies that are more res-pectful of the environment.
2.5. Potentials of Renewable Energies in Cameroon
Electricity consumption has increased in recent years with rapid growth in the residential, commercial and industrial sectors. For the moment, electricity de-mand in Cameroon is provided by hydroelectric power stations and oil or gas thermal power plants. The problems caused by the use of fossil fuels are well known: air pollution, greenhouse effect and aerosol production. Faced with this, it is possible that in certain specific cases other sources of so-called renewable energies such as solar energy and biomass are more profitable or more practical to implement. The renewable energy potential in Cameroon is as follows:
AEEP-Cameroon (2013) [6].
• Hydroelectric potential: Cameroon’s hydroelectric potential is very
impres-sive with an estimated power of about 115 GWH/year. However, the hydroe-lectric capacity used by the country represents only 4% of technically ex-ploitable reserves.
• Solar potential: All regions of Cameroon benefit from a significant average
annual sunshine: 4.5 kWh/m2/day in the South and 5.74 kWh/m2/day in the
North.
• Biomass potential: Cameroon’s potential to generate electricity from biomass
waste is estimated at 1072 GWh, of which 700 GWh could be exported to the grid.
• Potential of the wind: the important deposits are located at the extreme
North (kaelé velocity of 2 m/s); in Mount Bamboutos (42 MW expandable); and in the coastal zone.
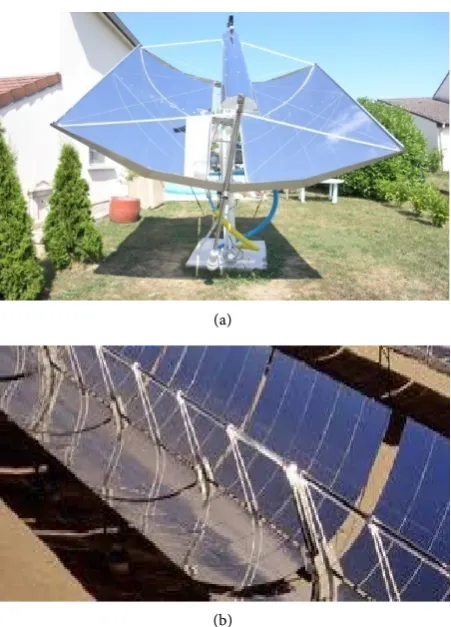
2.5.1. Solar Power Plants
Solar power plants use the energy contained in solar radiation and convert it in-to low voltage direct current. Solar systems, especially solar concentrating sys-tems, are increasingly being used to help meeting energy needs. The technology of solar concentrators has just reached a very remarkable level, using reflectors to focus the sun’s rays on a small area. Figure 7(a) and Figure 7(b) show us pictures of cylindro-parabolic concentrator panels installed for house feeding in
DOI: 10.4236/jpee.2019.79002 22 Journal of Power and Energy Engineering
(a)
[image:12.595.261.487.66.380.2](b)
Figure 7. Solar panels with cylindro-parabolic concentrators.
2.5.2. Biomass Plants
Biomass is defined as all organic matter of animal or vegetable origin (industries, biodegradable household waste, wood, vegetable waste, algae, etc.) that can be-come a source of energy either by combustion or following one or more stages of transformation. There are many techniques for producing heat and electricity from biomass. Biomass can be upgraded to heat and/or electricity thermochem-ical or biochemthermochem-ical. Thermochemthermochem-ical treatments can be classified into four broad categories:
• Combustion allows a direct transformation of biomass into heat energy that
can be used as such or converted into electricity.
• Cooking involves burning biomass with coal in traditional power plant boilers. • Pyrolysis traditionally uses temperatures of 300˚C to 600˚C and produces
charcoal.
• Gasification heats solid biomass at high temperatures in an oxygfree
en-vironment to produce a combustible gas (or syngas).
• Cogeneration recovers the thermal energy normally lost during the
produc-tion of electrical energy, and provides heat and electricity with a significantly higher overall efficiency than that resulting from separate dies.
The valorization electricity of the biomass can also be done by biochemical way. Anaerobic digestion of biomass produces a combustible gas called biogas.
DOI: 10.4236/jpee.2019.79002 23 Journal of Power and Energy Engineering
and whose recovery technologies are mature and proven (combustion boiler, di-gester). Biomass promotes rural job creation and decentralized energy produc-tion. Faced with the scarcity of fossil fuels, their rising prices, the geopolitical stakes linked to these energies and the awareness of the climate issues, biomass is one of the answers for sustainable energy production. In addition, the biomass boiler is a renewable energy that is storable and non-intermittent, compared to wind and solar energy. Figure 8 shows a bio-digester for storing organic waste decomposition occurs after the bigaz that can be used either for cooking or for the production of electricity.
2.6. Potential of Electricity Saving in the Cameroonian Population
2.6.1. Potential Savings in the Tertiary Sector
In the tertiary building sector, electricity conservation measures concern air conditioning and lighting. The potential savings of existing buildings are divided between short-term actions affecting the organization, awareness and streng-thening of the maintenance program; and medium-term actions aimed at im-proving the performance of lighting and air conditioning. This objective is par-ticularly sensitive for the public sector, whose lowering of the cost of electricity bills is an essential requirement. The reduction of electricity consumption is, therefore, an essential issue that is primarily based on the appointment and training of an energy manager in charge of managing awareness actions and the implementation of low-cost measures.
2.6.2. Potential Savings in the Residential Sector
[image:13.595.233.519.555.705.2]The residential sector is characterized by a profound change in the level of household equipment as a result of development policies and the improvement of residents’ income. Data on the decomposition of electricity use by households confirm the trend towards an ever greater share of electrical equipment. The savings potential is both presents in the improvement of household equipment today (lighting, televisions, refrigerators) but also in the goods that will be ac-quired in the coming years (housing, air conditioners, household equipment). In particular, housing construction has great potential for savings. Rather than “let
DOI: 10.4236/jpee.2019.79002 24 Journal of Power and Energy Engineering
it go”, energy efficiency measures must accompany the development of air con-ditioning housing: these measures must relate to the rules of construction (insu-lation, solar protection) and the performance of air conditioners (energy per-formance standards). In the residential sector even more than in other sectors targeted by the study, the significant savings potential estimated at 30% is based on the regulatory and normative approach. All domestic appliances used by households must be subject to the definition of minimum energy performance, either in a pure Cameroon context, or by reference to what is done in other countries, developed or developing.
2.7. Empirical Studies
The question of obtaining reliable prospective methods for electricity consump-tion has been widely discussed by past research. In addiconsump-tion, studies have also been done on electrification from green energies.
Nadejda Victor and Christopher Nichols (2014) [7] propose a regression
me-thod for forecasting annual electricity consumption in non-OECD countries. They find that the introduction of the brightness variable in addition to the so-cio-economic variables allows an improvement in the quality of electricity de-mand forecasting.
Speaking of electricity modeling in African countries, Helene Ahlborg et al. (2015) [8] analyzed the electrification of African households and gave the im-portance of a democracy and a quality institution for better electrification. They make a case study of 44 African countries from 1996 to 2009. Based on this analysis, it appears that democracy and a quality institution have a positive im-pact on the GDP of household electricity consumption. Oluremi Kayode et al. (2011) [9]used an econometric model (VAR and VECM) to estimate urban res-idential electricity demand in Nigeria. They suggest that this hybrid approach involving econometric and dynamic system techniques can lead to better fore-casting of electricity demand in developing countries. Patrice Ongono (2010)
[10]analyzes the impact of electricity consumption on global and sectoral (pri-mary, secondary and tertiary) economic performance (GDP) in Cameroon by analyzing the causality between electricity consumption and GDP. Estimating a VAR model shows that a 1% increase in electricity consumption results in a 0.6% increase in value-added in services.
Numerous studies have evaluated the techno-economic feasibility of green energy supply projects. Neves D. et al.(2014) [11] presented a review of hybrid renewable energy systems for micro-communities in remote islands and villages. They found that data reporting is particularly weak for many of these projects and recommends a structured framework to facilitate analysis and evaluation.
Zbigniew Chmiel et al.(2015) [12] analyzed the off-grid electrification system on
be-DOI: 10.4236/jpee.2019.79002 25 Journal of Power and Energy Engineering
lieve that this should be a lesson for developing countries. Subhes and C.
Bhat-tacharyya (2015) [13] studied the electrification of an isolated village using
mini-grids in Bangladesh. For this study, they use Homer software to perform a technical-economic analysis of the electrification of the village. They find that the best configurations for this site are the hybrid PV-diesel and wind-diesel systems. Subhes et al. (2016) [14] analyzed off-grid electrification from green energy mini-grids for developing countries. At the end of this study, they give ten recommendations for the promotion of mini-grids. Givler T and Lilienthal P
(2005) [15] conducted a study on the electrification of Sri Lanka from hybrid systems. The study found that the PV-diesel hybrid was better than the others.
H. Pettifo et al.(2015) [16]present one of the first empirical examinations of the
success of the “green market” to influence owner renovation decisions. Using a repeated measure model in which households were interviewed before and after the launch of the “green market” in January 2013, they assessed the success of the energy efficiency awareness policy. Mohammed Ebrahim et al.(2016) [17]
did a study to discuss the concept of the green economy in relation to renewable energies. They demonstrate the interdependence of the green economy and the quality of the environment as well as the compatibility of the green economy approach with the notion of sustainable development. In addition, this study il-lustrates the importance of CO2 emissions produced by biomass energy from
fossil fuel combustion. I. K. Maji and C. Sulaiman(2019) [18] evaluate the im-pact of renewable energies on the economic growth of West African countries using dynamic ordinary least squares using a sample of 15 African countries West covering the period 1995-2014. The results show that renewable energy consumption is slowing economic growth in these countries. This is due to the use of woody biomass which is impure and highly polluting when burned. In addition, the use of solar, wind and hydro, which has no side effect on human health and the environment, is less widespread in West Africa. They conclude that the use of renewable energy can slow down economic growth by reducing productivity when unclean and inefficient sources are used. H. R. Bohlmann et al.(2019) [19]examine the long-term regional economic effects in South Africa of transforming the electricity mix into lower coal production. The overall re-sults from all scenarios suggest that the effect of the transition to an energy mix with a smaller share of coal production is sensitive to other economic and polit-ical conditions, particularly the global coal market response, and hence to South Africa’s coal exports. B.T. Olanrewaju et al.(2019) [20]study the determinants of renewable energy consumption in Africa (Nigeria (West), Egypt (North), Ethiopia (East), DR Congo (Central) and South Africa (South)), in order to un-derstand the current pattern and its potential determinants using annual data from 1990 to 2015. The empirical analysis consisted of estimating fixed effects and random effects models, the Hausman test 2 was used to select the appropri-ate panel model and was significant at p ≤ 0.05. B. Ozcan and I. Ozturk (2019)
DOI: 10.4236/jpee.2019.79002 26 Journal of Power and Energy Engineering
growth in 17 emerging countries during the period 1990-2016. The bootstrap panel causality test, taking into account the dependency between countries and the heterogeneity of slope parameters, developed by Kónya (2006) was used. The results show that the neutrality assumption holds for all the markets studied, with the exception of Poland, which confirmed the growth hypothesis. The lack of causality from renewable energy demand to economic growth suggests that energy-saving (mitigation) policies have no detrimental effect on the growth rates of these 16 emerging economies. For Poland; however, energy-saving poli-cies can have adverse effects on the country’s level of economic performance. R.
Antonietti and F. Fontini (2019) [22] analyze the relationship between energy
intensity and energy price in a panel of 120 countries over a 34-year period, from 1980 to 2013. They use information on energy intensity and the real price of oil, and they merge them with macroeconomic data on countries. They iden-tify a statistically significant, but small, negative effect of the real price of oil on energy intensity, which corresponds to a positive effect of energy price on energy efficiency. They argue that a global policy to raise oil prices would lead to a li-mited increase in average energy efficiency through more efficient use of energy, but this increase will be dynamic across regions. M. Aydin (2019a) [23]examine the relationship between renewable and non-renewable electricity consumption and economic growth using data for the period 1980-2015 for 26 OECD countries using two different approaches to panel causality in order to make a comparison. The results show that two-way causality is observed between non-renewable elec-tricity consumption and economic growth. They conclude that policymakers should promote renewable electricity consumption to ensure energy security, reduce energy dependency and encourage economic growth. Aydin (2019b) [24]
examines the relationship between economic growth and biomass energy use in the production function of Brazil, Russia, India, China and from South Africa, a BRICS country from 1992 to 2013. They use the Westerlund and Edgerton LM cointegrate panel integration test and the bootstrap panel causality test. They conclude that the BRICS countries should increase the use of biomass energy consumption for a sustainable environment, promoting economic growth and reducing energy dependence. S. Adams et al. (2018) [25] analyze the effect of renewable and non-renewable energy consumption and the type of regime on the economic growth of 30 sub-Saharan African (SSA) countries during the pe-riod from 1980 to 2012. They use cointegration and error correction tests based on heterogeneous panels and find a long-term relationship between the va-riables. The results show that while renewable and non-renewable energies have a significant positive effect on economic growth, non-renewable energies have a stronger growth effect than renewable energies. They conclude that democratic states have higher growth rates than autocratic states. M. Owusu (2018) [26]
examines the causal interdependence between energy consumption, economic growth, and CO2 emissions in Ghana from 1960 to 2015 using Toda-Yamamoto
Johan-DOI: 10.4236/jpee.2019.79002 27 Journal of Power and Energy Engineering
sen-Juselius and the autoregressive distributed shift limit test approach are used to test the cointegration relationship. The results show that the variables are cointegrated. The causality tests reveal that there is a Granger causality relation-ship between energy consumption and CO2 emissions. They conclude that there
is a need to improve energy efficiency through technological advances and to invest in renewable energy to reduce excessive reliance on fossil fuels. A.
Bouk-helkhal and I. Bengana (2018) [27]examine the relationship between CO2
emis-sions, economic growth and electricity consumption in the face of trade open-ness and annual average temperature in four countries North African countries selected for the period 1971-2014. They use the autoregressive distributed delayed cointegration (ARDL) approach called the Bounds approach. The long-term anal-ysis shows that economic growth and electricity consumption are the main cause of environmental degradation, while the increase in temperature over the year leads to an increase in electricity consumption. These results imply that envi-ronmental and economic remedies must be adopted to achieve green growth and sustainable development. SA Kourtzidis et al.(2018) [28] examine the relation-ship between energy use and US economic growth at both national and sectoral levels (Industry, Residential, Electric Power, and Transportation) using an asymmetric-threshold cointegration approach and monthly data from January 1991 to May 2016. Granger causality tests support a neutrality assumption for all sectors, except for the case of total consumption at the country level where un-idirectional causality ranges from energy consumption to economic growth. A.
Sinha et al.(2018) [29]analyze the causal link between economic growth, carbon
emissions, fossil fuel and renewable energy consumption in 11 countries during the period 1990-2016. Empirical evidence confirms that a robust renewable energy policy can be designed by complementing the different results of the causality test, rather than focusing on a particular causality test. C. Tansel and M. Topcu (2018)
[30]examine the long and short-term relationships between total renewable and non-renewable energy consumption and economic growth in the G7 countries over the period 1980-2014 using nonlinear autoregressive lateral shift (NARDL) and asymmetric causality approaches. The results indicate that the production function is important in determining cointegration between variables. The re-sults strongly confirm an asymmetrical relationship between energy consump-tion and long-term economic growth.
DOI: 10.4236/jpee.2019.79002 28 Journal of Power and Energy Engineering
Yushchenko et al.(2018) [32]made a GIS-based assessment of the photovoltaic
(PV) and concentrated solar energy (CSP) production potential in West Africa. They studied both the possibilities offered by large-scale grid-connected solar systems (photovoltaic and concentrated solar technologies) and off-grid (pho-tovoltaic) solar systems. Locations were assessed for their ability to deploy solar systems based on topographical, legal and social constraints, as well as factors that could facilitate or hinder the development of solar generation. The results can be used to identify potential areas of interest for the deployment of solar generation, and as a support for integration between grid extension and off-grid electrification policies. T. R. Ayodele et al.(2018) [33] identified the most suita-ble sites for the development of wind farms in Nigeria. The data presented by the authors was obtained with an appropriate assessment of the wind resource tak-ing into account environmental, social and economic factors. They believe that the information contained in the data could be useful for decision makers, public authorities, engineers, etc. to choose an optimal site. This will ensure optimum investment and return on investment for wind farm developers.
However, very few studies have been done in Africa and even less in Came-roon. An identification of the spatio_temporel potential and sites favorable for the implementation of renewable energies (solar-wind) will be a big step for the promotion of renewable energy in Cameroon. It will also convince and encour-age public services to invest heavily in this sustainable energy source, which is the energy of the future.
3. Methodology
3.1. Data
NB: The consumption of Low Voltage customers in Cameroon is taken as the electricity consumption of the Cameroonian population because it is in this bracket that rural and urban households are found. The data used in this study come from the ENEO database and the INS (National Institute of Statistics). They are spread over the period 1975-2011. These data are: Gross Domestic Product (GDP) in real terms expressed in billions of CFA Francs (GDPG); ter-tiary GDP (GDPT); GDP per capita (GDPH); the electricity consumption of the Cameroonian population (CE); the population (PO); the number of households (H); the number of subscribers (S). In addition, they have undergone a loga-rithmic transformation. The ratings adopted are: L GDPH = logarithm of real GDP; LGDPH = logarithm of GDP per capita; LGDPT = logarithm of tertiary GDP; LCE = logarithm of electricity consumption; LS = logarithm of the num-ber of subscrinum-bers; LH = logarithm of the numnum-ber of households; LPO = loga-rithm of population.
3.1.1. Evolution of Socio-Economic Indicators and Electricity Consumption
DOI: 10.4236/jpee.2019.79002 29 Journal of Power and Energy Engineering
(a)
[image:19.595.213.534.60.440.2](b)
Figure 9. Evolution of CE curves and different macroeconomic indicators (GDP/per ca-pita, Overall GDP and tertiary GDP) and demographic indicators (subscribers, house-holds, population) (sources: B.D. ENEO 2012; INS 2012) [34] [35].
namely the GDPH, the GDPG and the GDPT are 0.7874 respectively; 0.9293 and 0.9422. The different GDPs, therefore, have a positive influence on the CE. We also find that all these variables increase with time, they are temporal or chro-nological data.
DOI: 10.4236/jpee.2019.79002 30 Journal of Power and Energy Engineering
3.1.2. Scenarii for the Evaluation of Energy Efficiency
For this work, we have developed two scenarios of electricity consumption to define an energy efficiency policy in Cameroon. These scenarios are based on different levels of public policy ambition to encourage or demand more efficient use of electricity. These two scenarios, called for the first, ambitious scenario and for the second standard scenario, are based on two different visions:
• Standard EE Scenario: This scenario describes the savings that can be
achieved through a simple, low-cost program to achieve the most easily ac-cessible energy savings;
• Ambitious EE Scenario: This scenario shows the results that can be achieved
through a coherent and proactive program of multiple public actions to sti-mulate or impose the implementation of all measures that are technically and economically possible, that is to say, those whose return time is considered reasonable, depending on the sectors concerned.
In this study, we will only study the standard EE scenario as it is easier to set up than the ambitious EE scenario.
3.1.3. Data for the Spatio_Temporal Analysis of the Solar and Wind Potential in Cameroon
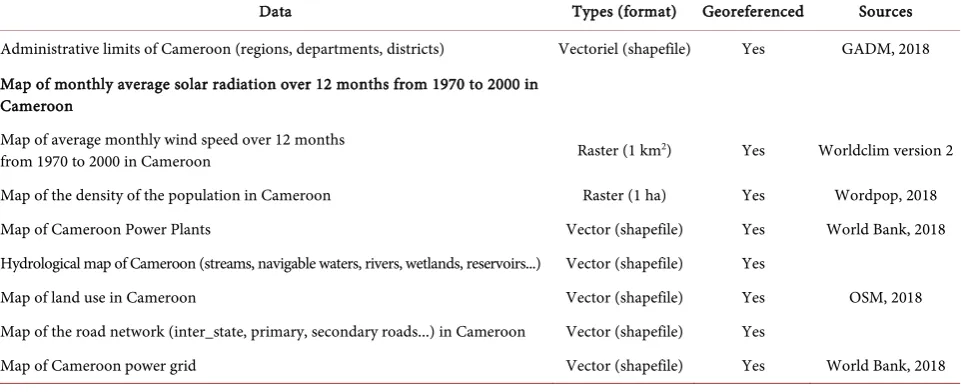
[image:20.595.58.539.527.723.2]In order to arrive at an accurate and reliable estimate of the wind and solar po-tential in Cameroon, appropriate data were collected, modified and analyzed. Several sources are used not only for wind speed and solar irradiance data, but also for the existing energy supply in Cameroon, as well as data on population density. The data sources used for the completion of the project are presented in
Table 2. The wind speed and solar irradiance data are used to define the wind and solar potential respectively. This data comes from the Worldclim 2.0 data-base and runs from 1970 to 2000. The different maps were made using the QGIS 2.18 GIS software. Worldclim provides daily solar irradiation and wind speed data at 10 m above the ground at a grid resolution of 1 km * 1 km, which served
Table 2. Description of the study data.
Data Types (format) Georeferenced Sources Administrative limits of Cameroon (regions, departments, districts) Vectoriel (shapefile) Yes GADM, 2018 Map of monthly average solar radiation over 12 months from 1970 to 2000 in
Cameroon
Map of average monthly wind speed over 12 months
from 1970 to 2000 in Cameroon Raster (1 km2) Yes Worldclim version 2 Map of the density of the population in Cameroon Raster (1 ha) Yes Wordpop, 2018 Map of Cameroon Power Plants Vector (shapefile) Yes World Bank, 2018 Hydrological map of Cameroon (streams, navigable waters, rivers, wetlands, reservoirs...) Vector (shapefile) Yes
OSM, 2018 Map of land use in Cameroon Vector (shapefile) Yes
Map of the road network (inter_state, primary, secondary roads...) in Cameroon Vector (shapefile) Yes
DOI: 10.4236/jpee.2019.79002 31 Journal of Power and Energy Engineering
as a starting point for estimating resource potential. For each cell in the grid, for each cell in the network, a wind speed distribution curve was calculated using Worldclim data, extrapolated to the hub height of the proposed wind turbine (100 m).
3.1.4. Data on Existing Thermal Power Plants in Cameroon
From Table 3, we find that the power plants (grid-connected plants) are used exclusively in the RIS area and have a capacity of 121 MW; the RIN add-in plants are not used. This is due to the fact that the hydraulic production of the RIN can supply all the population connected to its network. Moreover, we notice a power of 2.64 MW for the thermal power plants isolated from the RIS against 5.39 MW for the RIN and 11.5 MW for the RIE. These isolated power plants cover mainly peri-urban and rural areas. The design of renewable mini-grids will take into account the type of region and the renewable energy potential of the region.
3.2. Methodology
In this study, the Eviews 7.0 software [36]was used to determine the relationship between electricity consumption and various socio-economic parameters.
3.2.1. Co-Integration and Causality
This section aims to analyze the relationship between Cameroonian people’s electricity consumption (LCE) and socio-economic indicators (LGDPG, LGDPT, LGDPH, LPO, LH, LS).
1) Stationarity test
This test aims at determining the order of integration of the variables. There are several types of stationarity tests. The Dickey Fuller Augmented (Dickey et al.,1981) [37] and Phillip-Perron tests were selected for this work on the Eviews 7.0 software.
2) Co-integration test
[image:21.595.207.538.553.731.2]The cointegration theory makes it possible to study non-stationary series but
Table 3. Peak power, duration of use and energy emitted from thermal power plants in 2011 in Cameroon (ESDP, 2012) [38].
Thermal power plants Peak power in MW Duration of use of the peak of electricity in hours/year
Output energy MWh
Thermal connected to the RIS network 121 2582 298365 Thermal connected to the RIN network 0 0 0 Total Thermal connected to the network
(RIN + RIS) 121 2582 298365
DOI: 10.4236/jpee.2019.79002 32 Journal of Power and Energy Engineering
of which a linear combination is stationary. It makes it possible to specify stable long-term relationships while simultaneously analyzing the short-term dynamics of the variables considered. Our series have different orders of integration, we will choose Johansen’s technique (Engle, R.F et al., 1981) [39] [40] [41].
3) Granger causality test
Knowledge of the causal relationship between socio-economic variables pro-vides elements of reflection for a better understanding of socio-economic phe-nomena. The Granger concept is retained in the case of this study. According to Granger, a stationary variable Xt causes another stationary variable Yt , if the
knowledge of past values of Xt makes the predictability of Yt (Engle, R.F et al.,
1981) [39] [40] [41].
3.2.2.Assessment of Energy Efficiency Gain
[image:22.595.161.534.393.745.2]The action plan developed for each of the electricity consumption sectors as well as for the supply sector (generation, transmission and distribution of electricity) comprises different types of measures which are listed in Table 4. We have co-lored in red in Table 4. The percentages of the measures to be taken for the evaluation of energy savings among the Cameroonian population in the short term (EE Standard scenario, 10%).
Table 4. Electricity Savings and Energy Efficiency Measures Costs EUEI-PDF and ARSEL (2013) [42].
Categories of measures Energy Ef
Energy saving
As % of annual electricity
consumption of the country* GWh/year In €/year In k
Energy Efficiency Act N/A - - Establishment standardization procedure
labeling 2.0% 10.7 675
Establishment of certification procedure for
auditors and energy managers 0.5% 2.7 225 Education and Training Programs 0.5% 2.7 135
Document Center 0.8% 4.3 180
Support for industrial energy audits 9% 48.4 1575 Support for cogeneration 12% 64.5 3075 Audit of buildings 1.5% 8.0 1035 Managers of public buildings 1.0% 5.5 704
Building Codes** 2.0% 10.8 1375 Public campaigns 1.9% 10.2 1305 Replacement program for incandescent
lamps 1.5 % 8.0 1035
Reduction of losses 3.2% 17.2 2200
DOI: 10.4236/jpee.2019.79002 33 Journal of Power and Energy Engineering
3.2.3. Spatio-Temporal Analysis of the Solar and Wind Potential in Cameroon
The data used for the temporal-time analysis are rasters of resolution 1 km * 1 km. This is for the evaluation of the annual solar and wind potential, respectively for the monthly average solar irradiation and the average monthly wind speed. These monthly data were grouped into seasons (high season and low season) using the monthly average curve Figure 10(a) and Figure 10(b) to analyze the variations between seasons. Values above average represent the high season while data below this curve represent the low season.
4. Results and Comments
4.1. Result of Cointegration and Causality
4.1.1. Unit Root Tests (Augmented Dickey-Fuller and Phillip Perron Tests)
[image:23.595.151.541.284.694.2]The test results of Dickey-Fuller Augmented and Phillip Perron executed under
DOI: 10.4236/jpee.2019.79002 34 Journal of Power and Energy Engineering
Eviews 7.2 [44] show that all series are integrated of order 1 with the exception
of LPO and LA which are already stationary. The results of these tests are listed in Table 5.
4.1.2.Cointegration
In this work, we have used the Johansen cointegration test to determine the number of long-term equilibrium relationships between integrated variables, whatever the normalization used. The trace and maximum eigenvalue tests in
Table 6 indicate that there is a cointegrating relationship between GDP per ca-pita (GDPH) and electricity consumption, two cointegration relationships be-tween LCE and the population (LPO), and a cointegration relationship bebe-tween LCE and the number of subscribers (LS). This is because the tests performed on the trace and the maximum eigenvalue (λmax) have a value of the statistic strictly greater than the critical values at the 5% threshold. For the other variables, coin-tegration is rejected since we accept the null hypothesis of the existence of any cointegration relationship. The existence of cointegration relationships between electricity consumption and socio-economic indicators (LGDPH, LPO and LS) indicates that there is a long-term relationship between socio-economic growth and electricity consumption. Consumption growth could, therefore, follow so-cio-economic growth.
4.1.3. Causality Test
[image:24.595.56.546.434.708.2]The absence of cointegration between two variables is not an indication of the
Table 5. Variables stationarity test results [45].
Variables Differentiation of order 0 Differentiation of order 1 Differentiation of order 2 Result p-value PP. test p-value ADF. test p-value PP. test p-value ADF. test p-value PP. test p-value ADF. test
GDPH 0.7657 0.7147 0.0079 0.006 * * d = 1
GDPG 0.9865 0.9933 0.0079 0.0079 * * d = 1
GDPT 0.9998 0.9999 0.0082 0.0084 * * d = 1
PO 1.0000 1.0000 0.0000 0.0000 * * d = 1
H 1.0000 0.8368 0.0008 1.0000 0.0001 0.9999 d = 1 S 0.9997 0.9998 0.0472 0.7145 0.0000 0.0000 d = 1 CE 0.9999 1.0000 0.0529 0.0437 0.0000 0.0000 d = 1
LGDPH 0.6305 0.5674 0.0070 0.0061 * * d = 1
LGDPG 0.7450 0.7245 0.0168 0.0168 * * d = 1
LGDPT 0.8879 0.8947 0.0036 0.0027 * * d = 1
LPO 0.0017 0.0000 * * * * d = 0
LH 1.0000 0.9979 0.0000 0.9688 0.0000 0.9999 d = 1
LS 0.0002 0.0000 * * * * d = 0
LCE 0.3529 0.5823 0.0153 0.0154 * * d = 1
DOI: 10.4236/jpee.2019.79002 35 Journal of Power and Energy Engineering Table 6. Johansen test result.
Variable Hypotheses Trace test Max eigenvalue test (λmax) Result H0 H1 Trace test Critical value at 5% Max eigenvalue test Critical value at 5%
LCE and LGDPG r = 0 r = 1 12.3576 15.4947 14.2646 0 cointégration r1 r = 2 1.2035 3.8414 1.2035 3.8414 0 cointégration LCE and LGDPH r = 0 r = 1 15.7341 15.4947 13.4692 14.2646 1 cointégration r1 r = 2 2.2648 3.8414 2.2648 3.8414 0 cointégration LCE and LGDPT r = 0 r = 1 10.6649 15.4947 9.9163 14.2646 0 cointégration r1 r = 2 0.7485 3.8414 0.7485 3.8414 0 cointégration LCE and LPO r = 0 r = 1 29.3948 15.4947 23.3952 14.2646 2 cointégration r1 r = 2 5.9995 3.8414 5.9995 3.8414 2 cointégration LCE and LH r = 0 r = 1 12.9084 15.4947 10.4744 14.2646 0 cointégration r1 r = 2 2.4339 3.8414 2.4339 3.8414 0 cointégration LCE and LS r = 0 r = 1 26.6844 15.4947 25.3330 14.2646 1 cointégration r1 r = 2 1.3513 3.8414 1.3513 3.8414 0 cointégration (_) significatif.
absence of Granger causality between these two variables. It will then test the latter on the different variables.
1) Long term relationship
We accept the null hypothesis (non-causality) as soon as the probability is greater than 5%. An analysis of the results of the Granger causality tests pre-sented in Table 7 reveals that there is a one-way causality relationship from ma-croeconomic indicators to electricity consumption. That is, from LGDPG to LCE, from LGDPH to LCE, and from LGDPT to LCE because the probability is less than 5% (0.0013, 0.0044 and 0.0044 respectively). The results of these tests also re-veal that there is only one unidirectional relationship between LCE and demo-graphic indicators, i.e. the relationship of LCE to LS (number of subscribers).
2) Short term relationship
We accept the null hypothesis (non-causality) as soon as the probability is greater than 5%.
An analysis of the results of the Granger causality tests presented in Table 8
reveals that there is a one-way causality relationship from DLGDPG to DLCE and another one from DLGDPH to DLCE because the probability is less than 5% (0.0358 and 0.0311 respectively). The results of these tests also reveal that there is no cause-and-effect relationship between DLCE and the other variables, since the probabilities associated with them are higher than the critical threshold of 5% considered. We can then conclude that the indicators that have a better influence on electricity consumption are respectively the overall GDP for the macroeco-nomic indicators and the population for the socio-demographic indicators.
DOI: 10.4236/jpee.2019.79002 36 Journal of Power and Energy Engineering Table 7. Result of Granger causality tests for the long-term relationship
Null hypotheses of causality in the sense of Granger F-Statistics Probability LGDPG does not cause LCE 8.4123 0.0013 LCE does not cause LGDPG 0.1550 0.8570 LGDPH does not cause LCE 6.5390 0.0044 LCE does not cause LGDPH 0.5059 0.6080 LGDPT does not cause LCE 6.5845 0.0044 LCE does not cause LPIBT 0.5311 0.5935 LPO does not cause LCE 1.6311 0.2126 LCE does not cause LPO 0.2256 0.7994 LH does not cause LCE 2.6235 0.0891 LCE does not cause LH 0.6832 0.5127 LS does not cause LCE 0.0022 0.9977 LCE does not cause LS 6.4619 0.0046 (_) significatif.
Table 8. Result of Granger causality tests for the short-term relationship.
Null hypotheses of causality in the sense of Granger F-Statistics Probability DLGDPG does not cause DLCE 3.7421 0.0358 DLCE does not cause DLGDPG 0.1466 0.8642 DLGDPH does not cause DLCE 3.9192 0.0311 DLCE does not cause DLGDPH 0.0711 0.9315 DLGDPT does not cause DLCE 1.19726 0.3165 DLCE does not cause DLGDPT 0.3761 0.6898 LPO does not cause DLCE 0.2639 0.7698 DLCE does not cause LPO 2.0008 0.1534 DLH does not cause DLCE 0.1698 0.8446 DLCE does not cause DLH 0.3339 0.7187 DLS does not cause DLCE 0.2555 0.7762 DLCE does not cause DLS 1.5572 0.2278 (_) significatif.
[image:26.595.208.540.356.579.2]in-DOI: 10.4236/jpee.2019.79002 37 Journal of Power and Energy Engineering
crease in production, therefore, leads to a greater income distribution and con-sequently an increase in consumption. Since electricity is a necessity, it will be consumed according to income. These analyzes, therefore, call for reflection on the implementation of an economic policy and energy efficiency in Cameroon.
4.2. Potential in Renewable Energies in Cameroon
4.2.1. Solar and Wind Potential in Cameroon
The grouping of months with an above-average value forms the peak season. These are November to May for average solar irradiation, and January to May for average wind speed (Figure 11andFigure 12(a)andFigure 12(b)). Group-ing months with below average value forms the low season. These are from June to October for average solar irradiation, and from June to December for average wind speed (Figure 11 and Figure 12(a) and Figure 12(b)). The average of these different months gives us a raster that characterizes this low season (Figure 13(a)andFigure 13(b)).
The seasonality is well-observed, because the months constituting the high and low seasons for the solar and the wind follow each other and there is no sudden break between two consecutive months. We note that the months of July and August are the months with the smallest solar irradiations. Meanwhile, the
DOI: 10.4236/jpee.2019.79002 38 Journal of Power and Energy Engineering
[image:28.595.57.542.57.405.2](b)
Figure 11. Spatio_seasonal variabilities of average solar irradiation (A high season and B low season) [46] [47].
month of October has the lowest wind speed. This could lead us to think that an association of a solar-solar hybrid system would make it possible to optimize the site of electricity production. Spatially speaking, we can also notice that areas with high solar and wind potential are grouped together in the same area (the Far North). This part of the country is also the one with the lowest electrification rate (11.5%). This would already guide us to future sites if we want to combine need and potential.
The average of the high and low seasons allows us to have the solar and wind potential in the entire country. This is illustrated in Figure 10, which also shows the difference between the high and low seasons in order to spatially visualize the observed seasonal variability.
At the end of this analysis, we notice that the average solar irradiation mini-mum is 9805 kJ/m2/day and the maximum is 21,889 kJ/m2/day. This minimum
value is already a good potential for solar. In addition, we notice that the average maximum wind speed at 50 m from the ground is 3 m/s. This value shows that the country has low wind potential. The area with average wind power potential is the Far North of the country. The Far North Zone (Adamawa, North and Ex-treme North) is the area with the highest solar potential. The graphs of Figure 2,
DOI: 10.4236/jpee.2019.79002 39 Journal of Power and Energy Engineering
(a)
[image:29.595.95.541.62.708.2](b)
DOI: 10.4236/jpee.2019.79002 40 Journal of Power and Energy Engineering
DOI: 10.4236/jpee.2019.79002 41 Journal of Power and Energy Engineering
[image:31.595.163.540.61.617.2](b)
Figure 13. Spatio_temporal potential of solar and wind power in Cameroon [46] [47].
4.2.2. Biomass Potential
DOI: 10.4236/jpee.2019.79002 42 Journal of Power and Energy Engineering
[image:32.595.120.541.109.719.2]this area. We also note that this area is a rural area and the population is very dispersed.
DOI: 10.4236/jpee.2019.79002 43 Journal of Power and Energy Engineering
NB: We remind all the same that the forest is only part of the biomass. We have not been able to quantify in Cameroon other biomass sources. Which justi-fies the absence of these sources in this study.
4.3. Type of Mini-Networks Selected for Electrification in
Cameroon
Despite Cameroon’s high hydropower potential, we have not retained it as a mini-grid for electrification in Cameroon, as the waterways are unevenly distri-buted and the installation of micro-hydroelectric power plants would be very expensive and maintenance of this one more tedious than the other types of plants with selected RES. However, hydropower plants will instead be offered for increased electricity generation on the interconnected South and North grid.
After determining the solar and wind potential in Cameroon, as well as the distribution of biomass, we can propose the type of renewable energy plant that can replace thermal power plants according to the RE potential of each zone. We already notice that the whole country enjoys a good solar potential over the whole of its territory.
The wind and biomass potential are not evenly distributed. We have average potential in the Far North of the country in wind and a high biomass potential in the far south of the country. Since biomass is a renewable and storable energy, we can exchange our thermal power stations (connected to the grid) by biomass plants. It must be remembered that these backup plants are mainly used at peak hours and spontaneously. Biomass plants respond very well to this type of use. The power stations being located in urban areas, the biomass used could be from the collection of household and industrial wastes. These wastes will be used to produce the biogas by methanisation and it will feed the plant.
DOI: 10.4236/jpee.2019.79002 44 Journal of Power and Energy Engineering
wastes or wood. An in-depth study of the area will allow us to know what kind of biomass will be optimal for the area. The regions of Adamawa and Northern Cameroon are areas where cattle are reared. The horse bursaries can be recov-ered for the production of biogas by methanation to supply the thermal power plants of these regions. In urban areas like Douala and Yaoundé, the high popu-lation density in these cities also leads to a high production of household wastes. These household wastes can be recovered and converted into fuel to supply thermal power plants in these cities.
In the Far north of the country, thanks to the good solar and wind potential in this region, using a hybrid wind-solar will be the most appropriate. In Came-roon, only 24% of the rural population is electrified, the establishment of mini-networks based on renewable energy will be an effective and sustainable solution for the electrification of isolated areas. Several EnR sizing software, like PVgis or HOMER, will allow us, after studying the area, to perform an optimal sizing of the different power plants both at the configuration level and at the cost and return-on-investment level.
4.4.
Gain of CO
2Emission
The calculation of CO2 emission is done considering that all thermal power
plants operate with fuel oil. The CO2 emission ratio of biomass plants is zero
be-cause the amount of CO2 emitted corresponds to the amount of CO2 absorbed by
the plants during their growth. Moreover, we have seen that to reduce the in-vestment cost, we will use solar energy on the day is 12 hours and the biomass at night, thus 12 hours. For the calculation of the energy emitted by the biomass solar hybrid power plant in isolated areas, half of the period of use will be used. Overall, Table 9 shows that a CO2 emission gain of 265,844 Kg could be achieved
[image:34.595.56.539.529.733.2]by exchanging thermal power plants connected to the grid with biomass plants. A CO2 emission gain of 71,094 kg will also be observed if we exchange our isolated Table 9. CO2 emissions from thermal power plants and CO2 emission savings with renewable energy plants (in Kg CO2 eq/MWh).
Thermal power plants Duration
of use of the peak in hours/year Duration of use of the peak in hours/year Output energy MWh
CO2 emission of the
thermal power station in Kg CO2 eq/MWh
CO2 emission of the
renewable energy plant in KgCO2eq/MWh
Gain of CO2
emission in Kg CO2 eq/MWh
Thermal connected to the RIS network 2582 298365 265844 0 265844
Thermal connected to the RIN network 0 0 0 0 0
Total Thermal connected to the
network (RIN + RIS) 2582 298365 265844 0 265844 Total Thermal Isolated RIS 3700 9999 8910 500 8410
Total Thermal Insulated RIE 4392 49494 44100 2475 41625 Total Thermal Insulated RIN 4688 25042 22313 1253 21060 Total Thermal Insulated (RIN + RIS +
DOI: 10.4236/jpee.2019.79002 45 Journal of Power and Energy Engineering
thermal power plants for the benefit of biomass solar hybrid power plants. This makes a total CO2 emission gain of 336,938 Kg.
5. Comments
The continuation of current electricity consumption trends in Cameroon will lead to a situation of growing imbalance between supply and demand, which could only be partially offset by projected investment in new generation capac-ity, provided that, these can be however achieved in a timely manner and the corresponding substantial financial resources can be mobilized. The imple-mentation of a vigorous energy efficiency policy in the electrical field would reduce the pressure on demand in the short term, which proves to be abso-lutely necessary. Energy efficiency can be defined as a catalog of good practices dedicated to save energy. It is the matter of consuming useful that is to arrive at the satisfaction of the energy need using the least energy with the least possible loss. Beyond the expected impact in terms of staggering the invest-ments to be made to endow the country with additional power generation ca-pabilities, the design and development of such an energy efficiency policy must, however, be seen as a foundation for any subsequent energy policy so as to limit the perpetual flight into new production tools which, even when based on the use of alternative energies to fossil fuels, do not require less heavy in-vestments and significant funding. The durability of the energy efficiency pol-icy to be put in place must, therefore, be a basic criterion when it is developed conceptually. This will be the level of the electrical system to reduce internal technical losses; at the household level, replacing incandescent lamps with in-expensive lamps is already a valuable step. But the biggest pole of waste is probably the public buildings, where state officials forget to turn off lamps and air conditioners when leaving the office. In addition, energy efficiency is now an important area of intervention for companies in charge of electricity. They use energy planning methods, including consideration of load curve manage-ment, promotion of efficient building components, and the use of standardiza-tion or labeling of household appliances that would allow to introduce tech-nologies more adapted to the management constraints of the sector. In recent years, this policy has found new justifications in the fight against global warming through efforts to reduce greenhouse gas emissions in the power generation industry.
![Figure 1. Evolution of the Cameroonian rural and urban population and rate of access to electricity (Source: World Bank, 2018) [1]](https://thumb-us.123doks.com/thumbv2/123dok_us/8982681.394341/6.595.211.541.330.695/figure-evolution-cameroonian-population-access-electricity-source-world.webp)
![Figure 2. Evolution of the GDP per person employed in Cameroon (Source: World Bank, 2018) [1]](https://thumb-us.123doks.com/thumbv2/123dok_us/8982681.394341/7.595.103.539.70.275/figure-evolution-person-employed-cameroon-source-world-bank.webp)
![Figure 3. Energy map of Cameroon (Source: Worldpop 2010, OSM 2018, World Bank 2018, GADM 2018) [1] [3] [4] [5]](https://thumb-us.123doks.com/thumbv2/123dok_us/8982681.394341/8.595.152.541.139.691/figure-energy-cameroon-source-worldpop-world-bank-gadm.webp)
![Figure 4. Proportion of sources of energy production in Cameroon (Source: World Bank 2018) [1]](https://thumb-us.123doks.com/thumbv2/123dok_us/8982681.394341/9.595.138.540.331.509/figure-proportion-sources-energy-production-cameroon-source-world.webp)
![Figure 6. Electric power consumption and CO2018)2 emission per capita of Cameroon (Source: World bank, [1]](https://thumb-us.123doks.com/thumbv2/123dok_us/8982681.394341/10.595.141.545.71.246/figure-electric-consumption-emission-capita-cameroon-source-world.webp)