A Model-based Clinical
Biomarker for Sepsis
Diagnosis in Critical Care
Patients
Jacquelyn Dawn Parente
A thesis presented for the degree of
Doctor of Philosophy
in
Mechanical Engineering
at the
University of Canterbury,
Christchurch, New Zealand.
Acknowledgements
I would like to thank all those who have supported me and helped to make this thesis possible.
First of all, to my supervisory team, Distinguished Professor Geoff Chase, Associate Professor Alex James, and Dr. Geoff Shaw, for their continued support and mentoring.
To my work colleagues, Dr. Dominic Lee and Dr. Jessica Lin, for their statistical help and initial project supervision.
To Dr. Paul Docherty, Dr. Chris Pretty, Dr. Yeong Shiong Chiew, and Professor Knut M¨oller, for their guidance.
To the Department of Mechanical Engineering, for awarding me with the Premier International Scholarship. As well as to Dean Lucy Johnston and the Postgraduate Office, for their understanding and patience.
A very special thank you goes to Dr. Boris Baeumer and Professor Richard Barker, for providing me with a second home and fabulous community at the University of Otago Department of Mathematics and Statistics.
To Professor John Harraway, Lenette Grant, Irene David, and the University of Otago Disability Information and Support, for giving me the opportunity to tutor and support my fellow students. And to Megan Turnbull for teaching me how to continue to grow and learn.
Contents
Abstract xvii
1 Introduction 1
1.1 Epidemiology . . . 1
1.2 Sepsis . . . 2
1.3 Prevention . . . 3
1.4 Classification . . . 4
1.5 Diagnostics . . . 5
1.6 Treatment . . . 7
1.7 Summary . . . 9
2 Background 11 2.1 Sepsis diagnostics . . . 11
2.2 Related work . . . 12
2.3 Remaining challenges . . . 13
2.4 Previous work . . . 15
2.4.1 Glucose-insulin system model . . . 15
2.4.2 Model-based insulin sensitivity (SI) and sepsis . . . 17
2.4.3 Analysis of Blakemore et al. [2008] . . . 18
2.4.4 Analysis of Lin et al. [2011a] . . . 19
2.5 Summary . . . 21
2.6 Preface . . . 22
3 Kernel density estimates 23 3.1 Introduction . . . 23
3.1.1 Clinical issues . . . 23
3.1.2 Kernel density estimation . . . 24
3.1.3 Prior work . . . 25
3.1.4 Related work . . . 25
3.2 Methods . . . 26
3.2.1 Principle design . . . 26
vi CONTENTS
3.2.3 Technical exposition . . . 29
3.2.4 Kernel density estimates . . . 29
3.2.4.1 Classification . . . 29
3.2.4.2 Kernel density estimation . . . 30
3.2.4.3 Practical considerations . . . 31
3.2.4.4 Product kernel . . . 31
3.2.5 Resubstitution estimate . . . 32
3.2.6 Bootstrap estimate . . . 32
3.2.7 The .632 bootstrap estimate . . . 32
3.3 Results . . . 33
3.3.1 Kernel density estimates . . . 33
3.3.2 Resubstitution estimate . . . 33
3.3.3 Bootstrap estimate . . . 35
3.3.4 The .632 bootstrap estimate . . . 38
3.4 Discussion . . . 39
3.4.1 Performance assessment . . . 39
3.4.2 Methodology . . . 42
3.4.3 Clinical significance . . . 43
3.5 Summary . . . 43
4 Misclassification Bias 45 4.1 Introduction . . . 45
4.1.1 Clinical issues . . . 45
4.1.2 Misclassification bias . . . 46
4.1.3 Prior work . . . 46
4.2 Methods . . . 47
4.2.1 Principle design . . . 47
4.2.2 Performance assessment . . . 50
4.2.3 Technical exposition . . . 51
4.3 Results . . . 52
4.3.1 Kernel density estimates . . . 52
4.3.2 Resubstitution estimate . . . 52
4.3.3 Bootstrap estimate . . . 54
4.3.4 The .632 bootstrap estimate . . . 56
4.4 Discussion . . . 58
4.4.1 Performance assessment . . . 58
4.4.2 Methodology . . . 59
4.4.3 Clinical significance . . . 60
4.4.4 Limitations and Next Steps . . . 61
CONTENTS vii
5 Hidden Markov Model 63
5.1 Introduction . . . 63
5.1.1 Clinical issues and prior work . . . 63
5.1.2 Hidden Markov model . . . 64
5.1.3 Related work . . . 64
5.2 Methods . . . 65
5.2.1 Principle design . . . 65
5.2.2 Performance assessment . . . 66
5.2.3 Technical exposition . . . 67
5.2.4 Hidden Markov model . . . 67
5.2.5 Estimating the hidden states . . . 69
5.2.6 Repeated holdout estimate . . . 70
5.3 Results . . . 71
5.3.1 Hidden Markov model . . . 71
5.3.2 Resubstitution estimate . . . 71
5.3.3 Repeated holdout estimate . . . 74
5.4 Discussion . . . 75
5.4.1 Performance assessment . . . 75
5.4.2 Methodology . . . 76
5.4.3 Clinical significance . . . 77
5.4.4 Limitations and next steps . . . 78
5.5 Summary . . . 79
6 Conclusions 81 7 Future works 87 7.1 Design considerations . . . 87
7.2 Methods considerations . . . 88
7.3 Model considerations . . . 90
List of Figures
3.1 Box and whisker plots of filtered predictor data by sepsis level. . . 28
3.2 Kernel density estimation resubstitution estimates results. . . 34
3.3 Kernel density estimation bootstrap estimates results. . . 36
3.4 Kernel density estimation .632 bootstrap estimates results. . . 38
4.1 Sepsis scores by ACCP/SCCM and independent criteria. . . 49
4.2 Patient data by independent sepsis score. . . 50
4.3 Independent criteria resubstitution estimates results. . . 53
4.4 Independent criteria bootstrap estimates results. . . 55
4.5 Independent criteria .632 bootstrap estimates results. . . 57
5.1 Hidden Markov model resubstitution estimates results. . . 72
List of Tables
1.1 Sepsis epidemiology . . . 1
1.2 Sepsis diagnostic criteria . . . 5
1.3 Severe sepsis diagnostic criteria . . . 6
3.1 Hourly patient population sepsis categorisations . . . 27
3.2 Contingency table for resubstitution estimates . . . 33
3.3 Resubstitution estimate LHR regions and MLRs . . . 35
3.4 Contingency table for bootstrap estimates . . . 36
3.5 Bootstrap esimate LHR regions and MLRs . . . 37
3.6 Contingency table for .632 bootstrap estimates . . . 38
3.7 .632 bootstrap estimate LHR regions . . . 39
4.1 Independent sepsis categorisation . . . 48
4.2 Patient hourly independent sepsis categorisation . . . 48
4.3 Contingency table for resubstitution estimates . . . 52
xii LIST OF TABLES
4.5 Contingency table for bootstrap estimates . . . 54
4.6 Bootstrap estimate LHR regions and MLRs . . . 56
4.7 Contingency table for .632 bootstrap estimate . . . 56
4.8 .632 bootstrap estimate of LHR regions . . . 57
5.1 Hidden Markov model . . . 68
5.2 Hidden Markov model with two hidden states . . . 68
5.3 Probability of hourly switching amongst cases and controls. . . 71
5.4 Contingency table for resubstitution estimates . . . 71
5.5 Table of LHR regions and MLRs for the resubstitution estimate. . 73
5.6 Contingency table for the repeated holdout estimate . . . 74
[image:12.595.93.483.95.478.2]Nomenclature
Acronyms and abbreviations
ACCP/SCCM American College of Chest Physicians and Society of Critical Care Medicine
AUC Area Under the ROC Curve CRP C-reactive protein
DOR Diagnostic odds ratio HMM Hidden Markov model
ICU Intensive Care Unit IV Intravenous fluids
KDE Kernel density estimates LHR Likelihood ratio
LHR+ Likelihood ratio positive test LHR- Likelihood ratio negative test
MLR Multilevel likelihood ratio
MODS Multiple Organ Dysfunction Syndrome NPV Negative predictive value
PCT Procalcitonin
PPV Positive predictive value
ROC Receiver operating characteristic
SIRS Systemic Inflammatory Response Syndrome SOFA Sequential Organ Failure Assessment
xiv NOMENCLATURE
Mathematical variables for glucose-insulin model
αG Saturation parameter
αI Saturation parameter
BG Absolute blood glucose
CNS Central nervous system glucose uptake
D Rate of glucose
d1 Transport rates between compartments
d2 Transport rates between compartments
EGPb Constant basal endogenous glucose production k1 Base rate of endogenous glucose production
k2 Constants for exponential suppression
k3 Constants for exponential suppression
I Plasma insulin
nC Insulin clearance rate
nI Insulin clearance rate
nK Insulin clearance rate
nL Insulin clearance rate
P Exogenous glucose appearance
Pmax Maximum rate of glucose
P1 Gastric absorption of glucose in the stomach
P2 Gastric absorption of glucose in the gut
P N Parenteral dextrose
pG Suppression of EGPb
Q Effect of previously infused insulin
SI Patient-specific model-based insulin sensitivity
uen Endogenous insulin secretion
uex Intravenous insulin administration
VG Volumes
VI Volumes
NOMENCLATURE xv
Mathematical variables for classification models
ˆ
fS kernel density estimator for cases ˆ
fN kernel density estimator for controls ˆ
fS(x∗
0) joint probability density for cases
ˆ
fN(x∗
0) joint probability density for controls
HS Bandwidth matrix
MS total number of case hours ˆ
P r(S|x∗
0) posterior probability of being a case, given the
data values at that hour
P(St|Xt) Probability of sepsis given patient data to now P(Xt|St) Kernel estimators
φ d-variate normal density ˆ
πS prior probability of cases ˆ
πN prior probability of controls
St Vector of per patient sepsis categorisation until
now
SI Patient-specific model-based insulin sensitivity
Q(i, j) State transition matrix
X Set of observed states
Xt Vector of per patient data observed until now
x1, ..., xT Time series observations
x∗
0 Values of the clinical predictors at the given
patient hour
Y Set of hidden (unobserved) states
Abstract
Sepsis, severe sepsis, and septic shock are stages of a medical emergency char-acterised by an intensifying whole-body immune response to infection leading to organ dysfunction, shock, and ultimately death. Importantly, these stages do not represent an intensifying infection, but rather the body’s intensifying immune re-sponse to infection. Yet, despite advances in modern critical care medicine, sepsis remains common, increasingly costly, and often deadly.
Time to initiation of effective antimicrobial therapy following sepsis-induced hypotension (i.e. septic shock) is the single strongest predictor of outcome over any form of treatment. Furthermore, early treatment reduces sepsis mortality. Importantly, a challenge in the early identification of sepsis is that infection is not always clinically evident. Gold standard blood culture microbiological results return only in retrospect with significant delay. Additionally, there are no bio-chemical and immunological biomarkers with sufficient performance for routine use in critical care. Finally, protocolised categorisation using the ACCP/SCCM sepsis definitions in real-time is erratic and often reflects misclassification, het-erogeneous categorisation, and exclusion. Thus, there remains a serious need for early, accurate, time-dependent, patient specific diagnostics for sepsis available at the bedside in real-time for clinical decision support.
Mathematical models of physiology developed from clinical data can identify patient-specific parameters, in particular, model-based insulin sensitivity (SI), which is related to patient condition and sepsis state. A multivariate biomarker has been shown to link model-based SI and clinical measures to septic shock. This thesis further develops a model-based sepsis diagnostic for severe sepsis from model-based SI, temperature, heart rate, respiratory rate, blood pressure,
xviii ABSTRACT
definitions were used to categorise hourly sepsis state, resulting in 213 hours of severe sepsis and septic shock cases and 5858 hours of SIRS and sepsis controls.
Kernel density estimates (KDE) using the Bayes classifier were used to esti-mate class conditional joint probability density profiles of the clinical predictors and for classification. The unknown patient hour to be classified was tested against these established datasets, with the result being a classification into ei-ther the case or control group. The classifier performed with the greatest sta-bility and accuracy when using the product kernel, 0.5 prior probabilities, and Cholesky transformation. Optimal diagnostic performance from the receiver op-erating characteristic (ROC) curve was determined as 0.78 (0.69–0.94) sensitiv-ity, 0.83 (0.76–0.94) specificsensitiv-ity, 0.87 (0.78–0.99) AUC, 0.10–0.36 PPV, 0.99–1.00 NPV, 4.48 (2.88–15.70) LHR+, 0.27 (0.06–0.41) LHR-, and 16.83 (7.04–262) DOR at an optimal posterior probability cutoff value of 0.31. Thus, kernel implemen-tation of the Bayes classifier given bedside clinical measurements can provide a useful posterior probability for clinical decision making in real-time.
An independent classifier was developed whereby the ACCP/SCCM classi-fication criteria were independently evaluated and summed, providing a 25.8% disease prevalence (1690 of 6550 hours). Similarly, the KDE estimation and clas-sification method was used, resulting in optimal diagnostic performance of 0.86 (0.81–0.94) sensitivity, 0.85 (0.79–0.95) specificity, 0.92 (0.88–0.99) AUC, 6 (4–18) LHR+, 0.17 (0.06–0.24) LHR-, 0.57–0.86) PPV, 0.92–0.98) NPV, and 34 (16–300) DOR at an optimal posterior probability cutoff value of 0.49. The diagnostic re-sults show high accuracy as a potential severe sepsis diagnostic and monitoring response to sepsis interventions in real-time. Thus, relaxation of the hierarchical and concurrent criteria in the ACCP/SCCM definitions captured the more staged and clinically observed evolution of sepsis over time, including plateaus of septic shock treatment during administration of IV fluid resuscitation. Therefore, it is an improved, objective metric especially for real-time diagnosis and monitoring of response to disease and treatment.
ABSTRACT xix
conditioned on each hidden state. Thus, the labelled data can be used to es-timate the transition probabilities of the hidden sepsis states. The conditional distributions, P (observation—sepsis state), were found using the joint proba-bility densities using kernel density estimates. Finally, the hidden states were estimated by determining the most probable path of the joint probability of the observed sequence and the hidden sequence. Upon determining the posterior probability of a patient sepsis state, the patient hour is compared against the established dataset and diagnostic performance from the ROC curve was deter-mined for resubstitution, repeated holdout estimate, and leave one out estimate. The HMM performed with 0.59–0.95 sensitivity, 0.61–0.96 specificity, 1.54–23.96 LHR+, 0.05–0.66 LHR-, 0.63–0.99 AUC, and 2–474 DOR. The state transition probabilities were shown to be independent of sepsis categorisation definitions. Furthermore, the observed clinical signs are linked to hidden sepsis state, yet are most accurate when the model is trained on the patient data. Thus, the HMM has the most potential as a real-time, patient-specific model to reduce the variability of diagnosis due to inter- and intra-patient variability.
Chapter 1
Introduction
1.1
Epidemiology
Sepsis is a common, deadly, and costly medical emergency requiring early hospi-talisation and treatment intervention. Sepsis is becoming increasingly common as a principle diagnosis for hospitalisation with increasing incidence afflicting an ageing population [Lagu et al., 2012; Martin, 2012]. Sepsis patients are more severely ill than patients hospitalised for another diagnosis, stay longer in hospi-tal than other inpatients, and are more expensive to treat than other patients. Sepsis patients are also more likely to die than other patients. As a primary diag-nosis, sepsis accounted for 2% of hospitalisations in the US in 2008, yet made up 17% of in-hospital deaths [Hall et al., 2011]. New Zealand and Australian sepsis mortality was 18.4% in 2012 [Kaukonen et al., 2014]. Table 1.1 summarises and puts specific values to these epidemiological statistics.
Table 1.1: Sepsis epidemiology from Hall et al. [2011]. These statistics are for hospi-talisations of sepsis as a primary diagnosis in the US in 2008. Where applicable, the figures provided are distinguished by age groups (a: 65+ years old and b: 65- years old) or in comparison to hospitalisations for other diagnoses.
Incidence: 24.0 incidence per 10,000 in 2008 (11.6 per 10,000 in 2000)
ICU prevalence: 20% prevalence in the medical ICU [Alberti et al., 2002]
Age: 2/3 of sepsis patients are aged 65+ (122.2a and 9.5b per 10,000)
Comorbidity: 26%a and 200%b as likely to have seven or more diagnoses
Length of stay: 75% longer (43%a and 200%b longer LOS)
Mortality: eight times as likely (20%a and 13%b mortality)
2 CHAPTER 1 INTRODUCTION
1.2
Sepsis
A local infection activates the body’s natural defence mechanism, the inflam-matory response. The cardinal signs of the immune response are: calor (heat),
rhubor (redness),tumor (swelling), anddolor (pain). These symptoms are due to changes in the local blood vessels that expand, to become more permeable, due to increased blood supply. These changes allow immune cells to penetrate through the vascular walls and enter the tissues to remove the pathogens. In addition, the blood in neighbouring micro-vessels coagulates to keep the invading pathogen isolated from the circulatory system. However, if the immune system is weak-ened or the infection is particularly severe, such a local infection can overcome the body’s natural defence mechanisms and spread throughout the body.
A local infection can be diagnosed as sepsis when these defence mechanisms fail and pathogens enter and travel through the circulatory system. The result is that the ongoing and intensified process of inflammation becomes widespread in the body. Sepsis is thus, in part, a whole-body inflammatory response to infec-tion. Sepsis may subsequently or simultaneously lead to damage to organs and tissues that have not yet been invaded directly by pathogens, leading, unchecked, to subsequent organ failure and possibly death.
Thus, a negative impact of this overwhelming whole-body inflammatory re-sponse to infection causes organ failure. In severe sepsis cases, the function of individual organs starts to deteriorate and may completely fail. Blood clots form around organs and in peripheral vessels, and the reduced blood flow deprives the limbs and internal organs of nutrients, oxygen supply, and the transport of wastes, further deteriorating function. In addition, the heart races, the kidneys no longer produce urine, and the patent’s mental status can become gravely im-paired. The patient’s life is thus in acute danger. Emergency medical treatment, including organ support, antimicrobials, and intravenous fluids are required to restore circulatory function and remains the only hope for survival.
1.3 PREVENTION 3
body in managing the infection and maintaining other organ function. It is thus a cascade of effects.
Overall, sepsis is thus an acute inflammatory response to infection. In more severe cases it includes major organ failure. Each subsequent effect in this cascade of increase in severity of this response significantly increases the risk of death. Broad reviews of sepsis concepts, pathophysiology, and treatment in adults are provided by Angus and Van Der Poll [2013] and in neonates by Shane and Stoll [2013].
1.3
Prevention
The cause of sepsis is always infection. Infection is most commonly caused by bacteria, but also viruses, fungi, or single-celled parasites. If infection cannot be contained by the body’s immune system, infection in the lungs (pneumonia), bladder and kidneys (urinary tract infection), and primary bloodstream infection, abdomen (peritonitis), skin (cellulitis), and other areas (meningitis) can lead to sepsis. It has been reported that the respiratory, digestive, urinary tracts, and primary blood-stream infections represented about 80% of all source infection sites [Alberti et al., 2002]. Abdominal infections, bloodstream infections, and fungal infections have been observed to be more likely associated with septic shock [Alberti et al., 2002]. Therefore, sepsis can be best prevented and managed by prevention or effective and early management of infection.
4 CHAPTER 1 INTRODUCTION
1.4
Classification
The American College for Chest Physicians/Society of Critical Care Medicine (ACCP/SCCM) Consensus Conference was held in 1991 with the goal of agree-ing on a set of definitions that could be applied to patients with sepsis and its sequelae. Broad definitions of sepsis and the systemic inflammatory response syndrome were proposed, along with detailed physiologic parameters by which a patient may be categorised. Definitions for the systemic inflammatory response syndrome (SIRS), sepsis, severe sepsis, and septic shock are provided below. These general definitions have been widely used in practice, and have served as the foundation for inclusion criteria for clinical trials and therapeutic interven-tions.
The systemic inflammatory response syndrome (SIRS) is defined as two or more of the following conditions [Bone et al., 1992; Levy et al., 2003]:
• Temperature >38◦ C or <36◦ C
• Heart rate >90 beats per minute
• Respiratory rate >20 breaths per minute or PaCO2 <32 mmHg
• White blood cell count 12,000/cu mm, <4,000/ cu mm, or >10% imma-ture (band) forms
Sepsis is then defined as SIRS due to infection [Bone et al., 1992; Levy et al., 2003]. It thus requires SIRS and evidence of infection.
Severe sepsis is defined as sepsis associated with organ dysfunction, hypop-erfusion, or hypotension [Bone et al., 1992; Levy et al., 2003]. Septic shock is defined as sepsis-induced hypotension, defined as a systolic blood pressure < 90 mmHg or a reduction of ≥40 mmHg from baseline, despite adequate fluid resus-citation, along with the presence of perfusion abnormalities [Bone et al., 1992; Levy et al., 2003]. Table 1.2 shows the detailed physiological parameters used to define sepsis, while Table 1.3 details the clinical signs that define severe sepsis.
1.5 DIAGNOSTICS 5
Table 1.2: Diagnostic criteria for sepsis (from Bone et al. [1992] and Levy et al. [2003]).
Infection. Documented or suspectedand some of the following:
General parameters. Fever (core temperature > 38.3◦ C), Hypothermia (core
tem-perature <36◦ C), Heart rate > 90 beats/min or > 2 SD above the normal value
for age, Tachypnea (> 30 breaths/min), Altered mental status, Significant edema or positive fluid balance (> 20 ml/kg over 24 h), Hyperglycemia (plasma glucose
>110 mg/dl or 7.7 mM/l) in the absence of diabetes
Inflammatory parameters. Leukocytosis (white blood cell count > 12,000/µl), Leukopenia (white blood cell count < 4,000/µl), Normal white blood cell count with > 10% immature forms, Plasma C reactive protein >2 SD above the normal value, Plasma procalcitonin >2 SD above the normal value
Hemodynamic parameters. Arterial hypotension (SBP<90 mmHg, MAP <70, or a SBP decrease > 40 mmHg in adults or < 2 SD below normal for age), Mixed venous oxygen saturation >70%, Cardiac index >3.5 l/min/m2
Organ dysfunction parameters. Arterial hypoxemia (PaO2/FIO2<300), Acute olig-uria (urine output<0.5 ml/kg/h or 45 mM/l for at least 2 h), Creatine incease≥0.5 mg/dl, Coagulation abnormalities (international normalised ratio>1.5 or activated partial thromboplastin time >60 s), Ileus (absent bowel sounds), Thrombocytope-nia (platelet count <100,000/µl), Hyperbilirubinemia (plasma total bilirubin > 4 mg/dl or 70 mmol/l)
Tissue perfusion parameters. Hyperlactatemia (> 3 mmol/l), Decreased capillary refill or mottling
as well as subsequent organ failure. If definable phases exist on a continuum of severity, populations could be characterised for increased risk of mortality and independent prognostic implications along the same scale. Therefore, this standardisation of terminology allows communication amongst researchers and clinicians to compare protocols and evaluate therapeutic interventions.
1.5
Diagnostics
6 CHAPTER 1 INTRODUCTION
Table 1.3: Severe sepsis definition (from Bone et al. [1992] and Levy et al. [2003]).
Severe sepsis definition = sepsis-induced tissue hypoperfusion or organ dysfunction (any of the following thought to be due to the infection):
Sepsis-induced hypotension, Lactate above upper limits laboratory normal, Urine output<0.5 mL/kg/h for more than 2 h despite adequate fluid resuscitation, Acute lung injury with PaO2/FiO2<250 in the absence of pneumonia as infection source, Acute lung injury with PaO2/FiO2 < 200 in the presence of pneumonia as infec-tion source, Creatinine > 2.0 mg/dL (176.8 µmol/L), Bilirubin > 2 mg/dL (34.2
µmol/L), Platelet count<100,000µL, Coagulopathy (international normalised ratio
>1.5)
documentation of the presence of invading pathogens in the blood. However, this evidence is not sufficient for a positive diagnosis of sepsis, as these culture tests can yield both false positive and false negative results. Alternatively, the ACCP/SCCM sepsis definitions use positive blood culture plus clinical signs of infection as a positive gold standard, and negative blood culture without clinical evidence as the negative gold standard. Thus, the ACCP/SCCM sepsis defini-tions instead provide a clinical documentation of sepsis, which aims to charac-terise various stages of the associated inflammatory response and to differenti-ate infectious from non-infectious processes [Bone et al., 1992; Levy et al., 2003]. However, such clinical evidence is subjective and depends on experience.
Importantly, the usefulness of the ACCP/SCCM definitions has been chal-lenged, because it requires microbiological documentation of infections, which is available only in retrospect, and because some patients with definite infec-tion do not fulfil criteria for any of the sepsis categories [Alberti et al., 2002; Brun-Buisson, 2000]. In an epidemiological study, Alberti et al. [2002] found that one-fifth of long-stay, more than 24 hours, patients with infection in the ICU did not fulfil criteria for any sepsis categorisation. Additionally, 80% of the clinically documented infections were classified in sepsis categories, of which one-half had manifestations of either severe sepsis or septic shock [Alberti et al., 2002]. Thus, the ACCP/SCCM classifications categorise ICU patients into het-erogeneous populations, which reflects the fact that sepsis represents a clinical syndrome and not a specific single disease [Alberti et al., 2002].
clin-1.6 TREATMENT 7
ical trials can be deceptive as many cases may be missed or poorly diagnosed. The authors themselves note that clinical trials include highly selective patient populations and thus the global epidemiology of infection encountered in the ICU can hardly be accurately derived from these studies [Alberti et al., 2002]. Additionally, the ACCP/SCCM definitions exclude non-documented infections, thus eliminating nearly onehalf of patients with community acquired infection -a m-ajor problem for ev-alu-ation of new ther-apeutic -agents, tre-atment -appro-aches, and diagnostics [Alberti et al., 2002].
A more useful sepsis biomarker would help identify or rule out sepsis, and should also be able to guide therapy. More than 170 different biomarkers have been assessed for potential use for molecular diagnostics in sepsis, primarily as prognostic markers, while only ten have been used for diagnosis [Pierrakos et al., 2010]. C-reactive protein (CRP) and procalcitonin (PCT) have been most widely used [Wacker et al., 2013; Kibe et al., 2011], but both have limited ability to dif-ferentiate sepsis from other non-infectious causes of SIRS [Giamarellos-Bourboulis et al., 2004]. No biomarker, therefore, has established itself sufficiently to be of great help to clinicians in everyday clinical practice [Pierrakos et al., 2010]. So, the
search still continues for potential sepsis biomarkers [Reinhart et al., 2012; Parlato and Cavaillon 2015], including combinations of potential biomarkers [Gibot et al., 2012].
Thus, the timing for early sepsis diagnosis is delayed because clinical and lab-oratory signs used are not specific enough. In addition, sepsis is under-recognised and poorly understood due to confusion about its definition, lack of documenta-tion of sepsis as a cause of death, inadequate diagnostic tools, and inconsistent application of standardised clinical guidelines to treat sepsis. Thus, there remains a serious need for improved sepsis diagnostics for the improvement of survival in sepsis patients.
1.6
Treatment
8 CHAPTER 1 INTRODUCTION
patients [Alberti et al., 2002], signifying a significant leverage point and need.
Effective treatment in the ICU requires early antibiotic administration and intravenous (IV) fluids after diagnosis. Broad-spectrum antibiotics delivered in-travenously are effective against several common bacteria, while a physician may prescribe a specific type of antibiotic based on the type of infectious organism, when it is known or strongly suspected. IV fluids are administered to prevent hy-potensive shock, support organ function, and reduce damage from sepsis. Future developments in treatments may focus on host immunomodulation [Wiersinga, 2011; Hotchkiss et al., 2013].
Importantly, Kumar et al. [2006] determined that the time to initiation of effective antimicrobial therapy following sepsis-induced hypotension (i.e. septic shock) is the single strongest predictor of outcome over any form of treatment [Kumar et al., 2006]. Antimicrobial administration within the first hour of docu-mented hypotension was associated with a survival rate of 79.9% [Kumar et al., 2006]. Yet, after four hours, the survival rates were as low as 50% [Kumar et al., 2006]. Thus, each hour in delay of treatment was associated with an average de-crease in survival of 7.6% [Kumar et al., 2006]. Given that the observed median time to antimicrobial therapy was 6 hours, the high mortality rates are not too surprising [Kumar et al., 2006]. The current clinical reality is that sepsis is still often overlooked and recognised too late; and there is thus, from these results, a clear need for a rapid and accurate real-time diagnostic.
1.7 SUMMARY 9
1.7
Summary
Chapter 2
Background
2.1
Sepsis diagnostics
Simply put, a diagnostic test for sepsis would be regarded as successful, beyond current practice, if clinicians and researchers consider it as helpful in identifying sepsis. In particular, clinicians require an early and accurate diagnostic available at the bedside to allow early treatment, which is critical for patient survival [Kumar et al., 2006]. Additionally, an established criteria would allow researchers to compare the effectiveness of new and current therapeutics, and to optimise treatments. However, there remains no established gold standard diagnostic test for sepsis.
12 CHAPTER 2 BACKGROUND
2.2
Related work
Although limited, the ACCP/SCCM definitions [Bone et al., 1992; Levy et al., 2003] are the most widely used sepsis criteria. The consensus definitions were based upon clinical bedside experience and introduced as a standardisation of terminology. Generally, the criteria conceptualise the sepsis syndrome as a pro-gressive and injurious inflammatory response to infection leading to organ failure, a life-threatening drop in blood pressure, and ultimately death. Notably, the cri-teria continue to evolve along with a growing understanding of the pathology of sepsis and its sequela.
SIRS is defined as the systemic inflammatory response syndrome, which in-volves host temperature, heart rate, respiratory rate, and white blood cell count [Bone et al., 1992; Levy et al., 2003]. Notably, SIRS is defined by simple clini-cal measurements, rather than biochemiclini-cal or immunologiclini-cal findings. However, SIRS is not specific enough to identify sepsis or to identify a distinct pattern in the host response to infection [Marshall, 2000; Vincent, 1997], as these clinical signs have many alternative causes in the critically ill patient.
Sepsis is formally defined as SIRS due to infection [Bone et al., 1992; Levy et al., 2003]. However, it is important to note that microbiologic confirmation of infec-tion is only available in retrospect, as blood culture test results return in 24–48 hours. In addition, tests yield both false positive and false negative results, where there is a great deal of ‘culture negative’ sepsis that did not grow in vitro. Thus, it remains a challenge to determine if SIRS is due to infection rather than another cause. Therefore, the clinical reality of the ACCP/SCCM criteria is that they can only best describe when a patient ‘looks septic’.
di-2.3 REMAINING CHALLENGES 13
agnostics occurs later in the sepsis syndrome more towards severe sepsis, namely, when a patient requires organ support in the ICU or has a life threatening drop in blood pressure.
The ACCP/SCCM criteria will necessarily expand the list of signs and symp-toms to reflect the clinical experience of sympsymp-toms at the bedside. However, it is notable that in the time of over a decade between Bone et al. [1992] to Levy et al. [2003], there has been no evidence to support any changes in these definitions. This lack of evidence underscores the challenges still present in distinguishing sepsis from other inflammatory processes and identifying the clinical, microbio-logical, immunomicrobio-logical, and biochemical markers useful for diagnosis.
2.3
Remaining challenges
Ultimately, the ACCP/SCCM definitions codify the physical and laboratory find-ings that prompt an experienced clinician to conclude that an infected patient ‘looks septic’. However, in clinical practice, application of the SIRS, sepsis, severe sepsis, and septic shock definitions do not properly categorise and stage patients. In particular, the ACCP/SCCM classifications categorise ICU patients into het-erogeneous populations, which reflects the fact that sepsis represents a clinical syndrome and not a disease [Alberti et al., 2002].
For example, the sepsis definitions can omit patients with infection from clas-sification. An epidemiological study found that one-fifth of patients with infection in the ICU for over 24 hours did not fulfil criteria for any sepsis categorisation [Alberti et al., 2002]. Thus, Alberti et al. [2002] argues that identifying infections overall is important, not just sepsis and sepsis-related conditions, a classification which eliminates about one-fifth of infections.
14 CHAPTER 2 BACKGROUND
Thus, when applied to clinical practice, the sepsis definitions do not con-sistently categorise sepsis patients and, moreover, eliminate potential patients due to the requirement of microbiological confirmation. The sepsis criteria define clinical thresholds of abnormal ranges. However, they do not allow similar predic-tion in sepsis diagnostics, as classificapredic-tion results in heterogeneous populapredic-tions. Thus, the usefulness of the definitions are undermined by the inability to stratify patients by their baseline risk of mortality and by their response to therapy in clinical care.
Alberti et al. [2002] suggested epidemiological studies have a ‘infection ap-proach’ to focus on infection, which would provide a better understanding of the associated conditions, risks, and outcomes of sepsis patients instead of a ‘sepsis approach’. In particular, clinical trials targeting the major sources of infection (85% of reported sites are lung, abdomen, urinary tract, and blood-stream [Alberti et al., 2002]) could reduce the heterogeneity of patients enrolled. Furthermore, an editorial by Nasraway [1999] advocated the reduction of hetero-geneity before initiating further experimental studies since heterohetero-geneity results in a low signal/noise ratio.
It should be noted, however, that both inter- and intra- patient variability in physiological state, response to infection, and response to treatment all impact patient outcome. Similarly, management also contributes to the heterogeneity of sepsis classification and outcomes. In response to the high variability in critical care patients, recent increases in the use of protocolized care aimed to reduce the variability in outcome due to the variability in care. For example, the sep-sis consensus definitions [Bone et al., 1992; Levy et al., 2003] aimed to provide a standardisation of terminology for clinical trial entry criteria. However, the con-sensus definitions do not stratify patients by their baseline risk of mortality and by their potential to respond to therapy. In addition, the Surviving Sepsis Cam-paign management guidelines [Dellinger et al., 2013] provide protocolized care to reduce variability in sepsis care. And yet, the management guidelines have reduced sepsis mortality [Levy et al., 2010], but sepsis mortality remains high.
2.4 PREVIOUS WORK 15
for patient-specific approaches to diagnosis, care, and patient management, which are complementary to and fit within protocolized approaches.
Alternatively, patient-specific management approaches can be used to reduce variability in outcome due to intra- and inter- patient variability in response to therapy. This work will now introduce physiological model-based methods for patient-specific solutions and will demonstrate the potential of these methods to improve sepsis care. Future work in towards these solutions would determine if this offers significant benefit.
2.4
Previous work
2.4.1
Glucose-insulin system model
A computational model of the metabolic glucose-insulin system offers the poten-tial with clinical data to create patient-specific models that capture a patient’s physiological status [Lin et al., 2011b]. This clinically validated model can track patient-specific conditions and provide new means of diagnosis and opportuni-ties for optimising therapy [Hann et al., 2005]. There already exist model-based applications for the diagnosis of sepsis [Blakemore et al., 2008; Lin et al., 2011a].
A glucose insulin system model has been clinically validated in clinical tight glycaemic control studies [Lin et al., 2011b; Fisk et al., 2012]:
˙
BG=−pGBG(t)−SIBG(t) Q(t) 1 +αGQ(t)
+P(t) +EGPb−CNS
VG
(2.1)
˙
Q=nI(I(t)−Q(t))−nC Q(t)
1 +αGQ(t) (2.2)
˙
I =−nKI(t)− nLI(t)
1 +αII(t) −nI(I(t)−Q(t)) +
uex(t)
VI + (1−xL) uen
VI (2.3)
˙
16 CHAPTER 2 BACKGROUND
˙
P2 =−min(d2P2, Pmax) +d1P1 (2.5)
P(t) = min(d2P2, Pmax) +P N(t) (2.6)
uen(t) =k1e−I(t)
k2/k3
(2.7)
where BG(t) is absolute blood glucose, I(t) is plasma insulin, and Q(t) is the effect of previously infused insulin being utilized over time. EGPb is the con-stant basal endogenous glucose production, which is suppressed with increasing glucose concentrations. This suppression, independent of non-insulin mediated glucose uptake by the central nervous system (CNS) is captured by the termpG. In contrast, patient-specific insulin mediated glucose removal is captured with insulin sensitivity, SI, which is identified (hourly) from clinical data as a
time-dependent variable that reflects evolving patient condition [Hann et al., 2005; Lin et al., 2006; Blakemore et al., 2008; Lin et al., 2008; Chase et al., 2008]. Ex-ogenous inputs are glucose appearance, P(t), from the carbohydrate content of nutrition infusions via a two compartment model [Wong et al., 2006a], and in-travenous insulin administration, uex(t). Other parameters are physiologically defined population constants for insulin clearance rates (nI, nC, nK, nL), satu-ration parameters (αG, αI), endogenous insulin secretion (uen), first-pass hepatic removal (xL), or volumes (VG, VI) that have been validated over several studies.
The gastric absorption of glucose is defined for glucose in the stomach and gut (P1,P2), transport rates between compartments (d1, d2), rates of glucose (Pmax,
P, D), and additional parenteral dextrose (P N). Finally, a generic representa-tion of EGP when C-peptide data is unavailable is represented with base rates of endogenous insulin production k1 and constants for exponential suppression (k2,
k3).
carbohy-2.4 PREVIOUS WORK 17
drate administration inputs, from retrospective clinical data for each protocol [Hann et al., 2005, 2008]. The resulting insulin sensitivity profile, SI(t), iden-tifies a unique value every hour and the resulting profile thus varies hourly. This model-based, insulin sensitivity metric and identification method have been validated in glycaemic control protocol clinical trials in adults and neonates [Chase et al., 2005a,b; Wong et al., 2006a,b; Le Compte et al., 2009; Fisk et al., 2012] andSI has also shown good correlation to gold standard euglycemic clamp data [Lotz et al., 2006, 2008]. Previous contributions of this author towards developments of the glucose-insulin model and tight glycaemic control include [Pretty et al., 2008; Razak et al., 2008; Chase et al., 2009a; LeCompte et al., 2009; Chase et al., 2009b; Lin et al., 2010b,a; Chase et al., 2011; Lin et al., 2011b].
2.4.2
Model-based insulin sensitivity (
S
I) and sepsis
In intensive care, patient-specific metabolic model parameters have been used as sepsis biomarkers because they can accurately reflect the inflammatory sta-tus of the patient and severity of illness [Blakemore et al., 2008; Lin et al., 2011a; Lotz et al., 2006; Langouche et al., 2007]. Sepsis has been observed with a reduc-tion in insulin sensitivity [Agwunobi et al., 2000; Chambrier et al., 2000; Rusavy et al., 2005; Chase et al., 2008]. There has also been a reported delay between endo-toxin introduction and onset of decreased insulin sensitivity [Agwunobi et al., 2000; Krogh-Madsen et al., 2004]. Moreover, the impact of drug choices on in-sulin sensitivity [LeCompte et al., 2008] have been studied for glargine [Lin et al., 2009b], corticosteroids [Pretty et al., 2009a], and glucocorticoids [Pretty et al., 2009b, 2011].
18 CHAPTER 2 BACKGROUND
immune support for critically ill patients.
2.4.3
Analysis of Blakemore et al. [2008]
Blakemore et al. [2008] investigated the real-time diagnostic performance of model-based SI to diagnose septic shock. Amongst an ICU study cohort of 30 sep-sis patients, hourly model-based SI was calculated as well as sepsis categorised hourly using the ACCP/SCCM definitions [Bone et al., 1992; Levy et al., 2003], totalling 6,744 hours of sepsis and non-sepsis hours. An ROC curve was con-structed within the sepsis cohort across all sepsis levels, yet primarily reported at the diagnostic level of septic shock, the most severe form. Previously, this work has been presented at the Engineering & Physical Sciences in Medicine and Australian Biomedical Engineering Conference (EPSM ABEC 2008, Christchurch NZ) [Parente et al., 2008].
Diagnostic performance results in Blakemore et al. [2008] were 78% sensitiv-ity, 82% specificsensitiv-ity, 2.8% PPV, and 99.8% NPV at an optimal cutoff value of model-based SI = 8e-5 L/mU/min. The author’s analysis focused on predictive values, concluding that low model-based SI does not make an effective septic shock diagnostic, while high model-based SI rules out sepsis [Blakemore et al., 2008]. However, it is important to note that predictive values alone do not ac-curately reflect a diagnostic test’s performance, as predictive values are depen-dent on disease prevalence overall [Smith et al., 2000] and in the data set used to test the diagnostic. Therefore, further analysis in this thesis will now be con-ducted using likelihood ratios (LHR), which are independent of disease prevalence [Jaeschke et al., 1994a; Dujardin et al., 1994; Pauker and Kassirer, 1980] and are an alternative to evaluating the predictive value of a test result.
Thus, further evaluation of Blakemore et al. [2008] showed that model-based
2.4 PREVIOUS WORK 19
ruling out septic shock, respectively.
However, a similar analysis of the diagnostic performance in terms of LHRs for severe sepsis is low. At this level, all cutoff values rarely alter clinical deci-sions. Yet, importantly, Blakemore et al. [2008] does show there is a real-time diagnostic potential for model-based SI for ruling in and ruling out of septic shock. Given this analysis, it is important to note which performance measures and data reported would be useful for critical analysis. Specifically, a probability density function should be provided of the model-based SI for the sepsis and non-sepsis cohorts. In particular, this data would visualise the relative impact of disease prevalence on the predictive values, as well as the discrimination between cohorts. Result outputs should tabulate ranges of useful cutoff values, rather than merely dichotomous positive/negative test outcomes at an optimal cutoff value. Reporting cutoff value regions would be more helpful for a clinician to infer the impact of a test result at a level of model-based SI output, as opposed to a ‘positive’ or ‘negative’ test result. The area under the ROC curve (AUC) should be provided for comparison to other diagnostic tests.
2.4.4
Analysis of Lin et al. [2011a]
Lin et al. [2011a] conducted a proof-of-concept study to evaluate the relationship of model-basedSI and sepsis, extending the work from Blakemore et al. [2008] by utilising additional clinical measurements. The ICU study population consisted of 36 sepsis patients totalling 9,208 hours of calculated model-basedSI and
20 CHAPTER 2 BACKGROUND
Lin et al. [2011a] reported the performance of model-based SI to diagnose severe sepsis at 50% sensitivity, 76% specificity, 4.8% PPV, and 98.3% NPV, yielding 2.1 LHR+ and 0.66 LHR-, at an optimal cutoff value of model-based
SI = 1.3e-4 L/mU/min. This level of performance rarely alters clinical decisions across all cutoff values. When compared to the similar test in Blakemore et al. [2008], this performance level is very similar.
Alternatively, for septic shock diagnosis, the optimal sensitivity in each study differed greatly, with approximately 53% sensitivity in Lin et al. [2011a] as com-pared to 78% sensitivity reported in Blakemore et al. [2008], while both had sim-ilar specificities of around 85%. One possible source of this discrepancy could be explained by the differences in the physiological models used by Blakemore et al. [2008] [Wong et al., 2006b; Chase et al., 2005a] and Lin et al. [2011a] [Lonergan et al., 2006; Chase et al., 2007; Lin et al., 2006].
The second developed diagnostic test, which used a multivariate biomarker, showed improvement in performance compared to model-based SI alone. Opti-mal severe sepsis diagnosis performed at 73% sensitivity, 80% specificity, 8.4% PPV, and 99.2% NPV, yielding 3.65 LHR+ and 0.33 LHR-. These results are on the border of rarely altering clinical decisions. Lin et al. [2011a] did evaluate diagnostic performance in terms of predictive ability and acknowledged the in-fluence of the low sepsis prevalence on predictive values in this data set, yet still concluded that the multivariate biomarker provides a real-time negative predic-tive diagnostic for severe sepsis. However, it is once again important to evaluate diagnostic performance beyond predictive values, so it should be noted that the majority of cutoff values below and above the optimal level do contribute to suf-ficient LHR+ and LHR- performance that often provide useful information in clinical decision making.
2.5 SUMMARY 21
to the diagnosis of severe sepsis.
Additionally, Lin et al. [2011a] provides a scatter plot (Poincare map) of the observed hourly variation of sepsis categories and the associated multivariate biomarker. This map is an initial look into the hourly transitions of sepsis cate-gories and the multivariate biomarker, which could be extended into examining sepsis time course and the inter- and intra- patient variation in the biomarker to improve performance and add evolution over time to the diagnostic. It would require further examination to evaluate the potential of real-time results to aid in treatment and management of sepsis in the ICU.
2.5
Summary
Current sepsis diagnostics utilise combinations of microbiological, clinical, bio-chemical, and immunological approaches, yet there remains a serious need for a early and accurate sepsis diagnostic. Gold standard blood culture results return only in retrospect and with significant 1–3 day delays. No biomarker studied has performed with sufficient specificity or sensitivity for use in clinical practice. Fi-nally, consensus sepsis definitions provide clinical thresholds of abnormal ranges, but do not allow similar prediction and therefore, result in heterogenous cate-gorisation. Thus, sepsis as a syndrome has proved difficult to diagnose or classify at all, let alone rapidly or in real-time, due to high inter- and intra- patient variability, which has not been addressed through uses of generalised protocol care.
Alternatively, computational models of the glucose-insulin system together with patient data can offer create patient-specific models. In particular, this model has identified model-based insulin sensitivity (SI) as a patient-specific, time-varying, real-time predictor of metabolic status which is related to patient condition. Moreover, use of model-basedSI has been shown to be a potential di-agnostic for septic shock [Blakemore et al., 2008]. Combination of bedside clinical predictors with model-based SI improved diagnostic for severe sepsis [Lin et al.,
22 CHAPTER 2 BACKGROUND
2.6
Preface
There remains a serious need for an early, accurate, patient-specific diagnostic test for severe sepsis to initiate life-saving treatment for the reduction of mor-tality and improvement of patient treatment in critical care. In particular, a statistical model of a biomarker may be more useful than generalised consensus criteria by providing a probability-based approach. Also, independent evalua-tion of the ACCP/SCCM sepsis definievalua-tions may be more useful than the strict, hierarchical inclusion criteria to reduce ambiguous and heterogeneous classifica-tion. Finally, a statistical model including time-dependency may be more useful than retrospective microbiological confirmation to identify disease progression in real-time. Therefore, the objectives of this work are to further develop the model-based multivariate biomarker [Blakemore et al., 2008; Lin et al., 2011a] for severe sepsis diagnosis by:
1. Examining the potential use of statistical models to develop a probability-based diagnostic approach for clinical decision making.
2. Examining the classification outcome of the sepsis definitions scored inde-pendently, rather than hierarchically.
3. Examining the potential use of statistical models to develop a time-dependent diagnostic approach for clinical decision making.
Chapter 3
Kernel density estimates
3.1
Introduction
3.1.1
Clinical issues
Severe sepsis is a serious medical emergency defined as the combination of sys-temic inflammatory response syndrome (SIRS) and organ failure due to infection [Bone et al., 1992; Levy et al., 2003]. In the adult Intensive Care Unit (ICU), severe sepsis has an 11–15% incidence, 30–60% mortality rate, $22,100 USD av-erage cost per case, $16.7 billion USD annual total cost, and 1.5% projected annual increase [Angus et al., 2001]. Sepsis is the 11th leading cause of all forms of death in the USA [Murphy et al., 2013].
Early sepsis diagnosis allows early treatment, which is critical for patient survival [Kumar et al., 2006]. However, blood culture test results to determine if there is an infection return in 24–48 hours, while serious complications may develop rapidly. Additionally, 50% of ‘culture negative’ sepsis cases are inconclu-sive.
24 CHAPTER 3 KERNEL DENSITY ESTIMATES
Thus, there remains a significant need for an objective, early, accurate, and readily available diagnostic test for sepsis. Some biomarkers have been evalu-ated for use in sepsis diagnostics. However, none have sufficient specificity nor sensitivity to be routinely employed in clinical practice [Pierrakos et al., 2010]. In particular, hourly detection methods would provide the most rapid approach. If effective, it would enable appropriate antibiotic dosing at the earliest oppor-tunity, which has been shown to reduce mortality. Currently, no such accurate, rapid, nor early diagnostic method exists.
3.1.2
Kernel density estimation
Kernel density estimation (KDE) can be used for classification and identification of potential diagnostic biomarkers [Hastie et al., 2009; Moorhead et al., 2008]. As an improvement over histograms, KDE provides smooth and continuous proba-bility density functions of a random variable from a finite sample. These non-parametric density estimates can be used for classification using Bayes’ theorem, yielding a posterior probability [Hastie et al., 2009]. Thus, KDE provides a prob-abilistic diagnostic approach given an objective metric associated with the disease state.
Model-based insulin sensitivity (SI) provides a potential such metric, given its relation to patient condition and objective calculation [Hann et al., 2005]. It is used here in combination with other objective clinical metrics associated with sepsis including: temperature, heart rate, respiratory rate, systolic blood pres-sure, diastolic blood prespres-sure, and the systemic inflammatory response syndrome (SIRS) score. This research presents a kernel implementation of the Bayes classi-fier by estimating the class conditional densities of severe sepsis and septic shock cases and SIRS and sepsis controls and for classification.
3.1 INTRODUCTION 25
(CONTROL 2010, Coventry UK) [Parente et al., 2010b], and the International Sepsis Forum (Sepsis 2010, Paris FR) Symposia [Parente et al., 2010c].
3.1.3
Prior work
Model-based insulin sensitivity (SI) can be identified in real time [Chase et al., 2007]. SI decreases with worsening condition [Chambrier et al., 2000] and in-creases with improvement [Langouche et al., 2007; Evans et al., 2011]. Thus, high
SI correctly identifies 75% of patient hours with sepsis [Blakemore et al., 2008], while SI and physiological data provides 73% sensitivity and 80% specificity for severe sepsis [Lin et al., 2011a]. However, this approach more adequately rules out sepsis, which is not the same as diagnostic, ruling in of the existence of sepsis.
3.1.4
Related work
Mica et al. [2012] used density estimates in a study to assess the diagnostic quality of trauma scores for SIRS and sepsis in polytrauma patients. Importantly, density estimates were not used for classification, but rather to describe the density mode (peak) for each of: no SIRS, SIRS, and sepsis categories as a supplement to other descriptive statistics. The main result showed APACHE II severity scores [Knaus et al., 1985] distinguished no SIRS and sepsis with moderate accuracy (0.82 (0.73–0.88) AUC), while all other trauma scores had low accuracy. However, the clinically relevant question - discrimination between SIRS and sepsis - was not reported. Upon visual inspection of the density estimates (Figure 1 [Mica et al., 2012]), the densities overlap more with increasing SIRS severity, indicating that APACHE II has low accuracy to discriminate between SIRS and sepsis.
26 CHAPTER 3 KERNEL DENSITY ESTIMATES
changing patient condition. In contrast, the work presented in this research has the advantage of resolution of physiological predictors and real-time classification.
Mart´ınez-Camblor [2011] explored the impact of classification errors on the clinical decision making process and the effects on the final results on the variabil-ity of the associated cutoff point estimator. To take into account the impact of misclassification, the authors introduced a linear utility function, where a weight determined the final impact between sensitivity and specificity, and then applied the proposed methods on a data set to study the cutoff point of procalcitonin (PCT) which correctly identified viral sepsis in the paediatric Intensive Care Unit. Kernel density estimates were used for the logarithmic of the PCT levels and for the utility function for PCT, which resulted in 0.88 sensitivity and 0.80 specificity, for an even weighting. As more weight was placed on sensitivity, the obtained utility increased.
However, lacking repeatability, the authors did not provide a definition of sepsis, population data, nor sample selection criteria, only the PCT minimum, maximum, and quantile values for ‘positive’ and ‘negative’ groups. Moreover, the PCT cutoff levels were not provided, which would be necessary for clinical use and comparison to other PCT studies [Giamarellos-Bourboulis et al., 2004; Uzzan et al., 2006; Tang et al., 2007; Nakamura et al., 2009]. It is important to define the best cutoff levels with sufficient sensitivity and specificity to differen-tiate a patient with sepsis form a patient without sepsis. Therefore, in this work, 90% sensitivity and specificity levels are reported with their associated posterior probability cutoff values, as well as multilevel likelihood ratios (MLR) to return more useful information beyond a dichotomised result to allow which levels of test results yield clinically important information, and which levels of test results do not.
3.2
Methods
3.2.1
Principle design
3.2 METHODS 27
hours of sample data were obtained from the patient record of 36 adults in the Christchurch Hospital ICU with confirmed sepsis and while on the SPRINT glycemic control protocol. Additional data in the patient record included hourly: model-based insulin sensitivity, temperature, heart rate, respiratory rate, systolic blood pressure, diastolic blood pressure, and SIRS score. Use of this data was approved by the NZ Upper South Islands Ethics Committee.
[image:47.595.116.522.398.453.2]The ACCP/SCCM international sepsis definitions [Levy et al., 2003] were applied to the patient record to categorise each data hour as SIRS, sepsis, severe sepsis, or septic shock. Patient hours were removed if they had missing concur-rent physiological data, model-based insulin sensitivity levels equalling zero, and patient hours both without infection and less than two SIRS criteria. Thus, 6071 hours were available for developing the classifier.
Table 3.1: Table of hourly patient SIRS, sepsis, severe sepsis, and septic shock [Levy et al., 2003].
categorisation SIRS sepsis severe sepsis septic shock
raw data 4918 (48.95%) 4888 (48.65%) 91 (0.91%) 151 (1.50%) filtered data 1558 (25.66%) 4300 (70.83%) 85 (1.40%) 128 (2.11%)
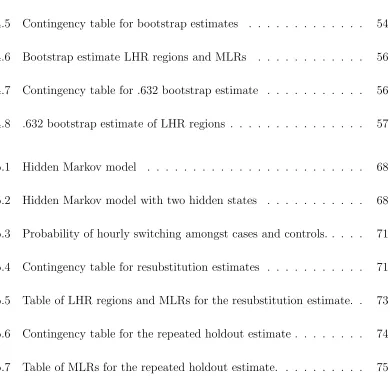
Cohorts were defined at a discrimination level of severe sepsis. Therefore, in this data set, samples comprised 213 hours of severe sepsis and septic shock cases and 5858 hours of SIRS and sepsis controls (Table 3.1). Disease prevalence for the dataset was therefore 3.5%, which is not atypical. Box and whisker plots of the physiological data by sepsis score (Figure 3.1) show that some predictors may be more useful in discriminating sepsis levels than others. Thus, the classifier was designed to discriminate severe sepsis and septic shock from SIRS and sepsis controls in real-time for sepsis patients using only their readily available bedside monitored physiological data in the ICU.
3.2.2
Performance assessment
28 CHAPTER 3 KERNEL DENSITY ESTIMATES 0 0.5 1 1.5 2
x 10−3
SIRS sepsis severe shock
model−based insulin sensitivity
34 35 36 37 38 39 40
SIRS sepsis severe shock
temperature 40 60 80 100 120 140 160 180
SIRS sepsis severe shock
heart rate 0 5 10 15 20 25 30 35 40 45 50
SIRS sepsis severe shock
respiratory rate 50 100 150 200 250
SIRS sepsis severe shock
systolic blood pressure
10 20 30 40 50 60 70 80 90 100 110
SIRS sepsis severe shock
diastolic blood pressure
0 0.5 1 1.5 2 2.5 3 3.5 4
SIRS sepsis severe shock
[image:48.595.114.479.121.338.2]SIRS score
Figure 3.1: Box and whisker plots of filtered predictor data (model-based insulin sensitivity, temperature, heart rate, respiratory rate, systolic blood pressure, diastolic blood pressure, and SIRS score) by sepsis level (SIRS, sepsis, severe sepsis, and septic shock).
• Likelihood ratios (LHR)
• Multilevel likelihood ratios (MLR)
• Receiver operating characteristic (ROC) curve
• Area under the ROC curve (AUC)
• ROC cutoff yielding the highest discriminative ability
• Confidence intervals for each measure
3.2 METHODS 29
Additional measures of test accuracy include: sensitivity, specificity, positive predictive value (PPV), negative predictive value (NPV), and DOR. Sensitivity and specificity levels over 90% are sufficient to be routinely employed in clini-cal practice [Pierrakos et al., 2010], but are hard to obtain, if not impossible, to achieve in sepsis diagnosis. Predictive values are mainly determined by the preva-lence of infection [Smith et al., 2000]. Thus, predictive values alone depend not only on the test’s properties, but also on the prevalence of disease in the popula-tion. A very low incidence, as with severe sepsis, makes it very difficult to achieve high PPV. Therefore, tests independent of disease prevalence are preferred and employed, such as LHR, AUC, and DOR.
3.2.3
Technical exposition
Kernel density estimates were used for the development of joint probability den-sity profiles for 213 hours of severe sepsis and septic shock cases and 5858 hours of SIRS and sepsis controls and for classification. A kernel probability density profile was made for each cohort and for the clinical predictor. Thus, a single density is used to encompass the predictors. Finally, the unknown patient hour to be classi-fied was tested against these established datasets, with the result being a classifi-cation into either the case or control group. Optimal diagnostic performance from the ROC curve was determined for resubstitution [Hastie et al., 2009], bootstrap [Efron, 1983], and .632 bootstrap estimates [Efron and Tibshirani, 1997].
3.2.4
Kernel density estimates
3.2.4.1 Classification
30 CHAPTER 3 KERNEL DENSITY ESTIMATES
Let x∗
0 denote the values of the clinical predictors at the given patient hour,
and ˆfS(x∗
0) and ˆfN(x∗0) denote the joint probability densities for cases and controls
at that value. For each hour, the posterior probability of being from the cases, given the data values obtained at that hour is defined [Hastie et al., 2009]:
ˆ
P r(S|x∗0) = πSˆ fSˆ(x
∗
0)
ˆ
πSfˆS(x∗0) + ˆπNfˆN(x∗0)
(3.1)
The posterior probability of being from the controls, given the data values ob-tained at that hour is ˆP r(N|x∗
0) = 1−P rˆ (S|x∗0).
In Equation 3.1, ˆπS and ˆπN are the prior probabilities of the sample being in that group. The prior probabilities are usually set to the sample proportions [Hastie et al., 2009] or to 0.5, if no reliable historical information is known or the clinical judgement at that hour is a chance result. Thus, if the ratio in Equation 3.1 is greater than a specified probability threshold, then the sample is classified as being from group S, otherwise it is classified as being from group N.
3.2.4.2 Kernel density estimation
Kernel density estimation is a non-parametric way to estimate the probability density function of a random variable. The study data can be thought of as samples of independently and identically distributed random variables, drawn from a distribution with an unknown density. It is of interest to estimate the shape of this function. A kernel implementation of the Bayes classifier estimates the class conditional densities using kernel density estimators [Hastie et al., 2009].
As the study observation class identities are known, they can be used as a training sample to construct a classifier. Thus, kernel density estimation is used to estimate the joint densities fS and fN, which are the conditional probability
functions of x ∈ S given data on S and x ∈ N given data on N. The kernel density estimator for ˆfS is:
ˆ
fS(x) = ˆf(x|S) =
1
MS MS
X
i=1
φ(x;xS,i, HS) (3.2)
3.2 METHODS 31
mean vector xS,i and d×dcovariance matrix and bandwidth matrix HS ∈Rd×d. For example, if d = 2, this results in a contour plot of bivariate normal density with non-zero diagonal covariance elements. In this study,d=7, which is the total number of clinical predictors employed.
3.2.4.3 Practical considerations
The natural logarithm is used as a transform of positive components to use the real components. The vector x is orthogonalized using the Cholesky or PCA transform. To orthonormalize is essentially rotation and scaling of the observed predictor vectors. Orthonormalization makes the covariance matrix for the or-thonormalizedxequal to the identity matrix, which provides matrix stability and a fixed reference value.
3.2.4.4 Product kernel
Assuming a diagonal bandwidth matrix (Hi =diag(hi,1, ..., hi,d)), which presumes
variable independence, φ becomes:
φ(x;xi,j, Hi) =
d
Y
ℓ=1
φ(xℓ;xi,j,ℓ, hi,ℓ)
whereφ is univariateN(xi,j,ℓ, h2
i,ℓ), which reduces the number of bandwidth
com-ponents needed to specify to d components. Thus, the kernel estimator for the joint density or class conditional probability can be written as:
ˆ
fS(x) = 1
MS MS
X
i=1
(
d
Y
ℓ=1
φ(xℓ;xS,j,ℓ, hS,i)) (3.3)
where the bandwidth hS,i = min{sS,i,IQRS,i1.348 }MS−1/(4+d), sS,i is the sample stan-dard deviation for the component, and IQRis the sample interquartile range for the component. This approach results in a product of univariate kernels, and thus the name, product kernel [Cooley and MacEachern, 1998].
32 CHAPTER 3 KERNEL DENSITY ESTIMATES
among the components of the rotated data. Alternatively, it can be said that the kernel product assumes that the components of x are independent. The product kernel does not assume this independence, but, instead, makes the weaker as-sumption that the kernel has independent components. Practically, in this study, these assumptions mean that it is assumed that the various clinical measurements used as predictors are independent, even if all are associated with sepsis.
3.2.5
Resubstitution estimate
The resubstitution estimator of the classification error rate is obtained by using the same sample to construct the classifier and also to assess its performance. Hence, the resubstitution estimator underestimates the true error rate because it has effectively been trained and tested on the same data. Resubstitution esti-mates thus represent the maximum performance of the developed classifier.
3.2.6
Bootstrap estimate
Cross-validation is the traditional method to counteract the downward bias prob-lem of the resubstitution estimator, which results in small bias, but high vari-ability. To reduce the high variability of cross-validation, bootstrap estimators were proposed by Efron [1983]. Bootstrap estimates using the stratified bootstrap method randomly takes out 20% of the data to test against for each bootstrap run and 1000 bootstrap runs were used to estimate the mean classification error rate. Bootstrap estimates thus represent a measure of the minimum performance of the developed classifier.
3.2.7
The .632 bootstrap estimate
3.3 RESULTS 33
the developed classifier. It is effectively the bias corrected estimate between the resubstitution and bootstrap estimates.
3.3
Results
3.3.1
Kernel density estimates
Product kernel estimates produced the greatest resubstitution AUC values (0.98– 0.99 AUC), which outperformed all kernel product estimates (0.81–0.85 AUC). Prior probabilities using disease prevalence strongly skewed the distribution of posterior probabilities, while 0.5 priors were not skewed and provided higher AUCs for all error estimates. PCA transformations were unstable for bootstrap estimates, while Cholesky transformations performed well. Thus, the following results are from the most stable and accurate kernel density estimate, which used the product kernel, 0.5 for the prior probabilities, and Cholesky transformation.
3.3.2
Resubstitution estimate
Table 3.2: Contingency table for resubstitution estimates
0.35 cutoff 213 cases 5858 controls predictive values
positive tests 201 352 PPV = 0.36
negative tests 12 5506 NPV = 1.00
performance measures sensitivity = 0.94 specificity = 0.94 AUC = 0.99 likelihood ratios LHR+ = 15.70 LHR- = 0.06 DOR = 262
34 CHAPTER 3 KERNEL DENSITY ESTIMATES
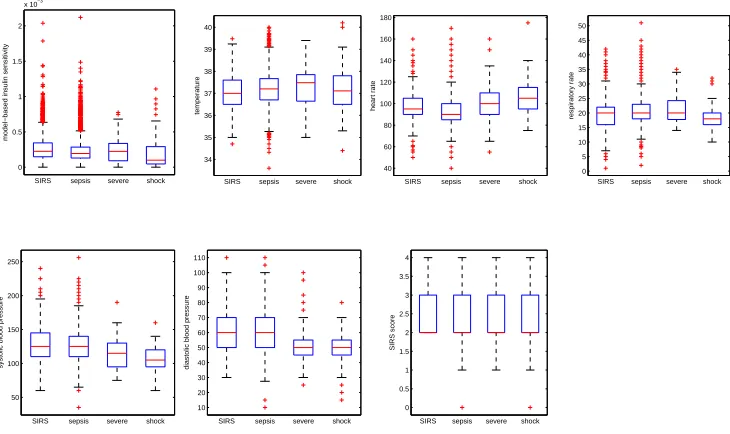
Figure 3.2: Subplot 1: ROC curve for the resubstitution estimate. Subplot 2: His-togram of posterior probabilities normalised by cohorts. Subplot 3: Box and whisker plot of posterior probabilities by sepsis score.
as likely to be found in a case hour than from a control hour. Thus, both LHRs have the potential to alter clinical decisions [Jaeschke et al., 1994b]. However, resubstitution yields the best estimate.
Figure 3.2 shows the ROC curve, a histogram of probabilities normalised by cohorts, and a box and whisker plot of probabilities by sepsis score. The resub-stitution estimate AUC is near perfect and performs with high accuracy [Swets, 1988]. Clinically significant levels of 90% sensitivity is reached at a cutoff value of 0.39 with 96% specificity. Similarly, 90% specificity is obtained at a cutoff value of 0.29 with 96% sensitivity. LHR values at the optimal cutoff value are found within the regions with the potential to change clinical decisions [Jaeschke et al., 1994b].
![Table 3.1:Table of hourly patient SIRS, sepsis, severe sepsis, and septic shock[Levy et al., 2003].](https://thumb-us.123doks.com/thumbv2/123dok_us/9031804.399624/47.595.116.522.398.453/table-table-hourly-patient-sepsis-severe-sepsis-septic.webp)


![Figure 4.1: Sepsis score in time per patient. ACCMP/SCCM sepsis scores are in red[Bone et al., 1992; Levy et al., 2003] and the independent criteria are in green.](https://thumb-us.123doks.com/thumbv2/123dok_us/9031804.399624/69.595.168.524.124.343/figure-sepsis-patient-accmp-sepsis-scores-independent-criteria.webp)
