The Sloan Digital Sky Survey Reverberation Mapping Project: Accretion and Broad
Emission Line Physics from a Hypervariable Quasar
Jason Dexter1,2 , Shuo Xin1,3, Yue Shen4,5 , C. J. Grier6,7,8 , Teng Liu1 , Suvi Gezari9,10 , Ian D. McGreer8 , W. N. Brandt6,7,11 , P. B. Hall12 , Keith Horne13 , Torben Simm1, Andrea Merloni1, Paul J. Green14 , M. Vivek6, Jonathan R. Trump15 , Yasaman Homayouni15 , B. M. Peterson16,17,18 , Donald P. Schneider6,7, K. Kinemuchi19 ,
Kaike Pan19 , and Dmitry Bizyaev19,20
1Max-Planck-Institut für extraterrestrische Physik, Giessenbachstr. 1, D-85748 Garching, Germany;[email protected] 2
JILA and Department of Astrophysical and Planetary Sciences, University of Colorado, Boulder, CO 80309, USA
3
School of Physics Sciences and Engineering, Tongji University, Shanghai 200092, People’s Republic of China
4
Department of Astronomy, University of Illinois at Urbana-Champaign, Urbana, IL 61801, USA
5
National Center for Supercomputing Applications, University of Illinois at Urbana-Champaign, Urbana, IL 61801, USA
6
Department of Astronomy and Astrophysics, The Pennsylvania State University, 525 Davey Laboratory, University Park, PA 16802, USA
7
Institute for Gravitation and the Cosmos, The Pennsylvania State University, University Park, PA 16802, USA
8
Steward Observatory, The University of Arizona, 933 North Cherry Avenue, Tucson, AZ 85721, USA
9
Department of Astronomy, University of Maryland, College Park, MD 20742, USA
10
Joint Space-Science Institute, University of Maryland, College Park, MD 20742, USA
11
Department of Physics, 104 Davey Laboratory, The Pennsylvania State University, University Park, PA 16802, USA
12Department of Physics and Astronomy, York University, Toronto, ON M3J 1P3, Canada 13
SUPA Physics and Astronomy, University of St Andrews, Fife, KY16 9SS, UK
14
Harvard Smithsonian Center for Astrophysics, 60 Garden Street, Cambridge, MA 02138, USA
15
University of Connecticut, Department of Physics, 2152 Hillside Road, Unit 3046, Storrs, CT 06269, USA
16
Department of Astronomy, The Ohio State University, 140 W 18th Avenue, Columbus, OH 43210, USA
17
Center for Cosmology and AstroParticle Physics, The Ohio State University, 191 West Woodruff Ave., Columbus, OH 43210, USA
18
Space Telescope Science Institute, 3700 San Martin Drive, Baltimore, MD 21218, USA
19
Apache Point Observatory and New Mexico State University, P.O. Box 59, Sunspot, NM, 88349-0059, USA
20
Sternberg Astronomical Institute, Moscow State University, Moscow, Russia
Received 2019 June 14; revised 2019 September 6; accepted 2019 September 9; published 2019 October 29
Abstract
We analyze extensive spectroscopic and photometric data of the hypervariable quasar SDSSJ141324+530527 (RMID 017) atz=0.456, an optical “changing-look”quasar from the Sloan Digital Sky Survey Reverberation Mapping project that increased in optical luminosity by a factor;10 between 2014 and 2017. The observed broad emission lines all respond in luminosity and width to the changing optical continuum, as expected for photoionization in a stratified, virialized broad emission line region. The luminosity changes therefore result from intrinsic changes in accretion power rather than variable obscuration. The variability is continuous and apparently stochastic, disfavoring an origin as a discrete event such as a tidal disruption flare or microlensing event. It is coordinated on day timescales with blue leading red, consistent with reprocessing powering the entire optical spectral energy distribution. We show that this process cannot work in a standard thin disk geometry on energetic grounds, and would instead require a large covering factor reprocessor. Disk instability models could potentially also explain the data, provided that the instability sets in near the inner radius of a geometrically thick accretion disk.
Unified Astronomy Thesaurus concepts:Quasars(1319);Accretion(14);Supermassive black holes(1663)
1. Introduction
The continuum optical/UV emission of quasars has long been known to vary, with typical rms fluctuations of ;10%– 20% correlated on timescales of months to years (e.g., Kelly et al.2009; Kozłowski et al.2010; MacLeod et al.2010). This variability is often correlated over a wide wavelength range (e.g., Clavel et al.1991; Peterson et al.1991), which requires a propagation speed 0.1c(Krolik et al. 1991) if the emission region size scales with characteristic emission wavelengthλas
R∝λ4/3 predicted by standard thin accretion disk theory (Shakura & Sunyaev 1973). This timescale is much shorter than expected for the propagation of accretion ratefluctuations through the disk (Pringle 1981), and those variations are usually associated with reprocessing of emission from near the black hole. Intensive monitoring campaigns have shown that the X-ray relationship is more complex than for the UV (Edelson et al. 2019). When either the UV or X-rays are
correlated with the response at longer optical wavelengths, the measured lag in a reprocessing model measures the wave-length-dependent emission region size (e.g., McHardy et al. 2014; Fausnaugh et al.2016).
A small fraction of quasars exhibit large optical luminosity variations by factors of2 (“hypervariable,”Rumbaugh et al. 2018). Rare, optical “changing-look” active galactic nuclei (AGNs) show appearance or disappearance of one or more broad emission lines. Those changes are associated with factor of∼10 variations in optical continuum luminosity on month to year timescales. Long known in nearby Seyferts (Tohline & Osterbrock 1976; Cohen et al. 1986; Clavel et al. 1989; Storchi-Bergmann et al. 1995), this type of large amplitude, rapid variability is now found in higher luminosity quasars (LaMassa et al.2015; MacLeod et al.2016,2018; Ruan et al. 2016; Runnoe et al.2016; Gezari et al.2017; Stern et al.2018; Wang et al.2018; Yang et al.2018; Trakhtenbrot et al.2019a). Evidence from short timescale variability of both the broad
emission lines and continuum (e.g., LaMassa et al. 2015), a lack of change in optical reddening (MacLeod et al. 2016)or X-ray column (Husemann et al. 2016), echoed mid-infrared variability(from warm dust)following optical variability(Stern et al.2018), and spectro-polarimetry(Hutsemékers et al.2017) all imply that these objects undergo rapid changes in intrinsic accretion power on timescales much shorter than the 104–6yr inflow time expected for a standard thin disk. In certain cases, the variability could be driven by a discrete event such as a tidal disruptionflare(Merloni et al.2015), microlensing(Bruce et al. 2017), or a binary black hole interaction (Kim et al. 2018). Generally, however, changing-look events appear to be the rare excursions to large amplitude of the continuous and stochastic variability seen in“hypervariable”(Rumbaugh et al. 2018)and ordinary(Kelly et al.2009)quasars.
Large-amplitude, rapid variations in luminous quasars are difficult to explain in the context of standard accretion disk theory. Either the entire AGN optical spectral energy distribu-tion(SED)must be powered by reprocessing of central UV or X-ray emission (Shappee et al.2014; Lawrence2018), AGNs are subject to disk instabilities possibly including fast state transitions(e.g., Noda & Done2018; Ross et al.2018), and/or inflow through the disk can be much more rapid than commonly assumed(Dexter & Begelman2019).
These scenarios make markedly different predictions for spectral evolution during changing-look events. Reprocessing in a thin disk should show coordinated variability at all wavelengths with blue leading red. The fractional variability amplitude should also decrease with increasing wavelength due to geometric dilution of the centralflux and the larger variation in light travel time to the emission region at long wavelength (e.g., Kazanas & Nayakshin2001; Sergeev et al.2005; Cackett et al.2007; Shappee et al.2014). Rapid inflow should result in red wavelengths leading with long delay timescales corresp-onding to viscous evolution (Pringle 1981). Disk instabilities could produce either band leading, possibly accompanied by a change in SED shape due to changes in disk structure.
The quasar SDSSJ141324+530527 at z0.456 was recently identified as a “turn-on” changing-look object, in which the broad Hαand Hβlines increased in strength during a large change in continuum luminosity in 2017 (Wang et al. 2018). This object is included in the Sloan Digital Sky Survey Reverberation Mapping(SDSS-RM, RMID 017)campaign that intensively monitors 849 quasars with optical imaging and spectroscopy since 2014 (Shen et al. 2015a). We present extensive optical to X-ray photometric and spectral monitoring data of the source from 2009 to 2018 taken as part of the SDSS-RM campaign, including intensive SDSS spectral monitoring over the lastfive years(Section2), including from SDSS-IV(Blanton et al.2017). We use the optical continuum (Section3)and broad emission line(Section4)evolution from this extensive data set to confirm that optical changing-look quasars are powered by order of magnitude intrinsic variations in accretion power. From the line shape and luminosity evolution, we probe the low-ionization broad emission line region structure and physical conditions in a luminous quasar. We describe the difficulties in explaining these observations in terms of simple reprocessing or intrinsic disk emission models (Section 5).
2. Observations
SDSSJ141324+530527 was included in the SDSS-RM campaign (Shen et al. 2015a). SDSS-RM has observed 849 quasars in a 7 deg2 field coinciding with the Pan-STARRS1 Medium Deep Field MD07 (R.A. J2000=213.704, decl. J2000=+53.083, Tonry et al. 2012). The monitoring included intensive spectroscopy with the Apache Point 2.5 m SDSS telescope(Gunn et al.2006), along with accompanying photometry obtained from the CFHT and Bok telescopes. Pan-STARRS 1 photometry is also available from 2010 to 2013, along withGalaxy Evolution Explorer (GALEX) observations and 2XMM-Newtonobservations in 2017. We summarize the data set and reduction procedure used here.
2.1. SDSS Spectra
The SDSS-RM spectra analyzed here were obtained with the BOSS spectrographs(Smee et al.2013)between 2014 January and 2018 June. We use data from 77 epochs, with a median cadence of only 4 days in 2014 and 16 days in the other years over 7 months of observing per year.
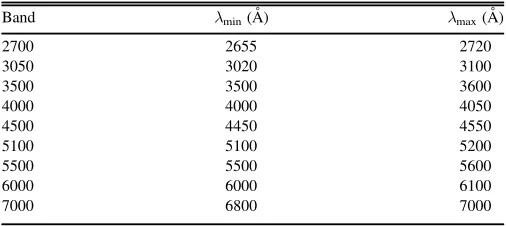
[image:2.612.317.570.74.187.2]The exposure time was typically 2 hr, and the data werefirst processed by the BOSS pipeline, followed by a custom scheme to improve spectrophotometry and sky subtraction (for technical details on the SDSS-RM spectroscopy, see Shen et al.2015a). The typical absolute spectrophotometric accuracy achieved is ∼5%. More detail on the spectroscopy data and analysis can be found in Shen et al. (2019) and Grier et al. (2019). From the spectra, we estimate continuum luminosities as mean values over narrow bands (Table 1), avoiding clear emission lines in the time-averaged spectrum. We have not tried to model weak narrow emission lines or the pseudo-continuum from FeII. We first subtracted the host galaxy spectrum at each epoch using the template found from spectral decomposition by Shen et al. (2015b). The host galaxy contribution exceeds that of the AGN for rest frame λ>4000Å in 2014–2015. We measured emission line properties after subtracting a polynomial fit to the nearby continuum. The lineflux is estimated by numerically integrat-ing over the measuredflux in each channel. The line width is characterized by both the FWHM and the square root of the second moment, σ. Both measurements are made directly on the data rather than using a model. The integration is performed over the spectral windows defined in Table2. For Hβat earlier epochs, the line is very broad and blends with the[OIII]λ4959 andλ5007 doublet. Wefit for and remove those forbidden lines separately before measuring the Hβline properties. The[OIII] λ5007flux is constant to within an rms of 10%, which is then
Table 1
Rest Frame Continuum Luminosity Bands Used Here
Band λmin(Å) λmax(Å)
2700 2655 2720
3050 3020 3100
3500 3500 3600
4000 4000 4050
4500 4450 4550
5100 5100 5200
5500 5500 5600
6000 6000 6100
an estimate of a typicalflux error. There is no secular change in
[O III]λ5007 flux over time. Typical errors on the measured line width σline, as measured by the distribution of their
residuals when subtracting a power-law dependence on luminosity (see Section 4), are ;250 km s−1for the reliably measured Hα, Hβ, MgII, and Hγ lines. We note that the PrepSpec code(described in Shen et al.2016)used for SDSS-RM reverberation measurements(Shen et al.2016; Grier et al. 2017,2019; Homayouni et al.2018)obtains[O III]λ5007flux measurements with5% rms.
Finally, we converted the observed frameflux to the emitted monochromatic luminosity νLνassuming luminosity distances based on a WMAP 9 yr cosmology(Hinshaw et al. 2013) as implemented inastropy(Astropy Collaboration et al.2013) (H0=69.3 km Mpc−1s−1,ΩM=0.287,ΩΛ=0.713).
2.2. SDSS-RM Photometry
Photometric observations of SDSSJ141324+530527 were obtained in both thegandibands(Fukugita et al.1996)using the Steward Observatory Bok 2.3 m telescope on Kitt Peak and the 3.6 m Canada–France–Hawaii Telescope (CFHT) on Maunakea. They cover roughly the same monitoring period as the SDSS-RM spectroscopy in 2014 with a cadence of about 2 days in 2014 and more sparse in the following years. The Bok observations were obtained with the 90Prime instrument (Williams et al.2004), which has a 4k×4k CCD with a plate scale of 0 45 pixel−1 and a field of view of 1°×1°. The CFHT observations were taken with the MegaCam instrument (Aune et al.2003), which has a pixel scale of 0 187 and also has a 1°×1°field of view. Details of these observations and their processing will be provided by K. Kinemuchi et al.(2019, in preparation).
The data were processed via pipelines for their respective instruments. Light curves were produced using the image subtraction method of Alard & Lupton (1998), Alard(2000) using the publicly available software ISIS. This method aligns the images and then subtracts each individual epoch from a reference frame that is produced from a subset of the highest-quality images. Before subtraction, ISIS alters the PSF of the reference frame to match that of the individual epoch. This process results in a subtracted image that contains the residual flux, on which a PSF-weighted aperture is placed to measure theflux and produce a residual-flux light curve.
For 2014–2017, we also produce a version of the merged photometry and errors between SDSS, Bok, and CFHT. We use the CREAM code and procedure described in Starkey et al. (2016). CREAM models the light curve allowing an additive offset, multiplicative scaling factor, and transfer function for each band/instrument/telescope. These parameters are optimized using
a Markov Chain Monte Carlofitting process. The rescaledgandi
band light curves are placed on the same scale and merged into a single continuum light curve. The uncertainties are further rescaled based on the variance between neighboring epochs. The impact of this rescaling is to increase the error bars, typically by factors;2–3(Grier et al.2019). In this procedure, we found a systematic offset of the CFHT data in 2016, likely due to a switch to differentfilters, and removed them from the merged light curve.
2.3. PS1 Photometry
We used PS1 light curves of SDSSJ141324+530527 in the
g,r,i,z,ybands from the Medium Deep Field Survey MD07 field(Tonry et al.2012)covering the time period 2010–2013. The light curves are taken from Shen et al.(2019)and details of the photometric calibration are described in Schlafly et al. (2012) and Magnier et al. (2013). We have further removed flagged data (where there is no measured error) and a few obvious outliers (measurements >4 standard deviations away from the median of that year).
2.4. GALEXPhotometry
AGALEXNUV light curve was obtained using data from the
GALEX Time Domain Survey (Gezari et al. 2013). We
performed aperture photometry on each GALEX epoch at the position of the nearest source to the SDSS position within 3″in a deep coadd of all of theGALEXimages. We use an aperture radius of 6″, and apply an aperture correction for the energy enclosed, and a zero-point for the AB magnitude system. The photometric error was determined for each epoch empirically from the standard deviation of a control sample of sources between epochs as a function of magnitude, following Gezari et al. (2013). We detect the quasar in 19 GALEX epochs between 2009 May and 2011 March.
2.5.XMM-Newton
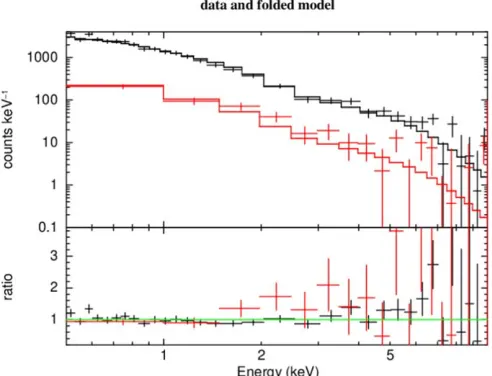
SDSSJ141324+530527 was observed byXMM-Newtontwice, in 2017 June (OBSID=0804271301) and 2017 November (OBSID=0804271801). The EPIC net counts in the 0.5–10 keV band were 3789 and 420 for the two observations with exposure times of 17 and 5.4 ks. We extracted the PN, MOS1, and MOS2 spectra and fitted them with an absorbed power law plus a Compton reflection component (“pexrav”). We assumed a Galactic absorbing column density NH=1.1×1020cm−2. The
[image:3.612.45.568.75.157.2]modelfits to the spectra and residuals are shown in Figure1. Between the two observations (5 months separation), the 2–10 keV spectral shape remained an unobscured power law. The photon index, defined byN(E)∝E−Γ, ofΓ=2.15±0.05 remained constant between observations, while theflux dropped Table 2
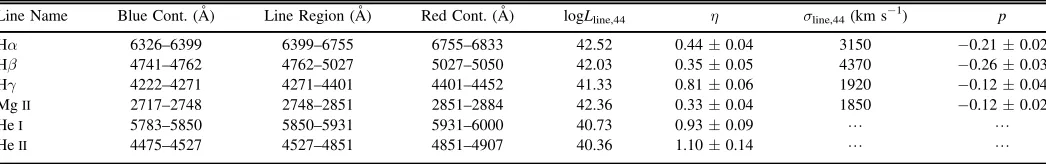
Rest Frame Continuum and Line Fitting Regions, Line Luminosities and Responsivities(η), and Line Widths and Breathing Indices(p)
Line Name Blue Cont.(Å) Line Region(Å) Red Cont.(Å) logLline,44 η σline,44(km s−1) p
Hα 6326–6399 6399–6755 6755–6833 42.52 0.44±0.04 3150 −0.21±0.02
Hβ 4741–4762 4762–5027 5027–5050 42.03 0.35±0.05 4370 −0.26±0.03
Hγ 4222–4271 4271–4401 4401–4452 41.33 0.81±0.06 1920 −0.12±0.04
MgII 2717–2748 2748–2851 2851–2884 42.36 0.33±0.04 1850 −0.12±0.02
HeI 5783–5850 5850–5931 5931–6000 40.73 0.93±0.09 L L
HeII 4475–4527 4527–4851 4851–4907 40.36 1.10±0.14 L L
Note.The line luminosity andσlinenormalizations are scaled to a 2700ÅluminosityνLν=1044erg s−1. We do not report line width information for the faint He lines
by a factor of 3.6. The unabsorbed rest-frame 2–10 keV luminosities of the two observations are LX=(3.09±0.17)×
1044erg s−1 and (8.6±1.0)×1043erg s−1. Fitting the two spectra simultaneously gives a 90% upper limit for any absorbing column ofNH=9×10
19
cm−2.
3. Rapid, Large-amplitude Continuum Variations
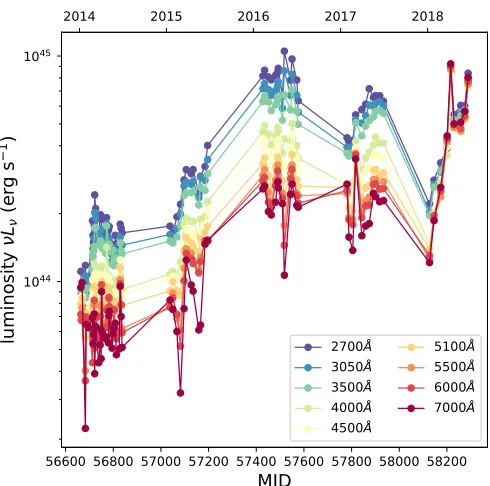
SDSSJ141324+530527 shows continuous, large-amplitude optical variability over the past;10 yr(left panel of Figure2). The initial Pan-STARRS monitoring showed a factor ;2–3 increase (near MJD 55500)from the luminosity inferred from the 2004 SDSS spectrum. A drop and similar rise occurred again during the high-cadence SDSS-RM monitoring in 2014 (near MJD 56600). Subsequently, the luminosity increased by a factor;10 over roughly a year period. It has since stayed high, but with large excursions e.g., a factor 2 drop in 2017 in all bands(near MJD 58100)followed by a rise by a factor of;3–6 within the 6 month observing window during 2018. The period from 2014 to 2017 is shown in more detail, with estimated photometric uncertainties from the CREAM modeling and merging, in the right panel of Figure 2.
The variations are highly correlated and nearly simultaneous across the measured optical band. This is shown for the SDSS-RM spectra in Figure3. A detailed continuum lag analysis for the high-cadence data found that theg-band leads thei-band by
;3–6 days(Homayouni et al.2018). The lower cadence of the later light curve precludes a continuum lag measurement, but continues to show rapid and highly correlated variations consistent with the high-cadence monitoring.
Until 2018, the fractional amplitude changes are similar across all optical bands. The blue bands increase somewhat more during the first dramatic rise with νLν consistent with a power law of slope 1.2–1.4, similar to the value of 4/3 expected for a thin disk. The subsequentflattening, drop, and dramatic rise in 2018, by contrast, show dramatic reddening of the SED. By the end of observations in 2018 the SED was completely flat in νLν. Compared to the previous peak at similar luminosity ;1045erg s−1, the reddest bands increased in luminosity by a factor 3 while the bluest band slightly
decreased. For the estimated RM black hole mass measured from Hβ of M8´108M (Grier et al. 2017), the optical luminosity varies between Lopt/LEdd∼0.2%–2%, similar to
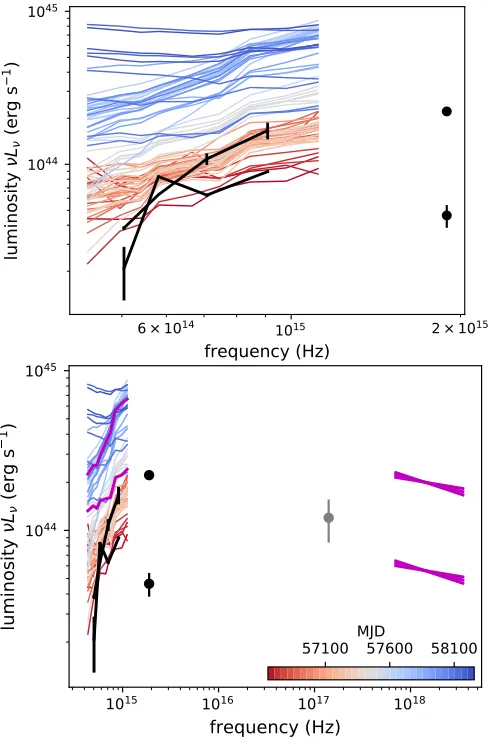
other hypervariable quasars which tend to have low Eddington ratios (Rumbaugh et al. 2018). The GALEX near-UV light curve shows similar evolution to that of theg-band from PS1 (Figure2)but with a slightly higher fractional rms amplitude. Sample host-subtracted SEDs are shown in Figure 4. We choose two epochs for the PS1/GALEX data(black) corresp-onding to low (2009) and high (2011) luminosity states. Continuum luminosities measured from the later SDSS spectra are shown as colored lines. Until 2018 (MJD;58100), the SED rises beyond our bluest optical band, except maybe in the low state of the PS1/GALEX monitoring. This is broadly consistent with a spectral break near 1000Åas seen in quasar composite spectra(e.g., Shull et al. 2012). For the estimated mass of ∼109MSun and observed Lopt, thin accretion disk
models predict a peak inνLν at;1015 Hz, broadly consistent with a peak location in between the PS1g and GALEXNUV bands. In many epochs, the continuum slope is comparable to the expected νLν∼ν4/3, while notably in 2018 it is much flatter. The X-ray luminosities measured by XMM are a factor of ;3 lower than quasi-simultaneous measurements in our bluest SDSS band. The resulting spectral indexaOX-1.2.
The source is mildly X-ray bright, roughly 1σoff the relation for ordinary quasars(Steffen et al.2006; Lusso et al.2010)and similar to other hypervariable ones (Collinson et al. 2018; Rumbaugh et al.2018). We do notfind evidence for a change in αOX between the two epochs where the X-ray luminosity
varies by a factor ;4, although only one of those epochs is measured quasi-simultaneously between X-ray and optical. For comparison, we also show a soft X-ray archival measurement fromROSAT2RXS(Boller et al.2016).
4. Broad Emission Line Response
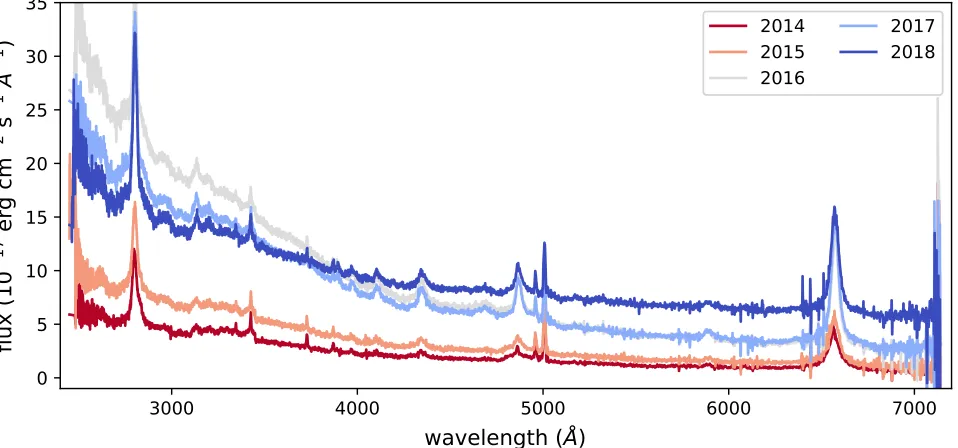
Host galaxy subtracted spectra averaged by year are shown in Figure5. All observed broad emission lines respond to the dramatic changes in the optical continuum. Example line profiles are shown for Hβ and MgII in Figure 6, with colors coded by time from red(early)to blue(late). In both cases, the lines brighten dramatically, especially in their lower velocity cores. The classification for Hβ changes from Type 1.8 to 1, which led to the classification of SDSSJ141324+530527 as a turn-on changing-look quasar(Wang et al.2018). Nonetheless, broad MgIIand Hαemission are detected at all times. We also note that Figure5provides evidence for increased OIIIλ3133 emission in high flux states, which could be produced by Bowenfluorescence(Trakhtenbrot et al.2019b). The similarly excited NIII λ4640 line is weak, which might suggest the metallicity in this object is not supersolar.
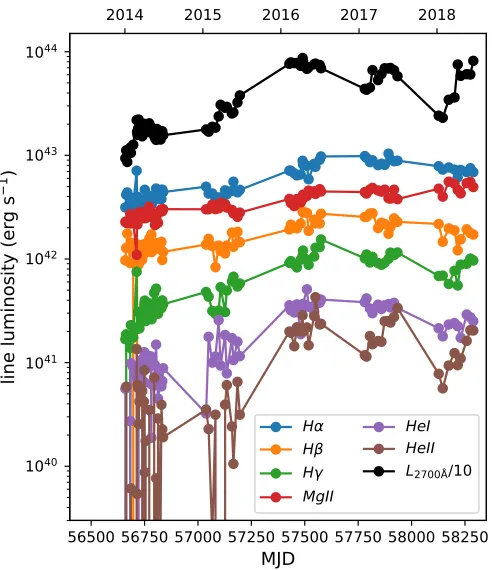
Figure 7 shows line luminosity versus time for all broad emission lines detected: the Balmer lines Hα, Hβ, Hγas well as MgII, HeIand HeII. The general rising trend is clear in all cases. The variability amplitude of the Balmer lines and MgII is much smaller than that of the He lines which more closely follow the changes in the optical continuum. The host galaxy subtraction leads to large systematic uncertainty in the HeIand HeIImeasurements in 2014–2015(Lline1041erg s−1). Many
of those points should be interpreted as upper limits.
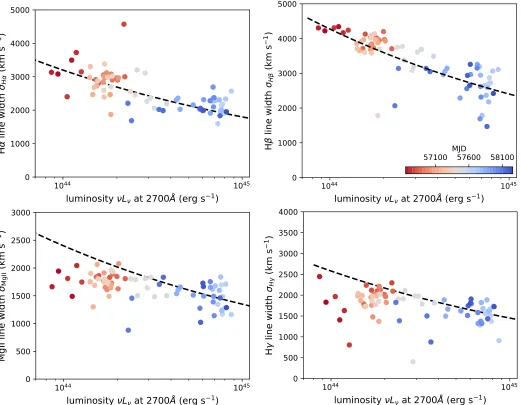
[image:4.612.46.292.54.242.2]For the more luminous Balmer lines and MgII we can also measure changes in the line widths(but not for HeIand HeII). Line widths for Hα, Hβ, MgII, and Hγas a function of optical Figure 1. Single power-law model fits (lines) to the XMM-Newton X-ray
luminosity are shown in Figure8, with no correction made for the ;40 days light travel time delay to the BLR (Grier et al. 2017). We show the results based onσ, but the results based on FWHM are similar. The Hαand Hβlines become significantly narrower at high luminosity. Similar behavior is seen in MgII where the line core visibly narrows at higher luminosity
(Figure6), but with a weaker luminosity dependence. This is consistent with the behavior seen in larger samples of both SDSS-RM and hypervariable quasars, where MgIIshows little or no response to continuum changes(Sun et al.2015; Wang et al.2019). The Hγtrend is also weaker, but the inferred line widths are uncertain at low luminosity due to the low signal-to-noise of the line.
We interpret the observed decrease in line width as the expected “breathing” of the BLR, where the emission peak moves to larger radius from the black hole at higher luminosity (Baldwin 1977; Koratkar & Gaskell 1991; Cackett & Horne 2006). The dashed black curves in Figure 8 show the trend of σ∝Lpwith p=−1/4, expected if the BLR radius
RBLR ∝ L1/2 and σ∝R−1/2 (and assuming a constant SED
shape, e.g., Peterson et al. 2002). Those simple scalings are consistent with the data for Hαand Hβ. The MgIIline width is also well constrained and shows a breathing effect, but with a shallower index(best-fitting values and uncertainties are listed in Table2). In all cases, the relevant velocity traced by the line width is falling with distance from the black hole. In other hypervariable quasars, the MgII line width is independent of continuum luminosity(Yang et al.2019). The FWHM shows similar breathing behavior, consistent with previous work(e.g., Shen2013; Zhang et al.2018).
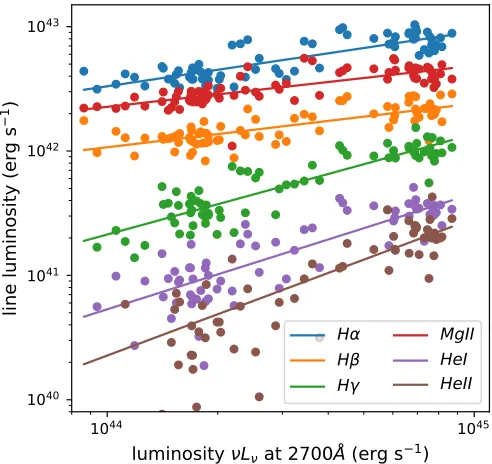
The line and continuum optical luminosities are correlated in all cases(Figure9). The large change in continuum luminosity provides a lever arm for measuring the responsivityηfor each emission line, defined here asLlineµL2700h Å. Bestfits of that
[image:5.612.48.562.50.272.2]form are indicated as solid lines in the figure, and the best-fitting values and uncertainties are given in Table 2. The Balmer lines and MgII show flatter, sub-linear correlations (smallerη), while the He line response is nearly linear. These findings are in excellent agreement with the predictions of photoionization models(e.g., Korista & Goad 2004). Among the Balmer lines, the strongest response is in Hγ, consistent with those models. The Hβ response is weaker than expected. Figure 2.Continuum optical light curve for SDSSJ141324+530527 from 2010 to 2018(left panel). The green and orange points are luminosities derived from Pan-STARRS PS1 and SDSS-RMg-band photometry, while the blue points are continuum measurements in the rest frame 3050Åband defined in Table1. The dotted curves mark the extrema used to measure SEDs includingGALEXNUV data, and the epochs of theXMM-Newtonobservations. The light curve shows continuous, rapid, large-amplitude variability. Features include a prominent rise and fall by a factor of 2 from 2010 to 2012, followed by a dramatic rise by almost an order of magnitude over a year from 2015 to 2016, and a sharp dip andfinal peak in 2018. In 2018 the optical luminosity increased by a factor of 3–6 in only 6 months. A zoom in of the 2014–2017 merged light curve is shown in the right panel on a linear scale.
Figure 3. Host galaxy subtracted, rest-frame multi-band continuum light curves measured from the SDSS spectra. During the initial large rise, the continuum maintains a blue shape. In the later drop and sharp rise in 2018, it suddenly reddens. At the final peak, the SED is completelyflat across the observed optical range. The host galaxy dominates in the red bands
(λ4000Å) in 2014–2015 when the AGN optical luminosity is low
[image:5.612.47.292.343.586.2]5. Discussion
We have analyzed optical to X-ray photometric and spectroscopic data of SDSSJ141324+530527, a hypervari-able, changing-look quasar in the SDSS-RM sample(identified as such by Wang et al. 2018). The large number of SDSS spectra as well as PS1 and GALEX NUV photometry and
XMM-Newtonspectroscopy allow a detailed study of dramatic changes in a luminous quasar.
Past SDSS-RM measurements of SDSSJ141324+530527 found observed frame time delays between the optical g-band and the Hβ line and i-band continuum emission regions of
;30–50 and;3–6 days, respectively. The measured BLR lag and line width leads to a black hole mass estimate ofM;8×10⁸M☉
(Grier et al.2017). The continuum reverberation timescale implies a propagation speed of0.5cfor a thin accretion disk(Homayouni et al. 2018), consistent with light travel time delay where the optical variability is driven by reprocessed UV or X-ray emission.
We have shown that the source increased in brightness by a factor of 10 within about a year from 2015 to 2016. The variations are coordinated across the optical spectrum, with similar amplitudes at all bands. The SED is peaked toward the blue during thefirst rise, but remarkably turns red at the latest maximum in 2018, with roughly equal luminosity in all observed optical bands.
First, we use the broad emission line response to the changing optical continuum to demonstrate that the changes are due to intrinsic variations in accretion power. Then we assess physical scenarios proposed to account for quasar hypervaria-bility. We consider “extreme reprocessing,” where the entire optical spectrum is driven by reprocessing of a varying central source, and accretion instabilities where the observed changes are caused by rapid evolution of the disk structure.
5.1. Intrinsic Variations in Accretion Power
There are many lines of evidence suggesting that optical changing-look AGNs are powered by intrinsic changes in central engine luminosity, rather than by changes in obscura-tion(as is commonly seen in X-rays, e.g., Risaliti et al.2002; Matt et al.2003; Yang et al.2016). The changes occur over a few years. To cover both the BLR and optical emission region, an obscurer would need both a super-orbital velocity and large covering factor(e.g., LaMassa et al.2015; Runnoe et al.2016). When observed, the mid-infrared luminosity also varies in response to to the changing continuum (Sheng et al. 2017; Stern et al.2018). X-ray data show no sign of an increase in column density associated with dramatic dimming of the continuum(e.g., Husemann et al.2016). Spectro-polarimetry of
“turn off” objects shows the low linear polarization fraction 1% typical of unobscured Type I objects(Hutsemékers et al. 2017).
Here, we also find no evidence for any significant X-ray column in two observations spanning a factor of;4 in luminosity. In addition, the variation of the Balmer and He lines match the expectations of photoionization models (e.g., Korista & Goad 2004). The line widths also show a “breathing” antic-orrelation with optical luminosity compatible with a BLR emission size R∼L1/2 and radial velocity v∼R−1/2. The evolution of the emission lines quantitatively demonstrates that the BLR is responding to intrinsic changes in continuum luminosity. Quasars are typically bluer when brighter(e.g., Cutri et al. 1985; Vanden Berk et al. 2004). If the rest-frame UV luminosity driving photoionization varies more than the optical that we measure, our responsivities could be overestimated. Our best measurements are for the Balmer lines: ;0.3–0.8 (Table2)compared to predicted values ;0.5–0.7 (Korista & Goad2004). It therefore appears likely that the photoionizing flux in the UV is varying in a similar fashion as that of our observed optical bands. From 2013 to 2013, the variability amplitude in theGALEXNUV light curve is similar to that of the quasi-simultaneous optical light curves from PS1. When observed at both high and relatively low states, the X-ray luminosity is also consistent with a constant value of αOX;−1.2.
5.2. Combined Constraints
[image:6.612.47.292.51.422.2]The combined observational constraints from the observed continuum and broad emission line evolution are as follows: Figure 4.Host galaxy subtracted, rest frame, optical to X-ray SEDs. The black
• variations by factors of 10 within1 yr and 3–6 within 4 months in the rest frame that are similar at all optical wavelengths observed(rest 2300–7000Å);
• broad emission line variability responding to the con-tinuum variations both in terms of luminosity and line width;
• measured optical to X-ray SEDs that are typical of quasars with similar variability amplitudes in each band (αOX;−1.2);
• rapid variability across optical bands with blue leading red, implying a propagation speed 0.5c (0.1c) in the 2014 (2015–2018)data;
• an optical color that becomes slightly bluer when brighter during most of the light curve but with a rapid evolution to the red during 2018.
We next evaluate these constraints in terms of physical scenarios invoked for quasar optical (hyper)variability includ-ing changinclud-ing-look AGNs.
5.3. A High Covering Factor“Extreme”Reprocessor?
There has long been evidence for coordinated optical/UV variability in AGNs(e.g., Cutri et al.1985; Clavel et al.1991). The implied propagation speed assuming a thin disk model is 0.1c(e.g., Courvoisier & Clavel 1991; Krolik et al. 1991), which is naturally explained by reprocessing of the central UV or X-ray emission. Typically the amplitude of these variations is ;10%–20%, and the light curves are explained as reprocessing fluctuations superimposed on the more slowly varying local accretion luminosity.
Shappee et al. (2014)considered a geometric reprocessing model in a thin disk with intrinsic accretion luminosity Lacc
irradiated by UV or soft X-ray emission from a central source with luminosity LC21 at a height h above the black hole.
Assuming Newtonian gravity, face-on viewing, and zero albedo, the resulting effective temperature at each radius R
can be written(see also Kazanas & Nayakshin 2001; Cackett et al.2007),
⎛ ⎝
⎜ ⎞
⎠
⎟ ( ( ))
( ) ( )
s
p
t p
= +
-+
T L R
R f
R R
L t R h
h R
3
4 4 , 1
C eff
4 acc in 3
in 2 2 3 2
wheref(x)=1−x−1/2(Shakura & Sunyaev 1973)and ⎡
⎣ ⎢ ⎢
⎛ ⎝
⎜ ⎞⎠⎟ ⎤
⎦ ⎥ ⎥
( ) ( )
t R = h + +
c
R h
1 1 2
2
2 1 2
is the geometric time delay. The time-dependent spectrum is obtained by integrating over the disk:
( )
( ) ( )
ò
n p n
n
=
-n
¥
L h
c
RdR h kT 4
exp 1. 3
R 2 4
2
eff in
For SDSSJ141324+530527, the variability amplitude is a factor of several to ten in the optical. In the model, the light curve consists of contributions both from constant (or slowly varying)local dissipation (Lacc), and from the rapidly varying
central source(LC). To match an optical luminosity of Lopt;
1044–45erg s−1requires a central luminosity ∼1045–46erg s−1, about10×higher than the observed optical luminosity due to geometric dilution of the flux propagating out to the optical emission radius ;50rg. Instead, when observed the NUV
luminosity is similar and the X-ray luminosity is a factor of few below the optical. The SED would therefore need to peak sharply at unobserved wavelengths in the far-UV or very soft X-ray.
Further, the observed variability amplitude in the optical requires that the roughly constant local contribution is negligible: Lacc1044erg s−1. This scenario requires that
1% of the total accretion luminosity of the central source is dissipated farther out in the disk in the optical in this scenario. In most AGNs,LUVandLXare comparable toLopt. Further, the
[image:7.612.70.549.55.279.2]line luminosity evolution tracks that of the optical continuum with responsivities close to those expected for photoionization without any need for a large, unseen far-UV/soft X-ray spectral peak.
Figure 5.Host galaxy subtracted spectra averaged over each observing season. The continuum luminosity and shape change dramatically between years.
21
Here, we are agnostic as to the origin of LC, most likely either EUV
A speculative scenario that could alleviate these problems is reprocessing in a high covering factor shell of material around the quasar. The covering factor would need to be order unity to allowLopt LUV,X~1. Such a scenario has been considered to
explain optical tidal disruptionflares(Guillochon et al.2014; Roth et al. 2016). The reprocessing layer would need to be optically thick to absorb the incident UV or X-ray flux. It would need to be sufficiently thin not to dampen the intrinsic
variability either from photon diffusion or variable light travel time to different regions. We see no evidence for such a reprocessing layer in the X-ray spectrum (low NH consistent
with being unobscured). The X-rays would therefore need to be observed along a low obscuration line of sight, e.g., near the pole. Further, a sudden change in shell radius, thickness, or geometry would still be needed to account for the spectral evolution toward the red seen in 2018.
5.4. Rapid Accretion Disk Evolution?
Alternative models for quasar variability invoke mass accretion (Lyubarskii 1997) and/or thermal (Kelly et al. 2009; Dexter & Agol 2011) fluctuations. Similar ideas have been proposed for changing-look AGNs(Noda & Done2018; Ross et al.2018; Dexter & Begelman 2019), where the large variations result from either disk instabilities or large accretion rate changes. The high-cadence observations of SDSSJ141324 +530527 show blue leading red with a short lag (;3–6 days, Homayouni et al. 2018). At least for the variability in 2014, that behavior would seem to rule out a pure inflow scenario, where the red bands should lead. Disk instabilities are thought to drive repeating outbursts, most clearly in dwarf novae systems (Osaki 1996). Similar limit cycle instabilities have been proposed to explain changing-look quasars (Noda & Done2018; Ross et al.2018;Śniegowska & Czerny2019).
[image:8.612.49.569.55.278.2]A heating front associated with such a cycle (e.g., Menou et al.1999)could drive rapid variability with blue leading red if launched from the inner edge of a geometrically thick disk. That scenario should also predict longer variability timescales for fronts launched at larger radius, and red leading blue if they propagate inwards rather than outwards. Detailed models are needed to explore whether such a scenario can produce large-amplitude variations on timescales of months that are coordinated across the optical band on timescales of a few days. A potential advantage in this scenario is that dramatic reddening of the SED could result from changes to the disk structure(e.g., Neilsen et al.2011). This trend is otherwise the opposite of the prediction of optically thick disk emission, Figure 6.Sample host galaxy and narrow line subtracted Hβ(left panel)and MgII(right panel)profiles from early(red)to blue(late)epochs. The line becomes significantly narrower at late times where the continuum luminosity is higher. The shape also changes, with the core brightening more than the wings.
[image:8.612.47.293.310.595.2]whereL∼Teff4 as seen in the soft states of X-ray binaries(e.g.,
Gierliński & Done2004).
5.5. Contamination by Nonthermal Emission?
SDSSJ141324+530527 was detected by the FIRST survey (Becker et al.1995)at 1.4 GHz with aflux density of;53 mJy and is therefore radio-loud. In someflat spectrum radio quasars, the continuum optical luminosity is up to a factor of several higher than expected from the broad emission line luminosity (Shaw et al. 2012). This could be evidence of significant nonthermal jet emission at optical wavelengths, which, if present here, could complicate our interpretation in terms of accretion physics. Using MgII, wefind that depending on the epoch, the ratio of predicted to observed optical luminosity varies from 1.6 to 0.4. We alsofind clear correlations between the luminosities and widths of multiple emission lines that are fully consistent with photoionization. There is therefore no evidence for nonthermal contamination at any epoch. In addition, flat spectrum radio quasars typically show weak variability in X-rays (rms;30%, Sambruna 1997). Even if
present it is not clear that jet emission would provide a natural explanation for the large-amplitude, quasi-simultaneous optical continuum variability seen here.
5.6. Comparison to Other Changing-look AGNs
The rapid coordinated variability between optical bands favors a reprocessing origin for the entire optical SED. At the same time, a basic reprocessing model of a central source in a thin accretion disk geometry is excluded on energetic grounds. A similar problem occurs in several other changing-look AGNs whereLXLopt(Husemann et al.2016; Ruan et al.2019, but
see Noda & Done2018).
The Seyfert galaxy NGC 2617, studied by also showed short continuum lags with blue leading red as expected for reprocessing Shappee et al.(2014). In that case, the observed
LX was compatible with driving the observed variations in a
[image:9.612.49.571.52.457.2]all bands. As a result, a reprocessing scenario requires central UV/X-rays to drive the entire optical SED. That sets stringent limits on both the outer disk (Lacc<1044erg s−1) and central
(LC∼1046erg s−1)luminosity. Neither possibility is consistent
with observations and we would need a high covering factor reprocessor (sufficiently high to intercept order unity of the central radiation) or some other mechanism to produce rapid, coordinated variability.
The observed variations are continuous over the past 10 yr, with an increase by a factor;2–3 before the“changing-look” event and continuous large-amplitude changes since. We favor the proposal that changing-look quasars represent the high amplitude tail to the distribution of ordinary quasar optical variability (Rumbaugh et al. 2018). The light curve is in this sense quite different from some optical changing-look AGNs in Seyfert galaxies. For example, the UV luminosity of Fairall 9 steadily decreased by a factor of 30 in UV luminosity over a period of 5 yr (Clavel et al.1989). Mrk 1018 remained in the high state with a relatively low optical rms for 10 yr before dropping in luminosity by a factor of 10(McElroy et al.2016). Mrk 590 displays a similar secular evolution while decreasing in luminosity by a factor of 100(Denney et al.2014). It could be that more than one mechanism is required to explain the diversity of changing-look AGNs.
6. Conclusions
We present extensive monitoring data, particularly SDSS optical spectra, from the hypervariable/changing-look quasar SDSSJ141324+530527. Wefind:
• All observed broad emission lines respond to the observed continuum changes. Since the BLR sees the same continuum changes that we do, they are intrinsic to the source. The line response adds to mounting evidence for intrinsic changes in accretion power as the origin of hypervariable and optical changing-look AGNs. The
continuous variability also argues against an origin as a discrete event.
• The observed BLR response is consistent with that predicted by photoionization models. The luminosity of the Balmer and MgIIlines is sub-linear while that of the He lines is nearly linear. The line widths also decrease with increasing luminosity in the fashion expected for a stratified, virialized or rotating BLR. There is no evidence for a change in intrinsic BLR structure or physical properties associated with the changing-look event.
• The continuum evolution poses a challenge to all proposed models. The rapid coordination between optical bands with blue leading red points toward a reprocessing origin, but the large variability amplitudes in all bands would require a high covering factor reprocessor(e.g., not a thin disk). This coordination and the rapid variability timescales of months are challenging for disk instability models. They may remain viable if the instability is launched at the inner edge of a geometrically thick disk.
Future studies can use time-resolved spectral evolution to probe accretion and BLR physics in a sample of hypervariable quasars out to high redshift.
J.D. thanks J.J. Ruan, J.H. Krolik, and R.I. Davies for helpful discussions. J.D. was supported by a Sofja Kovalevs-kaja award from the Alexander von Humboldt foundation. Y.S. acknowledges support from an Alfred P. Sloan Research Fellowship and NSF grant AST-1715579. C.J.G. and W.N.B. acknowledge support from NSF grant AST1517113. P.H. acknowledges support from NSERC grant 2017-05983. K.H. acknowledges support from STFC grant ST/R000824/1.
Funding for the Sloan Digital Sky Survey IV has been provided by the Alfred P. Sloan Foundation, the U.S. Department of Energy Office of Science, and the Participating Institutions. SDSS-IV acknowledges support and resources from the Center for High-Performance Computing at the University of Utah. The SDSS website iswww.sdss.org. SDSS-IV is managed by the Astrophysical Research Con-sortium for the Participating Institutions of the SDSS Collaboration including the Brazilian Participation Group, the Carnegie Institution for Science, Carnegie Mellon University, the Chilean Participation Group, the French Participation Group, Harvard-Smithsonian Center for Astrophysics, Instituto de Astrofísica de Canarias, The Johns Hopkins University, Kavli Institute for the Physics and Mathematics of the Universe (IPMU)/University of Tokyo, the Korean Participation Group, Lawrence Berkeley National Laboratory, Leibniz Institut für Astrophysik Potsdam (AIP), Max-Planck-Institut für Astro-nomie(MPIA Heidelberg), Max-Planck-Institut für Astrophy-sik(MPA Garching), Max-Planck-Institut für Extraterrestrische Physik(MPE), National Astronomical Observatories of China, New Mexico State University, New York University, Uni-versity of Notre Dame, Observatário Nacional/MCTI, The Ohio State University, Pennsylvania State University, Shanghai Astronomical Observatory, United Kingdom Participation Group, Universidad Nacional Autónoma de México, Univer-sity of Arizona, UniverUniver-sity of Colorado Boulder, UniverUniver-sity of Oxford, University of Portsmouth, University of Utah, University of Virginia, University of Washington, University of Wisconsin, Vanderbilt University, and Yale University.
[image:10.612.46.292.51.283.2]Based in part on observations obtained with MegaPrime/ MegaCam, a joint project of CFHT and CEA/DAPNIA, at the Figure 9. Line vs. 2700Årest-frame continuum luminosity for all broad
Canada–France–Hawaii Telescope(CFHT)which is operated by the National Research Council (NRC) of Canada, the Institut National des Sciences de l’Univers of the Centre National de la Recherche Scientifique of France, and the University of Hawaii. The authors wish to recognize and acknowledge the very significant cultural role and reverence that the summit of Maunakea has always had within the indigenous Hawaiian community. We are most fortunate to have the opportunity to conduct observations from this mountain.
Facilities: SDSS, CFHT.
Software:astropy, numpy, matplotlib.
ORCID iDs
Jason Dexter https://orcid.org/0000-0003-3903-0373 Yue Shen https://orcid.org/0000-0003-1659-7035 C. J. Grier https://orcid.org/0000-0001-9920-6057 Teng Liu https://orcid.org/0000-0002-2941-6734 Suvi Gezari https://orcid.org/0000-0003-3703-5154 Ian D. McGreer https://orcid.org/0000-0002-3461-5228 W. N. Brandt https://orcid.org/0000-0002-0167-2453 P. B. Hall https://orcid.org/0000-0002-1763-5825 Keith Horne https://orcid.org/0000-0003-1728-0304 Paul J. Green https://orcid.org/0000-0002-8179-9445 Jonathan R. Trump https://orcid.org/0000-0002-1410-0470 Yasaman Homayouni https://orcid.org/
0000-0002-0957-7151
B. M. Peterson https://orcid.org/0000-0001-6481-5397 K. Kinemuchi https://orcid.org/0000-0001-7908-7724 Kaike Pan https://orcid.org/0000-0002-2835-2556 Dmitry Bizyaev https://orcid.org/0000-0002-3601-133X
References
Alard, C. 2000,A&AS,144, 363
Alard, C., & Lupton, R. H. 1998,ApJ,503, 325
Astropy Collaboration, Robitaille, T. P., Tollerud, E. J., et al. 2013, A&A,
558, A33
Aune, S., Boulade, O., Charlot, X., et al. 2003,Proc. SPIE,4841, 513
Baldwin, J. A. 1977,ApJ,214, 679
Becker, R. H., White, R. L., & Helfand, D. J. 1995,ApJ,450, 559
Blanton, M. R., Bershady, M. A., Abolfathi, B., et al. 2017,AJ,154, 28
Boller, T., Freyberg, M. J., Trümper, J., et al. 2016,A&A,588, A103
Bruce, A., Lawrence, A., MacLeod, C., et al. 2017,MNRAS,467, 1259
Cackett, E. M., & Horne, K. 2006,MNRAS,365, 1180
Cackett, E. M., Horne, K., & Winkler, H. 2007,MNRAS,380, 669
Clavel, J., Reichert, G. A., Alloin, D., et al. 1991,ApJ,366, 64
Clavel, J., Wamsteker, W., & Glass, I. S. 1989,ApJ,337, 236
Cohen, R. D., Rudy, R. J., Puetter, R. C., Ake, T. B., & Foltz, C. B. 1986,ApJ,
311, 135
Collinson, J. S., Ward, M. J., Lawrence, A., et al. 2018,MNRAS,474, 3565
Courvoisier, T., & Clavel, J. 1991, A&A,248, 389
Cutri, R. M., Wisniewski, W. Z., Rieke, G. H., & Lebofsky, M. J. 1985,ApJ,
296, 423
Denney, K. D., De Rosa, G., Croxall, K., et al. 2014,ApJ,796, 134
Dexter, J., & Agol, E. 2011,ApJL,727, L24
Dexter, J., & Begelman, M. C. 2019,MNRAS,483, L17
Edelson, R., Gelbord, J., Cackett, E., et al. 2019,ApJ,870, 123
Fausnaugh, M. M., Denney, K. D., Barth, A. J., et al. 2016,ApJ,821, 56
Fukugita, M., Ichikawa, T., Gunn, J. E., et al. 1996,AJ,111, 1748
Gezari, S., Hung, T., Cenko, S. B., et al. 2017,ApJ,835, 144
Gezari, S., Martin, D. C., Forster, K., et al. 2013,ApJ,766, 60
Gierliński, M., & Done, C. 2004,MNRAS,347, 885
Grier, C. J., Shen, Y., Horne, K., et al. 2019, arXiv:1904.03199
Grier, C. J., Trump, J. R., Shen, Y., et al. 2017,ApJ,851, 21
Guillochon, J., Manukian, H., & Ramirez-Ruiz, E. 2014,ApJ,783, 23
Gunn, J. E., Siegmund, W. A., Mannery, E. J., et al. 2006,AJ,131, 2332
Hinshaw, G., Larson, D., Komatsu, E., et al. 2013,ApJS,208, 19
Homayouni, Y., Trump, J. R., Grier, C. J., et al. 2018,ApJ,880, 126
Husemann, B., Urrutia, T., Tremblay, G. R., et al. 2016,A&A,593, L9
Hutsemékers, D., Agís González, B., Sluse, D., Ramos Almeida, C., & Acosta Pulido, J.-A. 2017,A&A,604, L3
Kazanas, D., & Nayakshin, S. 2001,ApJ,550, 655
Kelly, B. C., Bechtold, J., & Siemiginowska, A. 2009,ApJ,698, 895
Kim, D. C., Yoon, I., & Evans, A. S. 2018,ApJ,861, 51
Koratkar, A. P., & Gaskell, C. M. 1991,ApJL,370, L61
Korista, K. T., & Goad, M. R. 2004,ApJ,606, 749
Kozłowski, S., Kochanek, C. S., Udalski, A., et al. 2010,ApJ,708, 927
Krolik, J. H., Horne, K., Kallman, T. R., et al. 1991,ApJ,371, 541
LaMassa, S. M., Cales, S., Moran, E. C., et al. 2015,ApJ,800, 144
Lawrence, A. 2018,NatAs,2, 102
Lusso, E., Comastri, A., Vignali, C., et al. 2010,A&A,512, A34
Lyubarskii, Y. E. 1997,MNRAS,292, 679
MacLeod, C. L., Green, P. J., Anderson, S. F., et al. 2018,AJ,155, 6
MacLeod, C. L., Ivezić,Ž., Kochanek, C. S., et al. 2010,ApJ,721, 1014
MacLeod, C. L., Ross, N. P., Lawrence, A., et al. 2016,MNRAS,457, 389
Magnier, E. A., Schlafly, E., Finkbeiner, D., et al. 2013,ApJS,205, 20
Matt, G., Guainazzi, M., & Maiolino, R. 2003,MNRAS,342, 422
McElroy, R. E., Husemann, B., Croom, S. M., et al. 2016,A&A,593, L8
McHardy, I. M., Cameron, D. T., Dwelly, T., et al. 2014,MNRAS,444, 1469
Menou, K., Hameury, J.-M., & Stehle, R. 1999,MNRAS,305, 79
Merloni, A., Dwelly, T., Salvato, M., et al. 2015,MNRAS,452, 69
Neilsen, J., Remillard, R. A., & Lee, J. C. 2011,ApJ,737, 69
Noda, H., & Done, C. 2018,MNRAS,480, 3898
Osaki, Y. 1996,PASP,108, 39
Peterson, B. M., Balonek, T. J., Barker, E. S., et al. 1991,ApJ,368, 119
Peterson, B. M., Berlind, P., Bertram, R., et al. 2002,ApJ,581, 197
Pringle, J. E. 1981,ARA&A,19, 137
Risaliti, G., Elvis, M., & Nicastro, F. 2002,ApJ,571, 234
Ross, N. P., Ford, K. E. S., Graham, M., et al. 2018,MNRAS,480, 4468
Roth, N., Kasen, D., Guillochon, J., & Ramirez-Ruiz, E. 2016,ApJ,827, 3
Ruan, J. J., Anderson, S. F., Cales, S. L., et al. 2016,ApJ,826, 188
Ruan, J. J., Anderson, S. F., Eracleous, M., et al. 2019, arXiv:1903.02553
Rumbaugh, N., Shen, Y., Morganson, E., et al. 2018,ApJ,854, 160
Runnoe, J. C., Cales, S., Ruan, J. J., et al. 2016,MNRAS,455, 1691
Sambruna, R. M. 1997,ApJ,487, 536
Schlafly, E. F., Finkbeiner, D. P., Jurić, M., et al. 2012,ApJ,756, 158
Sergeev, S. G., Doroshenko, V. T., Golubinskiy, Y. V., Merkulova, N. I., & Sergeeva, E. A. 2005,ApJ,622, 129
Shakura, N. I., & Sunyaev, R. A. 1973, A&A,24, 337
Shappee, B. J., Prieto, J. L., Grupe, D., et al. 2014,ApJ,788, 48
Shaw, M. S., Romani, R. W., Cotter, G., et al. 2012,ApJ,748, 49
Shen, Y. 2013, BASI,41, 61
Shen, Y., Brandt, W. N., Dawson, K. S., et al. 2015a,ApJS,216, 4
Shen, Y., Greene, J. E., Ho, L. C., et al. 2015b,ApJ,805, 96
Shen, Y., Hall, P. B., Horne, K., et al. 2019,ApJS,241, 34
Shen, Y., Horne, K., Grier, C. J., et al. 2016,ApJ,818, 30
Sheng, Z., Wang, T., Jiang, N., et al. 2017,ApJL,846, L7
Shull, J. M., Stevans, M., & Danforth, C. W. 2012,ApJ,752, 162
Smee, S. A., Gunn, J. E., Uomoto, A., et al. 2013,AJ,146, 32
Śniegowska, M., & Czerny, B. 2019, arXiv:1904.06767
Starkey, D. A., Horne, K., & Villforth, C. 2016,MNRAS,456, 1960
Steffen, A. T., Strateva, I., Brandt, W. N., et al. 2006,AJ,131, 2826
Stern, D., McKernan, B., Graham, M. J., et al. 2018,ApJ,864, 27
Storchi-Bergmann, T., Eracleous, M., Livio, M., et al. 1995,ApJ,443, 617
Sun, M., Trump, J. R., Shen, Y., et al. 2015,ApJ,811, 42
Tohline, J. E., & Osterbrock, D. E. 1976,ApJL,210, L117
Tonry, J. L., Stubbs, C. W., Kilic, M., et al. 2012,ApJ,745, 42
Trakhtenbrot, B., Arcavi, I., MacLeod, C. L., et al. 2019a,ApJ,883, 94
Trakhtenbrot, B., Arcavi, I., Ricci, C., et al. 2019b,NatAs,3, 242
Vanden Berk, D. E., Wilhite, B. C., Kron, R. G., et al. 2004,ApJ,601, 692
Wang, J., Xu, D. W., & Wei, J. Y. 2018,ApJ,858, 49
Wang, S., Shen, Y., Jiang, L., et al. 2019,ApJ,882, 4
Williams, G. G., Olszewski, E., Lesser, M. P., & Burge, J. H. 2004,Proc. SPIE,
5492, 787
Yang, G., Brandt, W. N., Luo, B., et al. 2016,ApJ,831, 145
Yang, Q., Shen, Y., Chen, Y.-C., et al. 2019, arXiv:1904.10912
Yang, Q., Wu, X.-B., Fan, X., et al. 2018,ApJ,862, 109