Maximum Entropy, Parallel Computation and Lotteries
S.J. Cox
Department of Electronics and Computer Science, University of Southampton, UK.
G.J. Daniell Department of Physics and
Astronomy,
University of Southampton, UK.
D.A. Nicole,
Department of Electronics and Computer Science, University of Southampton, UK.
Abstract
By picking unpopular sets of numbers in a lottery, it is possible to increase one’s expectedwinnings. We have used the Maximum Entropy method to estimate the probability of each of the 14
million tickets being chosen by players in the UK National Lottery. We discuss the parallel solution of the
non-linear system of equations on a variety of platforms and give results which indicate the returns
achieved by a syndicate buying a large number of tickets each week.
Keywords: Maximum Entropy, Lottery, Parallel Computation, Commodity Supercomputing.
1
Introduction
In many lotteries the prizes which players win depend on the number of other winners. In the example of the UK National lottery, which we use throughout this paper, players pick 6 numbers from 1 to 49. A similar system operates in many lotteries across the world: the Florida state lottery also allows choice of 6 numbers from 49, whilst in the California State lottery (Superlotto) players pick 6 from 51. For the UK National lottery, 6 main and a bonus number are drawn every Wednesday and Saturday. Players are awarded a fixed £10 prize if they match 3 of the main numbers. The prizes in the other categories depend on the numbers of winners and are typically £62 for a 4-match, £1500 for 5-match, £100 000 for matching 5 of the main numbers and the bonus, while a typical jackpot winner receives around £2000000 [
1
,2
,3
]. The prize fund is made up of 45 pence from every pound ticket bought.In a previous paper [
4
] we applied the Maximum Entropy method to elicit structure in players’ choices of numbers starting from the published numbers of prize winners. We estimated the popularity of each of the 14 million tickets, from which we computed the popularity of individual numbers and pairs of numbers. A crude calculation showed that it is possible to double one’s expected winnings when purchasing a single unpopular ticket.Maximum Entropy method. We discuss the nature of the parallel solution of the resulting set of non-linear equations and give some of the first scientific results using Fortran with MPI on a commodity cluster of DEC Alpha workstations running Windows NT [
5
] in section 3. The new results we present in section 4 show that a syndicate which buys around 75000 tickets per week would benefit from choosing the unpopular numbers which we can identify. We draw our conclusions in section 5.2
Application of Maximum Entropy
We wish to determine the probability of each of the possible 13 983 816 tickets being bought, subject to the constraints that the probabilities are consistent with the numbers of winners observed in the draws so far. The data is available from an independent internet source [
6
]. Jaynes’ Maximum Entropy Principle says that if one is forced to assign probabilities, pi, using limited information, one should do so by maximising the entropy of the distribution:S
p
ip
i i= −
∑
log
, (1)subject to the constraints of known expectation values [
7
]. This Maximum Entropy distribution is “the most conservative assignment in the sense that it does not permit one to draw any conclusions not warranted by the data.” [8
].We use the following notation [4]. Each ticket is denoted by a single index t, which is an abbreviation for six numbers, chosen without repetition, from the set of integers {1, 2, ..., 49}. P(t) is the probability that a player chooses the ticket labelled t. The winning set of numbers drawn in a particular week is denoted by n. Let
=
∆
r(
t
,
n
)
1
0
Otherwise.
If
t
and
n
have
exactly
r
numbers
in
common.
(2)The expected fraction of players matching exactly r numbers, in a week when the winning numbers are indexed by n, is then given by fr(n) where:
∑
∆
=
t r
r
n
t
,
n
P(t
f
(
)
(
)
)
.
(3)
Suppose W lottery draws have been made, then values of f3(n), f4(n), and f5(n) are known for W different values of n: n1, n2, ..., nW. Equation (3) then leads to a set of 3W constraints that apply to the distribution P(t). We assume that P(t) is independent of time and since players make independent samples from P(t), the number of players buying ticket t follows a Poisson distribution with parameter µ(t) = P(t)
× N, when N tickets are sold. We find the maximum entropy estimate of the popularity of each ticket is
$
$
( )
exp
(
)
P t
Z
rt,n
j
r j
j , r
=
1
∑
λ
∆
,
(4)
in which Z, the partition function, normalises the probability distribution:
∑
∑
∆
=
t j , r
j r j
r
t
n
Z
exp
λ
(
,
)
(5)To find the unknown Lagrange multipliers, λr j
, we substitute
P t
$
( )
from (4) into the constraint equations (3). For W draws, the constraint equations define a set of 3W non-linear equations for the Lagrange multipliers, λrj :
f n
Z
(t n
t n
r j r j r
j
r j
j r t
(
)
,
) exp
( ,
)
,
=
∑
∑
1
∆
λ
∆
.
(6)
3
Parallel Computational Method
To solve the non-linear equations defined by (6), we use an iterative technique based on Newton’s method [
9
] in which we supply the analytic Jacobian. The procedure converges in 5- 8 iterations. The equations (6) may be written as:{
,
)
(
)
}
exp
(
,
)
0
,
=
∆
−
∆
=
∑
∑
t jr
j r j r j r j r j
r
(t
n
f
n
t
n
G
λ
, (7)which yields the following explicit elements of the Jacobian:
{
}
∑
∑
∆
−
∆
∆
=
∂
∂
=
t jr
j r j r j r j r i s i s j r i j s
r
(t
n
(t
n
f
n
t
n
G
J
,)
,
(
exp
)
(
)
,
)
,
λ
λ
. (8)Each iteration updates the Lagrange multipliers using
( )
j r i j s r i s is
new
old
J
G
1
)
(
)
(
=
λ
−
−λ
. (9)We have designed an efficient parallel algorithm to solve the system of non-linear equations (7) which consists of two parts:
1. The Jacobian for the system is filled in parallel, by dividing up the sum over t (the 14 million tickets) in (8)between the processors.
The lookup table yields which tickets won prizes in which weeks. For each week of data this table has respectively 246 820, 13 545, and 258 entries from tickets winning 3, 4, and 5 match prizes. To store the lookup table for a few hundred weeks of data requires several hundred Mb of memory.
To illustrate the storage scheme for the partition function, we consider a simple lottery in which three numbers are chosen out of {1, 2, 3, 4, 5}. Prizes are awarded for those tickets matching 2 or 3 numbers. Let the winning numbers drawn be {1,2,3}, {1,3,4}, and {1,4,5}. In this case ticket {1,2,3}, for example, won a 3-match in week 1 and a 2-match in week 2. Its contribution to the partition function (5) is exp(
λ
13+
λ
22). For convenience, each Lagrange multiplier is labelled by a single index: λm =j r
λ
, where m= (r-2)×W + j, where r = 2, …, 3 and j = 1, …, W = 3. The lookup table consists of a counted array of the prizes each ticket has won, labelled by m. The first element for each ticket is the number of prizes the ticket has won, followed by a list of the labels m. For our example ticket, the entries would thus be 2 (the number of prizes won), 4 (3-match in week 1), and 2 (2 match in week 2). To reduce the storage further, it is possible to combine the first two table entries for each ticket into a single number by shifting one of the numbers to the left and adding. This has the advantage that the size of the lookup table is reduced and it grows by a fixed amount as more weeks of data are used. Each processor evaluates the partition function over its set of tickets, and the final result is obtained using a global reduction. The Jacobian matrix is filled in an analogous manner.
0 500 1000 1500 2000 2500 3000 3500 4000
1 2 3 4 5 6 7 8 9 10 11 12 13 14 15 16
Number of Processors
Time (seconds)
IBM SP (Thin1)
IBM SP (Thin2)
[image:5.595.134.479.133.344.2]500 MHz DEC Alpha Cluster
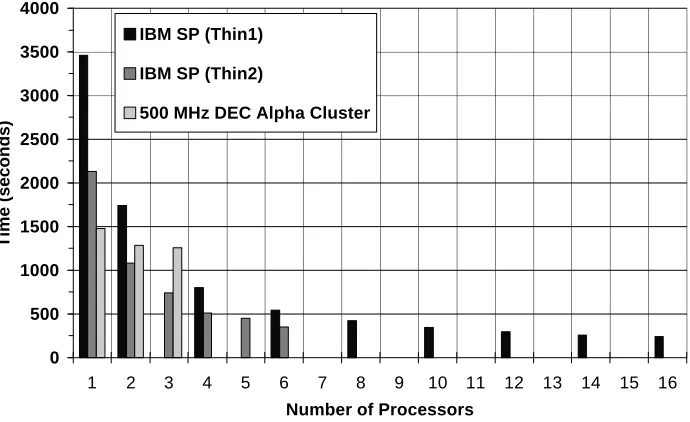
Figure 1 Total processing time for 73 weeks of data on an various machines with parallel construction of the Jacobian matrix and table lookup to calculate the partition function.
Whilst a speedup of 14.5 is derived from using a 16 node machine by a simple parallelisation of the algorithm, it is worth noting that implementation of the lookup table made the code run 17 times faster! Good distributed parallel algorithms should exploit not only the processing power, but also the aggregate memory available on several processors.
We used 6 thin2 SP nodes to compute the Lagrange multipliers for W≥ 100 and used task farming to our 8 node DEC cluster for W < 100. All other calculations, which did not require significant memory resources, were performed using the commodity cluster.
4
Results
In the UK, a number of organisations buy a large number of tickets each week and distribute them for advertising purposes. We have considered a syndicate which buys 75000 tickets each week. If such a syndicate bought tickets at random, then the expected prizes in the various categories would be the average £10 (fixed), £62, £1500, £100 000, and £2 000 000 for matching 3, 4, 5, 5 plus bonus, and 6 numbers respectively.
prizes won over the first 224 weeks of the lottery. In all cases where picking unpopular tickets can increase the prize won, the prizes won are increased by between 36% to 101%.
Jackpot 5 + bonus 5 match 4 match 3 match Maximum Entropy Syndicate Average Prize £3 307 196 £210 821 £2690 £87 £10
Observed Prize £1 946 366 £104 881 £1574 £64 £10
[image:6.595.74.537.185.280.2]% Increase 70 101 71 36 (Fixed)
Table 1 Average Prizes won by syndicate compared with average prizes observed from the lottery data
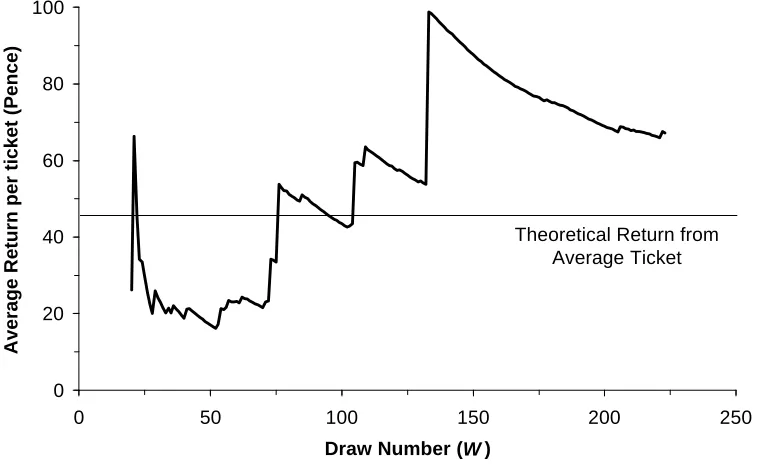
In Figure 2 we show the syndicate’s average return on their total investment as the draws progress. The peaks in the graph occur when the syndicate won 5+bonus prizes (draws 73, 76, 105, 109, 133, 222) or a jackpot prize (draw 133). In total the syndicate spent £15.3 million and won back £10.3 million. This compares with the theoretical £6.9 million expected from buying tickets at random. Our syndicate would have won 50% more money using our Maximum Entropy technique. It is important to note that the chances of winning are unaffected: the additional winnings are only due to picking unpopular sets of winning numbers.
0 20 40 60 80 100
0 50 100 150 200 250
Draw Number (W)
Average Return per ticket (Pence)
Theoretical Return from Average Ticket
[image:6.595.118.499.470.706.2]5
Conclusions
We have applied the Maximum Entropy method to estimate the probability of each ticket being bought in the UK National Lottery using the fraction of winners in the 3, 4, and 5 match categories. The resulting system of non-linear equations were solved using an efficient parallel algorithm on a distributed memory IBM SP and on a commodity cluster of DEC Alpha workstations. We consider a syndicate which buys, in the next draw, the least popular 75000 tickets that we can identify using data from the previous weeks. We find that the average prize in the 4, 5, 5 + bonus match and jackpot category is increased by at least 36%. The overall return is increased by 50% from 45 pence in the pound (buying randomly) to 67 pence. In the future we intend to perform the same calculations for a number of other lotteries.
6
Acknowledgements
We would like to thank Angeli Thomas, Keith Lloyd and John Haigh for useful discussions. We appreciate the efforts of Richard Lloyd in carefully collating the data and placing it in on the internet.
7
References
[
1
] HAIGH, J., 1995. Inferring Gamblers’ Choice of Combinations in the National Lottery. IMA Bulletin. 31, pp. 132- 136.[
2
] HAIGH, J., 1997. The Statistics of the National Lottery. J. R. Statist. Soc. A160, Part 2, pp.187-206. [3
] MOORE, P.G., 1997. The Development of the UK National Lottery: 1992 - 96. J. R. Statist. Soc. A:160, Part 2, pp.169-185.
[
4
] COX, S.J., DANIELL, G.J., and NICOLE, D.A., 1997. Using Maximum Entropy to Double One’s Expected Winnings in the UK National Lottery. Submitted to J. R. Statist. Soc. D.[
5
] COX, S.J., NICOLE, D.A., and TAKEDA, K.J, 1998. Commodity High Performance Computing at Commodity Prices. To appear in WoTUG-21, Proceedings of the 21st World occam and Transputer User Group Technical Meeting.[
6
] Richard Lloyd. Currently: http://lottery.merseyworld.com/[
8
] JAYNES, E.T., 1959. Probability Theory in Engineering and Science, pp. 110-151, USA: Socony Mobil Oil Company.[
9
] PRESS, W.H., TEULKOLSKY S.A., VETTERLING, W.T. and FLANNERY B.R., 1992.Numerical Recipes in FORTRAN 77, 2nd edition. Cambridge: Cambridge University Press. ISBN 052143064X.
[
10
] Anthony Skjellum, Boris Protopopov, Shane Hebert, Peter J. Brennan, and Walter Seefeld. 1997.