Zhulin LI, JianXue HU, Jing Wang, DongXia HE, Member, IAENG
Abstract—Stereo matching with regions is a master method for binocular image matching of wide baseline. It is most difficult that extracting invariant region. Stable extremal region(SER) is proposed in this paper, and its extracting algorithm. To magnify the intensity change and identify its edge easily, the exponent transform has been used. Then, the affine invariant moments of SER and the Euclid-distance between the region and another are computed using in measuring similarity. Finally, the advanced algorithm is analyzed from the repetition rate and the correct match rate with the changing of the viewpoint, scale and illumination. The experiment and analysis result show the extremal points locate accurately, the SER are stable, and correspondence regions are exact, it is improved to 70.9%.
Index Terms—extremal point, exponent transform, extremal region, affine invariant moment
I. INTRODUCTION
T is very important that selecting one kind of matching elementary when image-forming angle and light condition of two images change great in the course of wide baseline based imaging[1-5]. Point characteristic is simple, but it’s property can not be kept in the case of scale changing greater. Line based matching algorithm is difficult to realize because there are no obvious difference features between segment lines and the location of one endpoint of segment line is usually inaccurate. Paper[6] and paper [7] extract interest points by Harris operator, which endue edges to form invariant affine transformation regions such as crossed parallelogram or elliptic. This kind of algorithm depends too great on accuracy of angular point. Paper[7] extracts Harris angular point and line feature to link them forming measuring region, which can be described by Fourier theory. But this method can not be applicable for multi-scale image matching.
T. Tuytelaars and L. Van Gool have proposed a binocular stereo matching algorithm[8] based on luminance ER (ER:
Extremal Region), which seeks luminance extremal points in each ray of light emitted from local high luminance points to construct luminance extremal regions. But the location accuracy of extremal points is often not high, so that the edges of extremal regions are not regular, hence regions should be consummated before matching. Aiming at this problem, this paper adopts exponential transform (I space transform to
e
Ispace) for gray value of local regions to show the difference of gray variation and enhance visual sense influence, which enhances the quality of invariant regions, and increases the veracity and stability of regions, therefore these regions are denominated by SER(SER: Stable Extremal Regions). In the basis of regions, affine invariant moment and Eulerian distance measuring corresponding regions are calculated to match binocular stereo images. The experiment shows that this method can improve precision of corresponding regions to 70.9%.Ⅱ. STABILITY EXTREMAL REGION EXTRACTION
A. Exponential Transform
Suppose the gray value of image local region in I space is
1
,
2, ,
3,
kI I I
L
I
, and the gray value differences betweenk
I
andI
1 are marked by∆ ∆
I
1,
I
2,
L
∆
I
k−1, which inI
e
space aree e e
I1,
I2,
I3,
,
e
IkL
and 11
,
2,
IkI I
e
∆e
∆L
e
∆ −by exponential transform.
I
I
→
e
(1) The effect of exponential transform is to show the difference of gray variation and enhance visual sense influence.B. Advanced Extremal Region Extraction Algorithm
To calculate expediently, this paper uses polar coordinate system whose pole is high luminance point to seek luminance mutation points in 360 directions, and in succession link these points to construct closed region, which is SER. The SER extraction algorithm is described as following:
Step1: Seeking local luminance mutation points
p
i in image, which are denoted by A.Step2: Inverting rectangular coordinate
p x y
( ,
i i)
of A to polar coordinatep
(
ρ θ
i, )
i .2 2
,
arctan( )
y
p
x
y
x
θ
=
+
=
(2)Step3: Establishing reference polar coordinate system whose pole is A. The conversion relationship of
Wide Baseline Stereo Matching Algorithm
Based on Advanced Extremal Regions
Manuscript received July 12 2013; revised Augest 16, 2013. This work was supported by the Education department special fund of Shannxi(2013JK1124), Funds for construction of high level special university in Shaanxi Province (2012SXTS07) and National innovation training project of undergraduate (201210719004).
Zhulin LI is with the Institute of Computer Science, Yan’an University, Yan’an, China ; e-mail: [email protected].
JianXue HU is with the Institute of Computer Science, Yan’an University, Yan’an, China.
Jing Wang is with the Institute of Computer Science, Yan’an University, Yan’an, China.
DongXia HE is with the Institute of Computer Science, Yan’an University, Yan’an, China .
rectangular coordinate system, polar coordinate system and reference polar coordinate system is denoted as:
0 0 0 2 2 0 0 0 k k 0
=(180 -
- )
/180
= (
+r -2
r cos( )
=asin((r sin( )/
)) 180 /
=
-k
β
θ θ π
ρ
ρ
ρ
β
α
β ρ
π
θ θ α
⎧
×
⎪
⎪
×
× ×
⎨
×
×
⎪
⎪
⎩
(3)Step4: According to equation (4), calculating f(k)in each direction of A point-by-point, when
f
of one point is greater than preset threshold, this point is determined as luminance extremal point B.0
[image:2.595.356.484.165.290.2] [image:2.595.47.284.303.384.2] [image:2.595.310.549.622.773.2]0 0
| exp( ( )) exp( ) | ( )
| exp( ( )) exp( ) |
max( , )
k
I k I
f k
I k I dk
k
σ
− =
−
∫
(4)Where
σ
is quite minor positive value to assure denominator being not zero.Step5: Equation(3) converts Cartesian value of extreme
point B to polar coordinate
(
ρ θ
k,
k)
. The invariant region extracted is shown in figure 1.We experiment for Fig 1, the experiment data record as shown in Table 1, where θ expresses with angle.
Ⅲ. BINOCULAR MATCHING ALGORITHM
Similarity metric of regions should be done after stable extremal regions are extracted. Affine invariant moment constructed by Jan Flusser has invariability for affine transform[9] and often uses in target recognition of anamorphosis target. This paper utilizes affine Invariant moment for similarity metric of two images.
A. Affine Invariant Moment
The
p q
+
order moment of given discrete digital imagef x y
( , )
is defined as
( , ) ( , 0,1, 2, )
p q
pq
x y
m =
∑∑
x y f x y p q= L (5) Gray center coordinate of target region is calculated after it’s-order moment is normalized by zero-order moment.10 0 00 10 0 00
( , )
( , )
( , )
( , )
x y x y x y x yxf x y
m
x
m
f x y
yf x y
m
y
m
f x y
=
=
=
=
∑∑
∑∑
∑∑
∑∑
(6)If look gray center as coordinate zero, the moment is named center moment.
0 0
(
) (
p)
q( , )
pq
x y
u
=
∑∑
x x
−
y y
−
f x y
(7)In order not to change with proportion pantograph, center moment should be normalized. Normalization invariant moment is obtained by following equation:
00
pq pq r
u
u
η
=
(8)Where
2
p q
r
=
+
,p q
+ =
2,3,
L
Jan Flusser constructs three groups invariant moment by moment less than three-order.
2 4
1 20 02 11 00
2 2 3 3 2 2 10
2 30 03 30 21 12 03 30 12 21 03 21 12 00
2 2 7
3 20 21 03 12 11 30 03 21 12 02 30 12 21 00
( ) /
( 6 4 4 3 ) /
[ ( ) ( ) ( )] /
J J J
η η η η
η η η η η η η η η η η η η
η η η η η η η η η η η η η η
= −
= − + + −
= − − − + −
(9) A large number of experiments show that affine invariant moment can still attribute images characteristic clearly when images have affine transform, hence affine invariant moment can use in recognizing local regions whose shape (a)Original Image (b)ER extracted by
original algorithm
(c)SER extracted by improved algorithm
Fig. 1. Invariant regions by variant algorithms
TABLE I
EXPERIMENT DATA RECORD FOR THE IMAGE IN FIG 1
(ρ,θ)(10,0) (10,1) (10,2) (10,3) (10,4) (10,8) (10,9) (10,14)
(x,y) (76,91) (76,91) (76,91) (76,90) (76,90) (76,90) (76,89) (76,89)
f(k) 10 10 10 10 10 10 10 10
(ρ,θ) (10,18) (11,19) (11,24) (11,25) (11,31) (12,32) (10,355) (13,359)
(x,y) (76,83) (76,82) (76,82) (75,82) (75,82) (75,81) (76,92) (76,91)
f(k) 13 13 13 13 13 13 10 10
T(f) 12.67
1
1
( ) ( )
N
l
T f f l
N =
=
∑
, is the mean value of f, N is direction number.TABLE Ⅱ
AFFINE INVARIANT MOMENT OF PARTIAL REGIONS IN LEFT AND RIGHT IMAGES L M 1 L ℘ 2 L ℘ 3 L ℘ 4 L ℘ 5 L ℘ 6 L ℘
J1 0.0255 0.0110 0.1222 0.0182 0.0331 2.6101
J2 -1.069e-9 -5.917e-9 -7.750e-6 1.545e-7 -1.401e-5 0.003
J3 -8.955e-6 8.584e-6 -0.012 0.004 -0.002 -0.053
R M 1 R ℘ 2 R ℘ 3 R ℘ 4 R ℘ 5 R ℘ 6 R ℘
J1 1.576 0.011 0.124 0.015 0.033 1.510
J2 0.071 -6.604e-9 -1.355e-5 -2.143e-8 -1.150e-5 0.038
changes. For image experiment of figure2, some data is shown in table2.
B. Similarity Metric
By means of calculating affine invariant moment of invariant regions in left and right images to measure whether these regions are similar. Main steps are following:
Step1: Affine invariant moment of extracted invariant regions in left and right images is calculated by equation (9), which is denoted as
J J J
1Li,
2Li,
3Li , (i=1, 2, 3,...,KL) ,1
,
2,
3R R R
j j j
J
J
J
, (j=1, 2, 3,...,KR), whereK
LandK
Rarethe number of invariant regions extracted in left and right images.
Step2: Calculating Eulerian distance between left and right image regions
℘
iLand℘
Rj. The experiment results of two-view images in figure 2 are shown in table2.2 2 2
1 1 2 2 3 3
(
Rj Li)
(
Rj Li)
(
Rj Li)
d
=
J
−
J
+
J
−
J
+
J
−
J
(10)Step3: Any two regions satisfying
min{ }
d
are similarregion and are marked. (The minimum value is marked by italic in table3.)
The experiment information in table 3 shows that other
matching of regions is right except that
℘
1L↔ ℘
4R is mismatching. So we get the conclusion that mismatching ratio is lower at 14.2%~29.1%. For mismatching ratio is connected with quality of images and the number of SER, So images need be preprocessed.C. Epipolar Geometry Estimation
In order to reject false matching points, this paper adopts RANSAC algorithm whose corresponding point is barycenter of corresponding region, then calculates basic matrix
F
by 8-point algorithm, at last checks matching point-pair not satisfying epipolar geometry restraint by equation(11) for more accuracy.0
=
′
Fu
u
T(11) In equation (11),
F
is basic matrix,u
andu
′
are barycernters of corresponding regions in two-view images.The results of epipolar geometry estimation are shown in figure3.
. ANALYSIS FOR REGION MATCHING Ⅳ
ALGORITHM
The repetition rate and the correct match rate can reflect the advantages or disadvantages of matching algorithm, so we analyze algorithm from the two aspects in this section.
The repetition rate is an important parameter of matching algorithm. It reflects the stability and accuracy of feature extraction algorithm, describe the probabilities of observation point for invariant region in the two images, and can get by computing the rate of the number of actual corresponding regions and the number of invariant corresponding regions extracted for binocular images, with equation (12) representing
1
L
℘
2
L
℘
3
L
℘ 4
L
℘
5
L
℘
6
L
℘
(a) left image added SER
1
R
℘
2
L
℘
3
R
℘ ℘4R
5
R
℘
6
R
℘
[image:3.595.353.514.303.572.2](b) right image added SER
Fig. 2. SER extracted by algorithm of this paper
TABLE Ⅲ
EULERIAN DISTANCE BETWEEN REGIONS BASED ON AFFINE INVARIANT MOMENT
DISTANCE ℘1R ℘2R ℘3R ℘4R ℘5R 6 R ℘
1 L
℘ 82.3051 0.0144 0.0992 0.0002 0.0071 1.4849
2 L
℘ 82.3054 0.0001 0.1136 0.0043 0.0216 1.4994
3 L
℘ 82.2913 0.1118 0.0030 0.1076 0.0903 1.3883
4 L
℘ 82.3090 0.0080 0.1069 0.0045 0.0148 1.4922
5 L
℘ 82.3036 0.0220 0.0915 0.0179 0.0009 1.4773
6 L
℘ 82.2445 2.5995 2.4863 2.5953 2.5780 1.1021
(a) left image added epipolar
(b) right image added epipolar
2
cr
n
n n
η
= ×
′
+
(12)Where nc is the number of corresponding regions, n
and n’ is the number of regions extracted in left and right images respectively.
The correct match rate reflects the accuracy of the algorithm. It may get by equation (13)
100%
c c
c
n
n
η
=
′
×
(13)
Where
n
c′
is the number of correct corresponding regions of binocular images.The following are the analysis results from the viewpoint changes, scale changes and illumination changes.
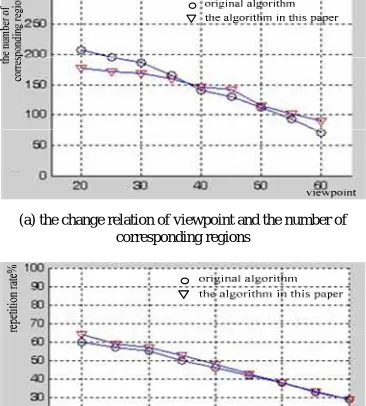
In experiment, each group includes 6 images; the resolution is 800×600. The experimental results see Figure 4, Figure 5 and Figure 6.
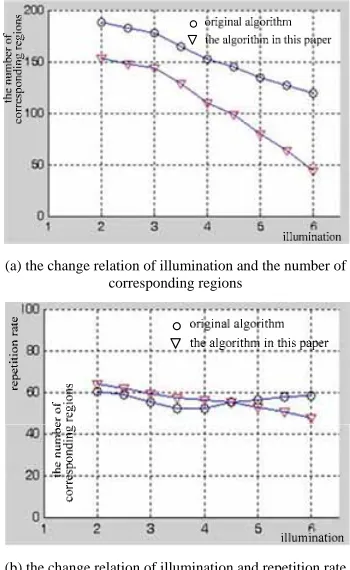
From the experiment the curve can be seen the advanced algorithm improve the performance on the whole, and enhance the adaptability and stability for the viewpoint and scale changing. However, the performance of advanced algorithm decline rapidly when the luminance lowered to a certain degree because of the color information is the one of similarity measurement criterion.
. CONCLUSION Ⅴ
This paper improves the algorithm of Literature [8] (a) the change relation of viewpoint and the number of
corresponding regions
(b) the change relation of viewpoint and repetition rate
(c)the change relation of viewpoint and the number of correct matching regions
[image:4.595.341.523.39.569.2](d) the change relation of viewpoint and correct matching rate
Fig. 4. the comparison curves of the original algorithm and the advanced algorithm in this paper with the viewpoint changing
(a) the change relation of scale and the number of corresponding regions
(b) the change relation of scale and repetition rate
(c) the change relation of scale and the number of correct matching regions
[image:4.595.68.251.254.457.2](d) the change relation of scale and correct matching rate
by means of extracting stable extreme regions and calculates affine invariant moment of SER, finally adopts distance method to realizing similarity metric. The
imitation experiment results show the good effect. (1) The edges of invariant regions are stable and accurate. (2)The algorithm is simple, effective and fast. Its running time is only 0.843s for 350×250 images based on MATLAB7.0.
(3)Matching ratio increases obviously. When the number of regions reaches 50, the accuracy ratio shown in figure 7 can increase from 61.2% to 70.9%.
Regions extracted by this algorithm do not depend on angular points and edges of images and can apply in regions with inconspicuous texture. Before SER are extracted, images should be filtered noise because this method depends more on luminance and luminance alteration of images.
REFERENCES
[1]Steffen Gauglitz,Tobias Höllerer, Matthew Turk. Evaluation of Interest Point Detectors and Feature Descriptors for Visual Tracking[J]. International Journal on Computer Vision, 2011, 94:335-360
[2]Brian P. McKinnon. Point, Line Segment, and Region-Based Stereo Matching for Mobile Robotics[D]. Master degree thesis, University of Manitoba,2009
[3] A. O. Ok, J. D. Wegner, C. Heipke etc. A STEREO LINE MATCHING TECHNIQUE FOR AERIAL IMAGES BASED ON A PAIR-WISE RELATION APPROACH[C]. ISPRS Istanbul Workshop 2010 on Modeling of optical airborne and spaceborne Sensors, 2010.10,11-13 [4] Steffen Gauglitz, Tobias Höllerer, Matthew Turk.. Evaluation of Interest
Point Detectors and Feature Descriptors for Visual Tracking[J]. Int J Comput Vis,2011,94:335-360
[5] Aaron Chavez, David Gustafson. Color-Based Extensions to MSERs[C]. ISVC 2011, Part II, 358–366
[6] T. Tuytelaars and L. Van Gool. Matching Widely Separated Views based on Affine Invariant Regions[J]. International Journal on Computer Vision, 2004,59(1),:61-85
[7] Tell, D. and S. Carlsson. Wide baseline point matching using affine invariants computed from intensity profiles[C]. In Proceedings 6th European Conference Computer Vision, Dublin, Ireland, 2000, 814-828 [8] T. Tuytelaars and L. Van Gool. Wide baseline stereo matching based on
local, affinely invariant regions[C]. In Proceedings of the 11th British Machine Vision Conference, Bristol, UK, 2000,412-425
[9]Jan Flusser, Tomas Suk. Pattern recognition by affine moment invariants[J]. Pattern Recognition, 1993,26(1):167-174
(a) the change relation of illumination and the number of corresponding regions
(b) the change relation of illumination and repetition rate
(c) the change relation of illumination and the number of correct matching regions
[image:5.595.76.251.56.341.2](d) the change relation of illumination and correct matching rate
[image:5.595.314.530.56.188.2]Fig. 6. the comparison curves of the original algorithm and the advanced algorithm in this paper with the illumination changing