Original Article
The clinicopathological significance of ZNF10
in invasive ductal carcinoma of the breast
Jing Duan1*, Tiantian Zhen1*, Jiangtao Liang1*, Jianming Tang1, Yu Zhou1,2, Huabin Gao1, Fenfen Zhang1, Hui Li1, Huijuan Shi1, Anjia Han1
1Department of Pathology, 2Breast Disease Center, The First Affiliated Hospital, Sun Yat-sen University,
Guangzhou, China. *Equal contributors.
Received May 18, 2018; Accepted May 28, 2018; Epub June 1, 2018; Published June 15, 2018
Abstract:The aim of this study was to clarify the clinicopathological features and role of zinc finger protein 10 (ZNF10) in breast invasive ductal cancer (IDC). Our data first showed that ZNF10 expression was higher in 8 pairs of fresh breast IDC and breast cancer cell lines compared with their respective adjacent non-tumor breast tissues. ZNF10 expression was significantly higher in IDC compared with DCIS and fibroadenoma of the breast. ZNF10 ex -pression was significantly associated with patients’ age, tumor stage, and breast cancer molecular subtype. ZNF10 knockdown inhibited breast cancer cell proliferation, colony formation, cell cycle progression, cell migration, and invasion but induced apoptosis. ZNF10 knockdown also suppressed the tumorigenicity of breast cancer in vivo. The underlying mechanism study showed that ZNF10 regulated the β-catenin signaling pathway in breast cancer. ZNF10 might bind to the region (nucleotides -300 to +100) of the β-catenin promoter. In conclusion, our results first suggest that ZNF10 promotes the carcinogenesis and progression of breast IDC via the β-catenin signaling pathway. Targeting ZNF10 might be a novel treatment strategy for breast cancer.
Keywords: ZNF10, β-catenin, breast cancer, carcinogenesis, clinicopathologic significance
Introduction
The catenins (α, β, γ) are composed of a group
of cytoplasmic proteins with common structu- ral and functional features [1]. The interaction between E-cadherin and the catenins is essen-tial for the adhesive function of E-cadherin and
depends largely on β-catenin expression and function. β-catenin associates directly with E-cadherin and through α-catenin with the cel -lular cytoskeleton producing stable cell-cell adhesion [2]. In addition, pro-oncogenic factors including ras, epidermal growth factor, and
c-erbB-2 release β-catenin from the adherens
complex and encourage translocation to the
nucleus. Association of nuclear β-catenin with
the T cell factor/lymphoid enhancer factor fam-ily of transcription factors promotes the expres-sion of several compounds including c-myc, cyclin D1, and matrix metalloproteinase (MMP)-7 that have important roles in the development and progression of colorectal carcinoma [3].
The loss of β-catenin expression is associated
with metastasis and poor prognosis in invasive breast cancer [4].
A conserved sequence is found at the N-ter-
minus of many human zinc finger proteins of
the Krüppel type (C2H2 zinc fingers), referred to
as Krüppel-associated box (KRAB) domain. The KRAB domain consists of ~75 amino acids, that can be further subdivided into an A box and a B box. The A box, but not the B box, is present in every KRAB domain and essential for transcrip-tional repression [5, 6]. KRAB-containing zinc
finger (ZNF) genes constitute the single largest
gene family of transcriptional repressors in the genomes of higher organisms. ZNF121 expres-sion is upregulated in human breast cancer,
and the up-regulation significantly associates
pathway [10]. ZNF10 inhibits HIV-1 LTR activity by interacting with NF-kappaB and Sp1 binding
motifs [11]. Kretschmer et al. identified early
molecular markers in breast cancer by gene
expression profiling analysis [12]. However, the
role of ZNF10 remains unclear in breast cancer. Our current study aims to clarify the
clinico-pathological significance of ZNF10 in breast
IDC.
Materials and methods
Cell lines and small interfering RNA (siRNA) sequences
The human mammary cancer cell lines MCF7, BT549 and MDA-MB-231 were purchased from
ATCC and maintained in Dulbecco’s modified Eagle’s medium (Invitrogen, Carlsbad, CA). All
media were supplemented with 10% (v/v) fetal bovine serum (Invitrogen), 1× antibiotic/antimy-cotic (100 units/mL streptomycin, 100 units/
research purposes of these clinical materials, prior patient consent and approval from the
first affiliated Hospital, Sun Yat-sen University
[image:2.612.90.356.99.438.2]Research Ethics Committee were obtained. No patients had received chemotherapy or radio-therapy before their operations. Pertinent fol-low-up information was available for all patients. Detailed clinical information is summarized in
Table 1.
Immunohistochemical staining
As we previously described [14], the primary antibodies including ZNF10 (Abcam, Cambridge,
MA, USA), β-catenin (Santa Cruz Biotechnology,
Santa Cruz, CA), estrogen receptor (ER), proges-terone receptor (PR), human epidermal growth factor receptor type 2 (HER2) from the Roche Company, and Ki-67 (Dako) were used. The positive signal of ZNF10 was localized in the
cell nucleus. The positive signal of β-catenin
was located in the cell membrane and/or
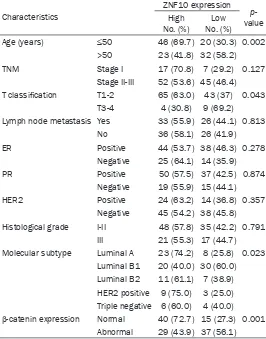
cyto-Table 1. ZNF10 expression and its association with
clinicopath-ological features and β-catenin expression of breast IDC
Characteristics
ZNF10 expression p-value High
No. (%) No. (%)Low
Age (years) ≤50 46 (69.7) 20 (30.3) 0.002
>50 23 (41.8) 32 (58.2)
TNM Stage I 17 (70.8) 7 (29.2) 0.127
Stage II-III 52 (53.6) 45 (46.4) T classification T1-2 65 (63.0) 43 (37) 0.043
T3-4 4 (30.8) 9 (69.2)
Lymph node metastasis Yes 33 (55.9) 26 (44.1) 0.813
No 36 (58.1) 26 (41.9)
ER Positive 44 (53.7) 38 (46.3) 0.278
Negative 25 (64.1) 14 (35.9)
PR Positive 50 (57.5) 37 (42.5) 0.874
Negative 19 (55.9) 15 (44.1)
HER2 Positive 24 (63.2) 14 (36.8) 0.357
Negative 45 (54.2) 38 (45.8) Histological grade I-II 48 (57.8) 35 (42.2) 0.791
III 21 (55.3) 17 (44.7)
Molecular subtype Luminal A 23 (74.2) 8 (25.8) 0.023 Luminal B1 20 (40.0) 30 (60.0) Luminal B2 11 (61.1) 7 (38.9) HER2 positive 9 (75.0) 3 (25.0) Triple negative 6 (60.0) 4 (40.0) β-catenin expression Normal 40 (72.7) 15 (27.3) 0.001
Abnormal 29 (43.9) 37 (56.1)
mL penicillin, and 0.25 mg/mL amphotericin B). All cell lines were
cultured in a humidified incubator
at 37°C with 5% CO2.
ZNF10 siRNA sequences followed:
5’-GGA GAG CAG TTC TTA ACA T dTdT-3’. The siRNA duplexes were
chemically synthesized and
puri-fied by Ribobio Co. Ltd (Guangzhou,
China). The siRNA was transfected using the Lipofectamine RNAiMAX transfection reagent (Invitrogen). Scrambled siRNA (NC-siRNA) was used as a negative control group. Patient information and tissue specimen
Eight pairs of fresh female breast cancer tissues and their respec-tive adjacent non-tumor tissue samples were collected from our institute in 2015, and a total of 121 samples of breast IDC, 14
DCIS and 29 fibroadenoma of the breast paraffin-embedded
archiv-ed tumor tissues were collectarchiv-ed between 2000 and 2009 from
our Institute. All tissues were fixed
plasm. The degree of ZNF10 immunostaining was based on both the proportion of positively stained tumor cells and the intensity of stain-ing. The proportion of positively stained tumor cells was scored as follows: 0 (0-5% positive tumor cells), 1 (>5-25% positive tumor cells), 2 (>25-50% positive tumor cells), 3 (>50-75% positive tumor cells), and 4 (>75% positive
tumor cells). Staining intensity was classified
according to the following criteria: 0 (no stain-ing); 1 (weak staining = light yellow), 2 (moder-ate staining = yellow-brown), and 3 (strong staining = brown). The staining index was calcu-lated as the staining intensity score × the pro-portion score. We evaluated ZNF10 expression in the breast tumor specimens by determining the staining index, which scores as 0, 1, 2, 3, 4, 6, 8, 9, and 12. The staining index score of 2 (the cutoff point) was used to distinguish between low and high expressions of ZNF10.
The expression of β-catenin was evaluated
according to the method established by Dillon
et al. [15]. There are three expression patterns:
1) normal, cases not reproducibly distinguish-able from normal in either pattern or intensity; 2) altered, a broken or discontinuous staining pattern, or a patchy staining pattern with or without a decrease in intensity; and 3) loss, a complete loss of staining as the predominant pattern in the section examined. Altered and
loss of β-catenin staining was considered as abnormal β-catenin expression. The HER2 sta -tus was assessed by immunohistochemistry and the tumors were considered HER2-positive when IHC staining was 3+ (uniform, intense membrane staining of >10% of invasive tumor cells) and 2+ (uniform, weak membrane stain-ing of >10% of invasive tumor cells), in which
the HER2 gene amplification was confirmed by fluorescence in situ hybridization (FISH).
Breast carcinoma molecular subtyping was performed according to the method estab-lished by Goldhirsh et al. (2011) [16] and
classi-fied as 5 subtypes using the expression or amplification of ER, PR, HER2 and Ki-67: lumi -nal A (ER and/or PR-positive/HER2-negative/ low Ki-67), luminal B (ER- and/or PR-positive/ HER2-negative/high Ki-67), HER2-positive lu- minal B (ER- and/or PR-positive/HER2 overex-pression/any Ki-67), non-luminal HER2-positive (ER and PR absent/HER2 overexpression), and triple negative (ER and PR absent/HER2-nega-
tive). The cutoff value for Ki-67 expression is 14% in breast cancer.
Cell proliferation assay
MCF7 and BT549 cells (1×10³) were plated onto 96-well plates with a medium containing 10% FBS and incubated overnight. After trans-fection with 100 nM ZNF10 siRNA, cell prolifer-ation was determined at 0, 24, 48, 72, and 96 hours using the Cell Counting Kit-8 (CCK8) (Keygene, China). The absorbance (OD) was measured at a wavelength of 450 nm using a Microplate Autoreader (Bio-Tek Instruments, VT).
Transwell migration and invasion assays
Migration and invasion assays were carried out in transwell chambers containing
polycarbon-ate filters (8 μm pore size; Corning
Incorpora-ted, Life Sciences, NY). After being transfected with 100 nM ZNF10 siRNA for 48 hours, 2× 10⁴ (migration assay) or 2×10⁵ (invasion assay)
MCF7 and BT549 cells in a 500 μl serum-free
medium, the samples were placed in the upper chambers and incubated at 37°C with 5% CO2 for 24 hours, respectively. At the same time, a
200 μl medium containing 15% FBS was added
to the lower chamber as a chemoattractant. The cells were allowed to invade through the matrigel (BD Biosciences) or migrate for 24 hours at 37°C with 5% CO2. Following invasion
or migration, cells were fixed with 4% formalde -hyde and stained with 1% crystal violet. Cells
on the upper surface of the filters were removed
by wiping with a cotton swab. Cells counts were
the mean number of cells per fields of view.
Three independent experiments were perfor- med and the data were presented as mean ± standard deviation (SD).
Xenograft tumor model
Female BALB/c-nude mice (4-5 weeks old and weighing 15-18 g) were housed under patho-gen-free conditions. MCF7 cells were trypsin-ized, washed twice with a serum-free medium and reconstituted in the serum-free medium DMEM, mixed 1:1 with Matrigel (Becton Dic- kinson) and then inoculated subcutaneously
into the right flank of each nude mouse. A local
assigned into treatment and negative control groups (n=6 mice/group) and given intratumor injections with 2 nM ZNF10 siRNA or NC-siRNA
dissolved in 30 μl PBS every 3 days. We modi
-fied siRNA with 2-O-methyl and conjugated cho -lesterol to the ends of the siRNA, which can retain the full potency of the siRNA, confers substantial nuclease resistance, improves bio-distribution, and facilitates entry into cells. The treatment time was 12 days. Tumor size was measured every 3 days using a digital caliper, and the tumor volume was calculated accord-ing to the formula: tumor volume (mm3) = length × width2 × 0.5. At the end of the experiment, all
the mice were sacrificed and their total weights,
the tumor weights, and the tumor volumes were recorded. All the experiments were per-formed following the Guide for the Care and Use of Laboratory Animals (National Institutes of Health publication).
Statistical analyses
The groups from the cell culture and in vivo experiments were compared using an unpaired,
two-tailed Student’s t test, and the results were presented as mean ± SD. For the CCK8 assay, the comparison was done by univariate vari-ance analysis (two-way ANOVA). Statistical analyses were performed using SPSS version 16.0 statistical software. P<0.05 was
consid-ered to be statistically significant.
Results
ZNF10 expression and its relationship with clinicopathological features and β-catenin ex-pression of breast IDC
To identify the potential markers in breast
cancer, we first analyzed the mRNA expression profiles of patients with IDC, DCIS, and healthy
tissues of the human breast in the Gene Expression Omnibus (GEO) database [12]. We
found ZNF10 mRNA expression was significant -ly higher in breast IDC compared with DCIS and
healthy breast tissues (Figure 1A). Interestingly,
there was a significantly positive correlation between ZNF10 mRNA expression and
β-cat-enin protein expression by TCGA database analysis (P<0.05) (Figure 1B) [13]. To further
determine the ZNF10 and β-catenin expression
levels in breast cancer, our data showed that
ZNF10 and β-catenin expressions were higher
in 8 samples of fresh breast IDC compared with their respective adjacent, non-tumor breast tissues by Western blot analysis (Figure 1C).
Meanwhile, ZNF10 and β-catenin protein
ex-pression was also higher in breast cancer cell lines than in human normal breast tissue (Figure 1D). Further study showed that high ZNF10 expression was found in 42.1% (69/121)
IDC, 3% (5/14) in DCIS and 3.7% (6/29) in fibro -adenoma of the breast. ZNF10 expression was
significantly higher in IDC compared with DCIS and fibroadenoma of the breast (P=0.0012).
Abnormal β-catenin expression was found in 54.5% (66/121) IDC. Normal β-catenin expres -sion was found in 45.5% (55/121) IDC (Figure 1E). ZNF10 expression was significantly associ
-ated with patients’ age (P=0.002), tumor stage (P=0.043), breast cancer molecular subtype (P=0.023), and β-catenin expression (P=0.001).
There was no significant association of ZNF10
expression with TNM, lymph node status, ER, PR, HER2, and histological grade of IDC (Table 1). In addition, there was a negative correlation
between ZNF10 expression and normal
β-cat-enin expression in breast IDC (P=0.001, r= -0.2782). Patients with high ZNF10 expression had a lower survival rate than patients with low ZNF10 expression in breast IDC, although there
was no significant difference (P>0.05, Figure 1F).
ZNF10 knock-down inhibited cell proliferation, colony formation, and cell cycle progression but induced apoptosis of breast cancer
To determine the biological significance of
ZNF10 in breast cancer, ZNF10 expression was
significantly decreased in MCF7 and BT549
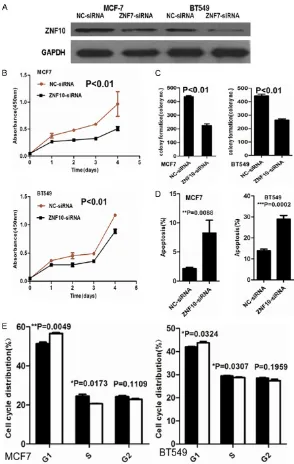
cells transfected with ZNF10 siRNA at 48 hours compared with the control group, respectively (Figure 2A). CCK8 assay showed that ZNF10
knockdown significantly suppressed MCF7 and
BT549 cell proliferation compared with the NC-siRNA control group and in a time-depen-dent manner (P<0.01 and P<0.01), respectively (Figure 2B). Furthermore, a cell colony
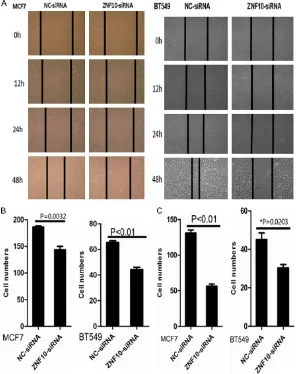
forma-A scratch wound assay showed that cell migra-tion was dramatically inhibited in MCF7 and BT549 cells transfected with ZNF10-siRNA compared with NC-siRNA control groups at 12, 24, and 48 hours, respectively (Figure 3A). Furthermore, a transwell migration assay sho- wed that the mean number (n=143) of migra-
ted cells per field of view was significantly
Figure 2. ZNF10 promotes proliferation and inhibits apoptosis of breast IDC cells. (A) ZNF10 expression decreased in MCF7 and BT549 cell lines transfect-ed with ZNF10 siRNA compartransfect-ed with the control group by Western blot analysis, respectively. (B, C) ZNF10 knockdown significantly suppressed cell proliferation (B) and colony formation (C) in MCF7 and BT549 cells. (D, E) ZNF10 knockdown significantly induced cell apoptosis (D) and cell cycle G-S phase arrest (E) in MCF7 and BT549.
tion assay demonstrated that the mean number (n= 223) of colony formation in MCF7 cells transfected with ZNF10-siRNA was
significantly less than the
mean number (n=436) of colony formation in the NC- siRNA transfection group (P<0.01). Likewise, the mean number (n=263) of colony formation in BT549 transfected with
ZNF10-siRNA was significantly less
than mean number (n=443) of colony formation in NC- siRNA transfection group (P<0.01) (Figure 2C). After 48 hours transfec-tion, the proportion of apo- ptotic cells (5.7%) in MCF- 7 cells transfected with
ZNF10-siRNA was signifi -cantly more than that of apoptotic cells (0.9%) in the control group (P<0.01). The proportion of apoptotic ce- lls (19.5%) in BT549 cells transfected with ZNF10 si-
RNA was significantly high -er compared with 9.6% in the control group (P<0.01). Further cell cycle analysis showed that ZNF10
knock-down significantly induced
G1-S phase arrest in MCF7 and BT549 compared with the control group (P=0.005 and P=0.032), respectively (Figure 2D, 2E).
[image:6.612.90.384.70.534.2]decreased in MCF7 transfected with ZNF10-siRNA than that (mean number =186) in the NC-siRNA control group (P=0.003). The mean
number (n=45) of migrated cells per field of view was significantly decreased in BT549
transfected with ZNF10-siRNA than that (mean number =65) in the NC-siRNA control group (P<0.01) (Figure 3B). A transwell invasion assay showed that the mean number (n=57) of inva-sive cells in the MCF7 cells transfected with
ZNF10-siRNA was significantly less than that
(mean number =132) in the NC-siRNA control group (P<0.01). The mean number (n=31) of invasive cells in the BT549 cells transfected
with ZNF10-siRNA was significantly less than
that (mean number =42) in the NC-siRNA trans-fection group (P=0.02) (Figure 3C).
matically lower than that in enucleated tumors with the NC-siRNA control group by immunohis-tochemical staining (Figure 4).
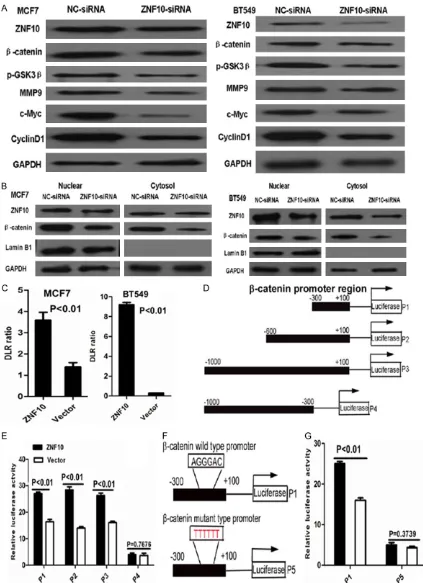
ZNF10 knockdown inhibited β-catenin signal-ing in breast cancer
To determine the effect of ZNF10 on β-catenin
signaling pathway in breast cancer, our data showed that ZNF10 knockdown dramatically
inhibited β-catenin and its down-stream genes
including c-Myc, cyclin D1 and MMP9 and
up-stream gene p-GSK3β (Ser9) expression in
MCF7 and BT549 cells compared with the NC-siRNA control group by Western blot analy-sis, respectively. Further cellular fractionation and Western blot analysis showed that de- Figure 3. ZNF10 promotes migration and invasion of breast IDC cells. (A, B)
ZNF10 knockdown suppressed MCF7 and BT549 cell migration by scratch wound healing assay (A) and cell migration assay (B), respectively. (C) ZNF10 knockdown significantly suppressed MCF7 and BT549 cell invasion by cell inva -sion assay.
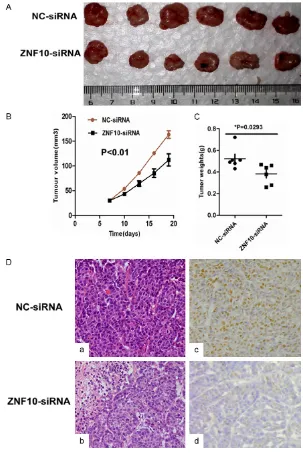
ZNF10 knock-down inhib-ited the tumorigenicity of breast cancer in vivo
To determine whether ZNF- 10 affects the tumorigenic-ity of breast cancer in vi- vo, we performed a tumor growth experiment in nude mice using MCF7 cells.
Tumor growth was signifi -cantly inhibited in the ZNF- 10-siRNA treatment group compared with the control group (P<0.01). The control group exhibited a rapid in- crease in tumor volume over 12 days. However, the ZNF10 siRNA treatment group showed a low incre- ase in tumor volume. Con- comitantly, the average tu- mor weight in the ZNF10 siRNA treatment group was
significantly less than that
[image:7.612.91.387.74.448.2]dra-creased nuclear and cytoplasmic β-catenin
expression was found in MCF7 and BT549 cells transfected with ZNF10 siRNA compared with the control group. Moreover, suppression of
β-catenin expression was much more in cyto -plasmic fraction compared with nuclear frac-tion of MCF7 and BT549 with ZNF10 knock-down, respectively. Further dual-luciferase re- porter assay showed that transcriptional
activ-th activ-the vector control group (P=0.76). Furactiv-ther
study showed that the binding efficiency of ZNF10 with the β-catenin promoter dramatical -ly decreased in 293T cells transfected with
mutant β-catenin promoter sequence TTTTTT compared with the wild β-catenin promoter
[image:8.612.86.389.70.523.2]sequence AGGGAC within nucleotides -300 to +100 by luciferase reporter analysis (Figure 5D-G) .
Figure 4. ZNF10 enhances the tumorigenicity of breast IDC in vivo. (A-C) ZNF10 knockdown significantly suppressed breast cancer growth (A), tumor weight (B), and the tumor volume (C) of MCF7 cells implanted subcutaneously in BALB/c-nu mice compared with the control group, respectively. (D) Histological mor-phology and ZNF10 expression in tumor xenografts generated by MCF7 cells transfected with ZNF10 siRNA compared with NC-siRNA group by hematoxylin and eosin staining (a, b) and immunohistochemistry staining (c, d) ×200.
ity of β-catenin
significant-ly increased in MCF7 and BT549 cells transfected with the ZNF10 expression plasmid compared with the empty vector control group at 48 hours (P<0.01 and P<0.01), respectively ( Fig-ure 5A-C).
ZNF10 regulates β-catenin promoter activity in breast cancer cells
To determine whether ZNF-
10 regulates β-catenin pro -moter activity, serial
frag-ments from the β-catenin
promoter region including nucleotides -300 to +100 (P1), -600 to +100 (P2), -1000 to +100 (P3), -1000 to -300 (P4) were cloned and co-transfected with ZNF10 expression plasmid into 293T cells, and the luciferase activity was
sig-nificantly increased by
ec-topic overexpression of ZNF10 in 293T cells
trans-fected with β-catenin pro -moter fragments including nucleotides -300 to +100 (P1), -600 to +100 (P2), and -1000 to +100 (P3) com-pared with the vector con-trol group (P<0.01, P<0.01, and P<0.01), respectively. However, the luciferase ac-
tivity displayed no signifi -cant difference in 293T ce- lls transfected with nucleo-tides -1000 to -300 (P4)
Discussion
In this study, our data first showed that ZNF10
expression was higher in breast IDC and breast cancer cell lines compared with their respec-tive adjacent non-tumor breast tissues, DCIS
and fibroadenoma of the breast. The result was
concordant with ZNF10 mRNA expression in breast cancer from the GEO database [12]. Further study showed that ZNF10 expression
was significantly associated with patients’ age,
tumor stage, and breast cancer molecular sub-type. Patients with a high ZNF10 expression had less survival than patients with a low ZNF10 expression in breast IDC although there
was no significant difference. This needs fur -ther study in large breast cancer samples. As for the role of ZNF10 in breast cancer, our data showed that ZNF10 knock-down inhibited cell proliferation, colony formation, cell cycle progression, cell migration and invasion but induced the apoptosis of breast cancer. ZNF10 knockdown suppressed the tumorigenicity of breast cancer in vivo. Our results suggest that ZNF10 plays an important role in the carcino-genesis and progression of breast IDC.
Several studies have reported alteration of
β-catenin expression in breast cancer [15, 17,
18]. lncRNA PVT1 promotes KLF5/beta-catenin signaling to drive TNBC tumorigenesis [19]. The
Wnt-β-catenin signaling regulated MRTF-A tran -scription to activate migration-related genes in human breast cancer cells [20]. miR-27a may
activate the Wnt/β-catenin signaling pathway
by negatively regulating SFRP1 to promote the proliferation, migration and invasion of breast cancer cells [21]. Our data showed that
abnor-mal β-catenin expression including altered and
loss staining was found in 54.5% of IDC by immunohistochemical staining. To study
wheth-er ZNF10 regulates the β-catenin signaling
pathway in breast cancer, our data showed that
there was a significantly negative correlation between ZNF10 and β-catenin normal expres -sion in breast IDC. Moreover, ZNF10
knock-down dramatically inhibited β-catenin and its
down-stream genes including c-Myc, cyclin D1
and MMP9, and the up-stream gene p-GSK3β
(Ser9) expression. Further study showed that
ZNF10 regulates β-catenin promoter activity in
breast cancer cells. The association of ZNF10 with gene promoter elements might be cooper-ating with other transcription factors such as
NF-κB through binding to AGGGAC sequence [11]. Our results showed that the binding effi
-ciency of ZNF10 with the β-catenin promoter
dramatically decreased in 293T cells
transfect-ed with mutant β-catenin promoter sequence TTTTTT compared with the wild β-catenin pro -moter sequence AGGGAC within nucleotides -300 to +100 by luciferase reporter analysis. These results indicate that ZNF10 regulates the
β-catenin promoter activity in breast cancer
and ZNF10 might bind to the region
(nucleo-tides -300 to +100) of β-catenin promoter. Nuclear β-catenin is an inducer of
epithelial-mesenchymal transition (EMT) and supports the cancer stem cell phenotype, which pro-motes tumor progression and metastasis.
Diverse targets of β-catenin during the EMT define cancer stem cells and predict disease
relapse [22]. Autophagy is an important factor in the pathobiology of cancer and may offer new possibilities for the development of novel anti-cancer strategies. Autophagy is a signa-ture of a signaling network that maintains hematopoietic stem cells [23]. Fu et al. have reported that resveratrol inhibits breast cancer stem-like cells and induces autophagy via
sup-pressing Wnt/β-catenin signaling pathway [24].
Elevated CRB3 expression suppresses breast
cancer stemness by inhibiting β-catenin signal -ing to restore tamoxifen sensitivity [25]. Whe- ther targeting ZNF10 inhibits breast cancer
stem-like cells and induces autophagy via
β-catenin signaling pathway needs further study. Acknowledgements
This study was supported by the National Natural Science Foundation of China (grant nos. 81472251, 81272636 and 81502021).
Disclosure of conflict of interest
None.
with ZNF10 expression plasmid compared with the empty vector group. D. The schematic diagram depicts different β-catenin promoter regions as indicated by P1, P2, P3, and P4. E. The luciferase activity in 293T cells transfected with ZNF10 expression plasmid and different β-catenin promoter fragments. F. The schematic diagram depicts
β-catenin wild (P1) and mutant type (P5) promoter sequence. G. The binding efficiency of ZNF10 with β-catenin pro
-moter dramatically decreased in 293T cells transfected with mutant β-catenin pro-moter sequence (P5) by luciferase
Address correspondence to: Drs. Anjia Han and Hui- juan Shi, Department of Pathology, The First Affili-ated Hospital, Sun Yat-sen University, 58 Zhong-shan Road II, Guangzhou 510080, China. Tel: +86-20-87332235; Fax: +86-+86-20-87332235; E-mail: ha- nanjia@mail.sysu.edu.cn (AJH); hj_shi@aliyun.com (HJS)
References
[1] McCrea PD, Turck CW, Gumbiner B. A homolog of the armadillo protein in Drosophila (plako-globin) associated with E-cadherin. Science 1991; 254: 1359-61.
[2] Hinck L, Nathke IS, Papkoff J, Nelson WJ. Dy-namics of cadherin/catenin complex forma-tion: novel protein interactions and pathways of complex assembly. J Cell Biol 1994; 125: 1327-40.
[3] Wong NA, Pignatelli M. Beta-catenin--a linchpin in colorectal carcinogenesis? Am J Pathol 2002; 160: 389-401.
[4] Yoshida R, Kimura N, Harada Y, Ohuchi N. The loss of E-cadherin, alpha- and beta-catenin ex-pression is associated with metastasis and poor prognosis in invasive breast cancer. Int J Oncol 2001; 18: 513-20.
[5] Thiesen HJ. Multiple genes encoding zinc fin -ger domains are expressed in human T cells. New Biol 1990; 2: 363-74.
[6] Vissing H, Meyer WK, Aagaard L, Tommerup N, Thiesen HJ. Repression of transcriptional activ-ity by heterologous KRAB domains present in zinc finger proteins. FEBS Lett 1995; 369: 153-7.
[7] Luo A, Zhang X, Fu L, Zhu Z, Dong JT. Zinc finger factor ZNF121 is a MYC-interacting protein functionally affecting MYC and cell prolifera-tion in epithelial cells. J Genet Genomics 2016; 43: 677-685.
[8] Cho JG, Park S, Lim CH, Kim HS, Song SY, Roh TY, Sung J H, Suh W, Ham SJ, Lim KH, Park SG. ZNF224, Kruppel like zinc finger protein, in -duces cell growth and apoptosis-resistance by down-regulation of p21 and p53 via miR-663a. Oncotarget 2016; 7: 31177-90.
[9] Cho JG, Lim KH, Park SG. MED28 increases the colony-forming ability of breast cancer cells by stabilizing the ZNF224 protein upon DNA damage. Oncol Lett 2018; 15: 3147-3154.
[10] Zhang X, Ding C, Tian H, Dong X, Meng X, Zhu W, Liu B, Wang L, Huang M, Li C. ZNF23 sup-presses cutaneous melanoma cell malignancy via mitochondria-dependent pathway. Cell Physiol Biochem 2017; 43: 147-157.
[11] Nishitsuji H, Sawada L, Sugiyama R, Takaku H. ZNF10 inhibits HIV-1 LTR activity through
inter-action with NF-kappaB and Sp1 binding mo-tifs. FEBS Lett 2015; 589: 2019-25.
[12] Kretschmer C, Sterner-Kock A, Siedentopf F, Schoenegg W, Schlag PM, Kemmner W. Identi-fication of early molecular markers for breast cancer. Mol Cancer 2011; 10: 15.
[13] Cancer Genome Atlas Network. Comprehen-sive molecular portraits of human breast tu-mours. Nature 2012; 490: 61-70.
[14] Lian J, Tang J, Shi H, Li H, Zhen T, Xie W, Zhang F, Yang Y, Han A. Positive feedback loop of hep-atoma-derived growth factor and beta-catenin promotes carcinogenesis of colorectal cancer. Oncotarget 2015; 6: 29357-74.
[15] Dillon DA, D’Aquila T, Reynolds AB, Fearon ER, Rimm DL. The expression of p120ctn protein in breast cancer is independent of alpha- and beta-catenin and E-cadherin. Am J Pathol 1998; 152: 75-82.
[16] Goldhirsch A, Wood WC, Coates AS, Gelber RD, Thurlimann B, Senn HJ. Strategies for sub-types--dealing with the diversity of breast can-cer: highlights of the St. Gallen international expert consensus on the primary therapy of early breast cancer 2011. Ann Oncol 2011; 22: 1736-47.
[17] Karayiannakis AJ, Nakopoulou L, Gakiopoulou H, Keramopoulos A, Davaris PS, Pignatelli M. Expression patterns of beta-catenin in in situ and invasive breast cancer. Eur J Surg Oncol 2001; 27: 31-6.
[18] Hashizume R, Koizumi H, Ihara A, Ohta T, Uchikoshi T. Expression of beta-catenin in nor -mal breast tissue and breast carcinoma: a comparative study with epithelial cadherin and alpha-catenin. Histopathology 1996; 29: 139-46.
[19] Tang J, Li Y, Sang Y, Yu B, Lv D, Zhang W, Feng H. LncRNA PVT1 regulates triple-negative breast cancer through KLF5/beta-catenin sig-naling. Oncogene 2018; [Epub ahead of print]. [20] He H, Du F, He Y, Wei Z, Meng C, Xu Y, Zhou H,
Wang N, Luo XG, Ma W, Zhang TC. The Wnt-beta-catenin signaling regulated MRTF-A tran-scription to activate migration-related genes in human breast cancer cells. Oncotarget 2018; 9: 15239-15251.
[21] Kong LY, Xue M, Zhang QC, Su CF. In vivo and in vitro effects of microRNA-27a on proliferation, migration and invasion of breast cancer cells through targeting of SFRP1 gene via Wnt/beta-catenin signaling pathway. Oncotarget 2017; 8: 15507-15519.
[23] Nguyen-McCarty M, Klein PS. Autophagy is a signature of a signaling network that main-tains hematopoietic stem cells. PLoS One 2017; 12: e0177054.
[24] Fu Y, Chang H, Peng X, Bai Q, Yi L, Zhou Y, Zhu J, Mi M. Resveratrol inhibits breast cancer stem-like cells and induces autophagy via sup-pressing Wnt/beta-catenin signaling pathway. PLoS One 2014; 9: e102535.