Abstract— This paper looked at the design of a power saving conveyor system which involves sizing, selection and cost benefit analysis of its installation. This paper focuses on factors that cause high belt power consumption and costs which are high starting torque and more operating hours hence there is design of drive control system consisting of soft starters and variable speed drives to reduce starting torque and load detecting switching system to reduce number of operating hours. The average power savings considering all the factors of reducing the system operating hours to the average of 12 hours a day and drive control system that reduces the starting power were calculated to be 47%. The annual costs of power consumption were reduced from $86212 to $40520 resulting in the payback period after investing to be 8 months. After doing cost benefit analysis it was ascertained that installation, operation and maintenance costs of the designed system are less than that occur on the initial system hence the design is worthy to install since it results in cost savings and increase in system life. The are some recommendations for the designed system which are clean ventilated environment to promote adequate cooling, belt protection against overload to avoid stops and also soft starters , variable speed drives and sensors protection against overvoltage and overcurrent so that the drive control system will not fail.
Index Terms—Design, soft starter, automation, control, conveyor, variable speed drive
I. INTRODUCTION
Conveyor systems are material handling mechanisms that allow quick efficient transportation of material from one point to another. Belt conveyors involve energy conversions from electrical to mechanical energy. The system had a number of benefits which promoted industry such as reducing transportation costs, move loads of all sizes and weights and safety features that prevent accidents. Although the system mentioned advantages it needs further developments such as improving efficiency and reducing energy losses and costs.
Manuscript received March 4, 2016; revised July 23, 2016 This work was supported by the University of Johannesburg.
Tawanda Mushiri is a lecturer at the University of Zimbabwe from March 2013 to date teaching Engineering dynamics and design and is also a PhD student at the University of Johannesburg in the field of fuzzy logic systems and maintenance. Contacted at [email protected] / [email protected]
Charles Mbohwa is currently a Full Professor of Sustainability Engineering and Engineering Management at the University of Johannesburg, South Africa. Contacted at [email protected].
A: BACKGROUND
Most industrial conveyor systems have continuous operation without stopping for the reason of avoiding high power consumption during starting and stoppage of the system. High starting power will result high starting torque and shock loads giving rise to problems of short belt life due to more tension and also leads to more energy costs. In order to reduce these negative effects there should be a power controlling system and design of a belt with good strength qualities.
B. PROBLEM STATEMENT
High power wastage and belt failure due to high starting torque.
C. AIM
Design of an automated power saving industrial conveyor system.
D. PROJECT OBJECTIVES AND JUSTIFICATION 1.OBJECTIVES
Design a system that start the conveyor belt at low power consumption
Increase conveyor system performance in terms of output torque and power
Increase average belt life 2.JUSTIFICATION
This design will have significance for the industry as its goal is to reduce power consumptions thus reducing energy cost. Low power consumption and low starting torque will result in reduction in shock loads and abnormal belt tensions hence the average belt life will be increased. The system will have speed control therefore for any load the speed will be adjusted to its safe speed that matches with its power demanding. The researchers automated the system and this reduces accidents since there will be less human interference.
II. METHODOLOGY
Industrial visit to local industries in Zimbabwe, design and calculations using AutoCAD and Mat lab software are used. A. TECHNICAL SPECIFICATIONS
Belt normal speed v = 500 fpm Belt weight Wb = 17 lbs/ft Belt length L= 2,400 ft
The belt is horizontal hence ( H )lift = 0 Capacity (Q) = 3,400 tonnes per hour Troughing spacing Si = 3 Ft.
Belt width = 48 inches. Ambient temperature = 60°F
Material to be conveyed = iron ore at 150 lbs./cu ft. 10-in. maximum lumps
Drive = lagged and grooved head pulley, 220-degree wrap
Design of a Power Saving Industrial Conveyor
System
Final tensions: Te = 16,342 lbs T2 = 5,720 lbs T1 = 22,062 lbs Tt = 7,032 lbs
Troughing idlers = Class E6, 6-in. diameter, 20-degree angle
Return idlers = rubber-disc type, Class C6, 6-in. diameter, 10 ft. spacing
Cw= 0.35 from table 1
Wm = (33.3Q)÷V =( 33.3×3400)÷500= 226.4 lbs. per ft. For 60°F, Kt = 1.0 as shown in tables 1 and 2.
III. DETAILEDDESIGN
When choosing and dimensioning a motor the relevant parameters of all elements in the chain of energy flow, starting with the actual load, must be determined with relative accuracy. In order to do a proper selection of a motor it is necessary to find an ideal motor for the kinematic task at hand. An undersized motor will fail in continuous duty and an oversized motor causes unnecessary expenses and may run uneconomically.
A. CALCULATION OF MOTOR POWER AND TORQUES
Taking the effective tension in the belt from specifications mentioned in methods section.
Te = LKt(Kx + KyWb + 0.015Wb) + Wm(LKy + H) + Tac Te = 16,342 lbs.
Where:
Kt= ambient temperature correction factor Kx= idler frictional resistance factor Ky=carrying run factor
Wb=weight of the belt Wm=weight of the material
Tac =total tension rom conveyor accessories H = height
Belt HP =
Belt HP = =247.61Hp Drive pulley HP=
Where v is the belt velocity and 33000 is a constant derived from pounds of effective tension.
For calculating horse power for a motor shaft add 5% for speed reduction loss = 0.05(247.61 + 3.03) = 12.53
Horsepower at motor shaft = 263.17 HP then select (select 300 HP, 1,750 rpm, motor)
Motor rated power = 300 HP
From table 2 select nameplate voltage or rated voltage = 415v
Motor current=
Motor current= =392A then take 400A
Foe 415volts motor corresponding full load current =390A (NHP Electrical Engineering Products Pty Ltd, 2013)
(Load Power factor)^2 = =0.67
Load power factor =0.82 Motor
efficiency = =0.97 Efficiency= 97%
Starting power is 180% of motor rated power =540hp Frequency = 60 hertz
Taking number of poles to be p=4
Synchronous speed Nsync= = =1800rpm Rotor speed Nm= 1750rpm
Slip = = =0.0278 S=2.78%
Full load torque = Full load torque =
Starting torque is expressed as percentage of full load torque in this case it is (180% full load torque) (GE Industrial Systems, 1993)
Starting torque=1.8(900) = 1620 lbs per ft.
Break down torque is also expressed as a percentage of full load torque (185% full load torque) (GE Industrial Systems, 1993)
Breakdown torque = (1.85 ×900) = 1665 lbs. per ft. Pull up torque is expressed as a percentage of starting torque since rated power is more than 145hp according to (GE Industrial Systems, 1993) it is taken as (70 % of starting torque)
Pull up torque = (0.7×1620) =1134 lbs. per ft. B. BELT PULLEYS
Drive pulley
Taking the belt with from specifications w=48 inch=1.2 m
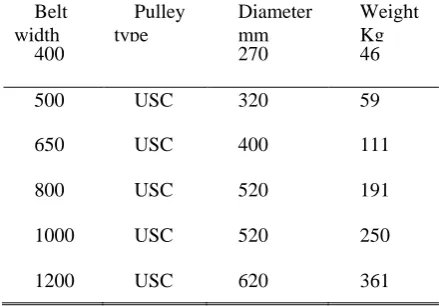
Select USC drive pulley corresponding to belt width from the catalogue
TABLE III: DRIVE PULLEY SELECTION TABLE (RULMICA, 2009)
Belt width
mm
Pulley type
Diameter mm
Weight Kg 400 270 46 500 USC 320 59 650 USC 400 111 800 USC 520 191 1000 USC 520 250 1200 USC 620 361
[image:2.595.334.554.583.736.2]From table above select USC drive pulley of: Diameter =0.62m
Weight =270kg
Idler Pulleys
Taking belt width from specifications w = 1.2m
[image:3.595.69.295.154.264.2]Select USF idler pulleys from the catalogue corresponding to belt width
TABLE IV: IDLER PULLEY SELECTION TABLE (RULMICA, 2009)
Belt width
mm
Pulley type
Diameter Weight
400 USF 190 37 500 USF 270 51 650 USF 320 69 800 USF 400 121 1000 USF 400 153 1200 USF 520 270
From table above selecting USF idler pulleys of: Diameter= 0.52m, Weight=270kg
C. GEAR BOX SELECTION
When selecting a gear box there is need to find reduction ratio
Reduction ratio= The motor input speed = 1750 rpm
Output rpm is found from v=
N= Where D is the effective diameter of the driving pulley =620mm
Effective diameter = 620+24=644mm
Where the 24mm is added to compensate for lagging pulley
v=belt speed =500ft/min=2.54m/s N= =75.32 rpm
Reduction ratio= giving 23:1 Calculating starting time:
Accelerating torque taken from speed torque curve is 180% of full load torque
For drive efficiency of 95% horse power motor shaft to operate a loaded conveyor =263.17hp
Taking from specifications in methodology
Let Force of acceleration of loaded conveyor at belt speed 500fpm be Fa
Fa= [ - ]×0.95
Where:
1. HP is rated power 2. v is belt speed
3. P is actual motor shaft power
4. 1.8 and 0.95are accelerating torque percentage of full load torque and drive efficiency estimation respectively 5. 33000 is a constant derived from pounds of effective
tension
Fa = [ - ]×0.95
Fa =0.95-[300(1.8)-263.17] × Fa=17358N
Total equivalent mass= = 23880 slugs Fa= ma
a= = =0.77ft per sec^2
t= = =11.46seconds The starting time of the system is=11.46 seconds
Calculating starting current Current =
At starting current HP is the value of starting power= 540 HP
Starting current= =705 amps
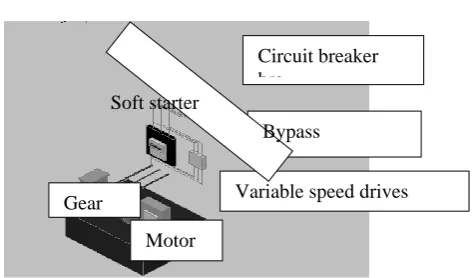
Select soft starter with below features from soft starter selection guide:
Operation voltage = 400-575V AC
Operating current range= 4-1800A
Start time = 1 -225 seconds
Stop time = 0 – 225 seconds
Ambient temperature= 0 -40 degrees Celsius
[image:3.595.313.551.379.518.2] X Design standards ICE 60947-4-2, EN 60947-4-2 (NHP Electrical Engineering Products Pty Ltd, 2013).
Fig. 1. Soft starter components connection to the motor and a gear box
D. VARIABLE SPEED DRIVES Components of variable speed drives:
Rectifier- Converts Ac power to foxed or adjustable dc power
Inverter- produces controllable AC power output at desire voltage and frequency.
Regulator- modifies inverter switching characteristics so that the output frequency can be controlled.
Considerations when selecting a variable speed drive:
Motor type –squirrel cage induction motor
Motor rated HP= 300HP
Torque load Type-constant torque
Starting methods – soft starting
Select a Variable voltage inverter (VVI) of following specifications from adjustable speed drives catalogue (Richard Okrasa, 1997)
Efficiency= 93%
Variable speed drives Bypass
contractor Circuit breaker bre
Motor Gear
box
Rated voltage =380V AC
Rated frequency =60 Hz
Output frequency range= 0.5 Hz to 60Hz
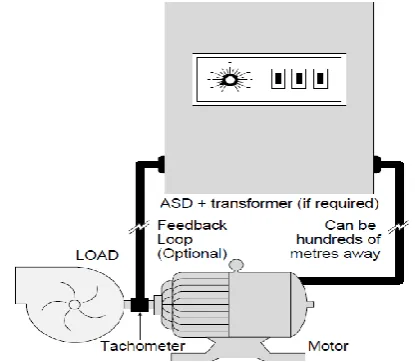
[image:4.595.318.543.51.216.2]The System is being protected against input voltage overload, output overcurrent and motor load
Fig. 2. Variable speed operation in a closed loop control system
E. LOAD DETECTION SWITCHING SYSTEM
The load detection method to be used is through beam mode switching system. It consists of a transmitter and a receiver. A transmitter sends a beam of radiation to the receiver and the load is detected .if the beam between the transmitter and the receiver is interrupted the output of the receiver switches state. In this case when load is placed on the belt it interrupts the beam thus switching on the system. A counting timer is used to set the on time delay in order to avoid stops when the load moves away from sensor detecting range. The timer starts counting when the load is placed on the belt and after the time that the material travels to the end has elapsed it will confirm if the sensor is detecting another load, if there is another load it resets and starts counting again until the sensor detects no load .
Calculate the time moved by the load from loading point to the discharge chute
Time t=
t= ×60
t= 288 seconds take 300seconds
So the counter should count up to 300 seconds ON delaying time
Sensing range
The transmitter and the receiver are placed at loading point across belt width
Belt width= 1.2 m
Take load detecting range to be 2m.
Select Through beam sensor with inbuilt timer on delay 5mins and load detection range 3m.
Fig. 3. Through beam switching system connection to the motor
F. ENERGY SAVINGS Power savings is achieved by:
Reduced operating hours by provision of auto system switching
Reduced starting current ,voltage thus starting power with gradual system acceleration by use of a variable speed drives
G. OPERATING HOURS
The initial systems operate continuously the whole day giving 8760 hours per year
The designed system has average operating hours of hours per day giving 4380 hours per year.
Calculating Operating Annual energy consumption: Annual energy consumption =
Power consumed by belt = 185 kW, Power factor =0.82 already calculated in last chapters
Initial system operating annual energy consumption= =2298983 Kilowatts-hours per year
Designed system operating annual energy consumption= =1149492 kilowatts-hours per year.
The annual operating energy consumption is being reduced by 50%
H. REDUCED STARTING CURRENT AND CONTROLLED ACCELERATION
The starting current at full load will be at minimum of 390A for motor of rated voltage 415V
The soft starter enables the system to start at a minimum current and the variable speed drive accelerates the conditions suitable for the system.
Starting current for the initial system = 705A calculated in later. Corresponding power = 540 HP
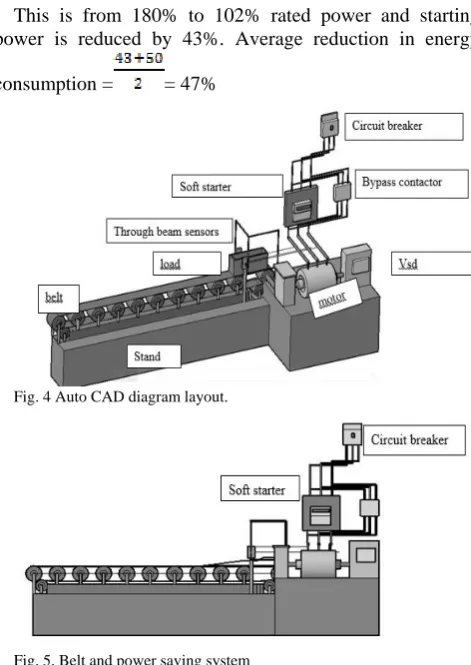
The designed system can start at minimum of 390A Corresponding power = Voltage ×current×1.73×PF Power = 307 HP
[image:4.595.64.272.142.323.2]This is from 180% to 102% rated power and starting power is reduced by 43%. Average reduction in energy consumption = = 47%
Fig. 4 Auto CAD diagram layout.
Fig. 5. Belt and power saving system
I. COST BENEFIT ANALYSIS
Break down cost of the system is calculated and shown in this section. Table V shows the average cost of variable speed drive system which is $ 4500, Soft starter is $4100 and for the through beam mode system is $3000 in US
dollars(NHP Electrical Engineering Products Pty Ltd, 2013).
TABLE V: SYSTEM COMPONENTS VERSUS COSTS.
System Component Costs in US dollars
Soft starter 4100 VSD system 4500 Through beam sensor switch
system
3000 Installation 1000 System protection devices 12600
Total capital cost 25200
The initial average Annual power consumption = 1149492 kilowatt hours
Annual consumption costs in $ = Average annual power consumption ×
According to ZESA Zimbabwe’s average electricity costs =0.075 $/KWh(Zympay, 2014)
Initial system annual consumption costs= 1149492×0.075=$86212
Average savings = 47%
Annual savings = 0.47 ×$86212= $40520 Capital invested =$25200
Payback period = mounths= 8months
TABLE I: WRAP FACTORS (CW) (CEMA, 2006) Type of pulley
drive
Angle of wrap in degrees
Automatic take up bare pulley
Automatic take up lagged pulley
Manual take up bare pulley
Manual take up lagged pulley
Single ,no snub 180 0.84 0.80 1.2 0.8
Single with snub 200 0.72 0.42 1.0 0.7
Single with snub 210 0.66 0.38 1.0 0.7
Single with snub 220 0.62 0.35 0.9 0.6
Single with snub 240 0.54 0.30 0.8 0.6
Dual 380 0,23 0.11 0.5 0.
[image:5.595.40.563.477.564.2]Dual 420 0.18 0.08 _ _
TABLE II: ESTIMATED AVERAGE BELT WEIGHT, MULTIPLE- AND REDUCED-PLY BELTS, LBS/FT (CEMA, 2006)
Belt Width inches (b)
Material Carried, lbs/ft3
30-74 75-129 130-200 18
24 30
3.5 4.5 6.0
4.0 5.5 7.0
4.5 6.0 8.0 36
42 48
9.0 11.0 14.0
10.0 12.0 15.0
12.0 14.0 17.0 54
60 72
16.0 18.0 21.0
17.0 20.0 24.0
19.0 22.0 26.0 84
96
25.0 30,0
30.0 35.0
[image:5.595.177.419.587.782.2]IV. CONCLUSION
The design system components were sized according to standard practice and were capable to meet the objectives of the projects. The project will boost industry with greater profit margins by reducing the power costs and maintenance costs. The system component such as variable speed drives and soft starters requires careful monitoring for protection against overcurrent and overvoltage. From cost benefit analysis the project investment has shorter payback period thus making it more beneficial.
ACKNOWLEDGMENT
I would like to thank my supervisor Professor Mbohwa for support and supervision. University of Johannesburg paid me all my trip and accommodation expenses.
REFERENCES
[1] Anon., 2012. Fabric conveyor system. Habisat America. [2] Cema, 2006. Belt hand book. s.l.:s.n.
[3] E3Jk catalogue, 2012. Built in power supply photoelectric sensor. s.l.:s.n.
[4] GE Industrial Systems, 1993. AC Motor Selection and motor guide. Washington Dc: s.n.
[5] IDEC, 2010. Switching and controls. s.l.:s.n.
[6] Kling, M. k. a. S., 2003. Soft starter hand book.s.l.: ABB automation Technology products AB control.
[7] NHP Electrical Engineering Products Pty Ltd, 2013. Soft starter selection guide. s.l.: NHP NTU SOFT STARTAUSESG 06 13 © Copyright NHP 2013.
[8] Rakesh, V., 2013. DESIGN AND SELECTING THE PROPER CONVEYOR-BELT. Advanced Engineering Technology.
[9] Richard Okrasa, P. H., 1997. Adjustable speed drives reference guide. Toronto: Copyright © 1997 Ontario Hydro.
[10] Rulmica, 2009. Technical information and design criteria for belt conveyors.s.l.:s.n.
[11] Sandvik mining and construction, 2008. Idler design manual. s.l.:s.n. [12] Zhang, S., 2010. Optimum control of operation efficiency of belt
conveyor system. Applied Energy.
[13] Zympay, 2014. www.ziympayadvantage.com.[Online]. [14] Rogerio Ferraz, 2009. Soft starter application guide.
[15] Schneider electric, 2003. Electronic soft starters and variable speed drives.
[16] ABB drives,2011.Guide to variable speed drives [17] Omron electrinics,1999.Photoelectric sensors [18] PEPPERL-FUCHS,2014.Through beam sensors