Did changing ocean circulation destabilize methane hydrate at the Paleocene/
Eocene boundary?
Karen L. Bice
Department of Geology and Geophysics, Woods Hole Oceanographic Institution, Woods Hole, Massachusetts 02543-1541, USA
Jochem Marotzke
School of Ocean and Earth Science, Southampton Oceanography Centre, Southampton, SO14 3ZH, UK (Submitted to Paleoceanography)
Abstract. During the Paleocene-Eocene Thermal Maximum (PETM, ~55 Ma), marine and
terrestrial carbon isotope values exhibit a negative shift of at least 2.5‰, indicative of massive destabilization of marine methane hydrates, releasing ~1100 gigatonnes of methane carbon. The cause of the hydrate destabilization is unknown but has been speculated to be warming due to a change from high-latitude to low-latitude deepwater formation. Here, we present results from a numerical ocean model indicating that a sudden switch of deepwater formation from southern to northern high latitudes caused mid-depth and deep-ocean warming of 3-5°C. The switch is caused by a slow increase in the intensity of the atmospheric hydrologic cycle, as expected under increasing temperatures and consistent with PETM sedimentary evidence. Deepened subduction prior to the thermohaline circulation switch causes warming of 1-4°C in limited areas at
thermocline through upper intermediate depths, which could destabilize methane hydrates gradually and at progressively greater depths. The switch itself occurs abruptly, with up to 5°C warming resulting everywhere in the deep ocean.
1. Introduction
Fifty-five million years ago, the Earth underwent an abrupt climate change known as the Paleocene-Eocene Thermal Maximum (PETM). Against the backdrop of an already warm climate with reduced pole-equator temperature contrasts, intermediate to deep ocean water temperatures and high-latitude surface temperatures increased by 6-8°C over less than 20 kyr [Röhl et al., 2000]. The PETM is characterized by a negative shift of 2.5‰ (PDB) or more in marine carbonateδ13C records [Kennett and Stott, 1991; Thomas and Shackleton, 1996] and of >5‰ in terrestrialδ13C records [Koch et al., 1992]. A feasible explanation for the negative carbon isotope excursion at the PETM is the introduction of 1120 gigatonnes of isotopically depleted (-60‰) carbon to the ocean-atmosphere system [Dickens et al., 1995, 2000; Matsumoto, 1995]. The only known source for this quantity of depleted carbon today are the vast reserves of natural gas hydrate in oceanic sediments and methane gas trapped beneath these deposits
[Kvenvolden, 1998].
The suite of dramatic global changes inferred for the PETM also includes increased aridity in subtropical latitudes and increased high latitude precipitation [Robert and Kennett, 1994; Schmitz et al., 2001]. This pattern is consistent with an increase in the intensity of the global hydrologic cycle, which would be expected with increasing atmospheric CO2 concentration, a change that might have accompanied late Paleocene volcanism [Eldholm and Thomas, 1993; Bralower et al., 1997].
Therefore, it has often been speculated that the oceans might have been characterized by deepwater formation at low latitudes as first suggested by Chamberlin [1906]. Abrupt bottom warming caused by the onset of, or an abrupt increase in this putative low-latitude deepwater source has been invoked as a feature of the PETM [Kennett and Stott, 1991; Kaiho et al., 1996;
Bains et al., 1999], but there has been no evidence from data or from model studies that deep
water originated from low latitudes, rather than from warm high latitudes [Crowley, 1999; Bice
and Marotzke, 2001].
Nonetheless, changing thermohaline circulation is perhaps the most likely mechanism for abrupt, global bottom water temperature change. Zachos et al. [1993] noted that the abrupt and brief PETM event may be integrally related to the gradual late Paleocene-early Eocene global warming trend itself. In other words, the PETM may have occurred because the global climate was gradually warming (with the attendant hydrologic cycle increase believed to accompany global warming) and that some climate system threshold was passed, causing the system to “jump” to a new equilibrium state. Such jumps between different stable equilibria have been noted in coupled models with Quaternary, modern and hypothesized future boundary conditions, both with and without a forcing perturbation [e.g. Manabe and Stouffer, 1988, 1993, 1995;
Rahmstorf and Ganopolski, 1999; Hall and Stouffer, 2001]. The precise nature of such a
threshold response in the latest Paleocene thermohaline circulation has not previously been identified.
Here, we show new ocean model results suggesting that an abrupt switch in deep convection from high southern to high northern latitudes is caused by a gradual strengthening of the
idealized atmospheric hydrologic cycle, a change consistent with a gradually warming climate and PETM sedimentary evidence. Gradual intermediate water warming would have occurred prior to the THC switch due to deepened subduction (downward flow of subtropical surface water into the main thermocline), a process that could have destabilized hydrates locally and progressively deeper in the water column above ~ 1500 m. The switch in THC causes abrupt deep water warming that could be sufficient to destabilize methane hydrate over much of the latest Paleocene ocean.
Bice and Marotzke [2001] describe the subduction response observed in uncoupled ocean
model experiments and examine the sensitivity of the solution to the parameterizations of continental runoff and ocean diapycnal mixing for one early Eocene paleogeographic reconstruction. In this study, we first repeat the experiment of Bice and Marotzke but with atmospheric surface forcings representative of pre-PETM conditions and with a much smaller maximum increase in the intensity of the hydrologic cycle. We then examine the sensitivity of the model thermohaline circulation response to plausible changes in paleogeography around the time of the Paleocene-Eocene boundary.
2. Water Cycle Perturbation Experiments
warming [Manabe, 1996]. In general, then, the hydrologic cycle response to increased
atmospheric carbon dioxide concentration is represented by increased subtropical evaporation and increased high latitude precipitation [Manabe and Bryan, 1985; Manabe, 1996]. In order to examine the possible ocean response to a gradual increase in the strength of the water cycle, we impose this type of change in the moisture flux forcing to an ocean general circulation model.
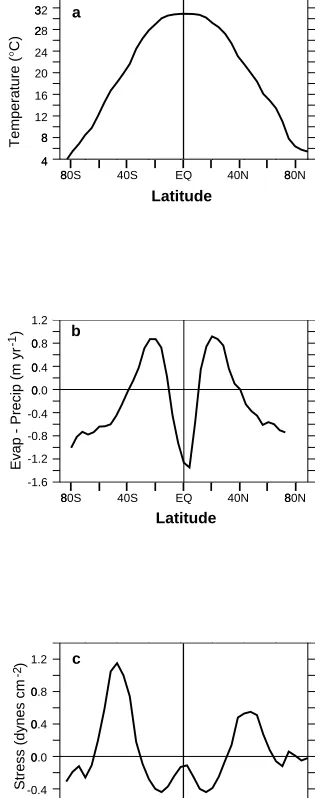
The model and forcing technique are the same as those used by Bice and Marotzke [2001]. The ocean model is the Geophysical Fluid Dynamics Laboratory’s Modular Ocean Model (MOM) version 2.2 [Pacanowski, 1996]. The ocean surface is forced initially with zonally invariant temperature, wind stress and moisture fluxes (evaporation rate minus precipitation rate, E-P) predicted by an atmospheric general circulation model (AGCM), GENESIS v. 2.0
[Thompson and Pollard, 1997] (Figure 1). The model atmospheric composition (CO2 = 645 ppm; CH4 = 16.5 ppm) and poleward heat parameterization (4 times the modern control value) were set in order to produce a qualitatively good match to estimates of latest Paleocene high
80S 40S EQ 40N 80N
80S 40S EQ 40N 80N
80S 40S EQ 40N 80N
1.2
0.8
0.0
0.4
-1.2 -0.8
-1.6 -0.4
1.2
0.8
0.0
0.4
-0.4 32
28
20 24
8 12
4
16
a
b
c
Temperature (
°
C)
Evap - Precip (m yr )
Stress (dynes cm )
Latitude
Latitude
Latitude
-1
[image:3.612.138.298.294.693.2]-2
Figure 1
Bice and Marotzke
latitude sea surface temperatures, just prior to the PETM. The AGCM yields an ocean surface temperature of 11°C at paleolatitude 63°S, a value within the uncertainty in the 13-14°C estimate from the planktonic foraminifera Acarinina at ODP Site 690 below the PETM [Stott et al., 1990;
Thomas and Shackleton, 1996].
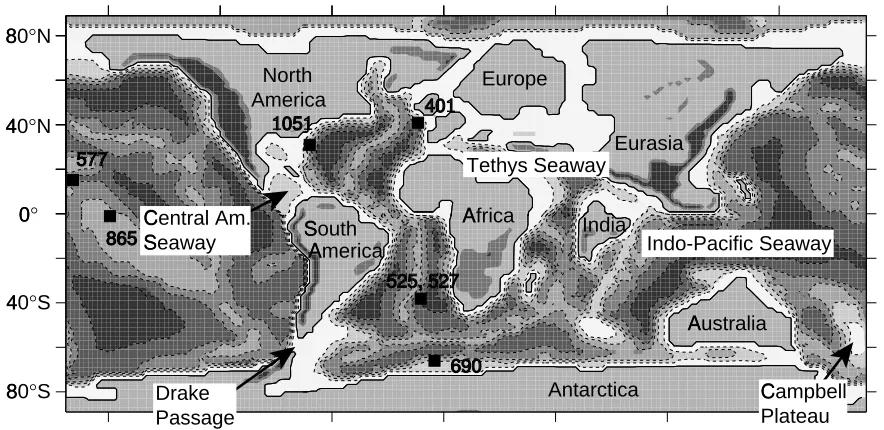
Initially, the basin configuration used is the same as that used by Bice and Marotzke [2001], based on an early Eocene reconstruction by Chris Scotese [Bice et al., 2000a] (Figure 2).
[image:4.612.77.519.369.584.2]Paleobathymetry is based on seafloor age-depth relationship as described by Bice et al. [1998]. Important paleogeography sensitivity tests are presented below. A detailed discussion of the modeling approach, its limitations, and further sensitivity tests are given in Bice and Marotzke [2001].
The ocean model is run for 2700 years to near steady-state with the E-P forcing predicted by the AGCM and corrected to account for continental runoff [Bice and Marotzke, 2001]. The moisture flux is then multiplied, uniformly, by factors increasing from 1.0 to 2.0 in steps of 0.1 every 500 years, representing a simple linear increase in the hydrologic cycle that produces higher evaporative fluxes in the subtropics and higher net precipitation at high latitudes, while maintaining a net zero surface flux. This imposed perturbation of E-P represents the increase in water cycle simulated in coupled models with increased atmospheric CO2, as described in Section 1. Thus, the uncoupled ocean model used here parameterizes one of the most important changes of the coupled system, albeit in a relatively crude form.
80
°N
40
°N
80
°S 40
°S 0
°
690
577
865
1051
525, 527 401
Figure 2.
Bice and Marotzke South
North America
Europe
Eurasia
India Tethys Seaway
Australia
Antarctica
Indo-Pacific Seaway
Campbell
Plateau Drake
Passage Central Am.
Seaway
America
Africa
2.1 Baseline Paleogeography Results
Using the baseline paleogeography (Figure 2), the global circulation is very similar to the control run of Bice and Marotzke [2001], despite cooler polar temperatures, a greater pole-equator temperature gradient, and stronger zonal wind stresses. Deep water is formed in a broad region of the southern hemisphere along the Antarctic margin between Australia and the
Antarctic Peninsula. This bottom water is carried west and northward along bottom topography east of Australia. It flows westward along the New Guinea margin into the eastern Indian Ocean, and is turned southward around Ninetyeast Ridge, Broken Ridge and Kerguelen Plateau, which had paleodepths as shallow as 500-1500 m in the early Paleogene [Driscoll et al., 1989; Peirce et
al., 1989; Quilty, 1992]. Some deep water circulates northward into the deep western Indian
Ocean. Deep water is prevented by topography from flowing directly into the deep Atlantic basins. Instead, it mixes with intermediate water across topography in the Southern Ocean, at Walvis Ridge and in the Equatorial Fracture Zone to fill these deep, silled basins. In the North Pacific, an intermediate (to 1500 m) watermass forms near the Alaskan margin and flows southwestward along the Asian margin. Much of this water is recirculated in the interior of the North Pacific basin; a smaller amount mixes with Southern Ocean water north of New Guinea to contribute to eastern Indian Ocean water.
Although the THC changes very little as E-P factor increases, the mean ocean temperature increases gradually, globally by about 1°C (black curve in Figure 3), with maximum warming (up to 7°C) occurring at between 400-1200 m in the subtropical North Atlantic. As discussed in detail by Bice and Marotzke, thermocline and upper intermediate waters warm from deepened
subduction. Subduction is the process by which warm, relatively saline, subtropical surface
waters are moved downward and spread horizontally along isopycnal (equal density) surfaces into the main thermocline [Luyten et al., 1983; Price, 2001]. As E-P factor increases, small increases (less than 1 psu) in subtropical surface salinities result and cause subduction to carry subtropical water to greater depth, warming the thermocline. This response suggests deepened subduction as a plausible mechanism for mid-water warming and consequent methane release, but the magnitude of the subduction-induced warming is too small by itself to account for PETM bottom water warming at sites with intermediate paleodepths (sites 401, 690 and 1051, Table 1).
2.2. Sensitivity to the North Atlantic Basin Configuration
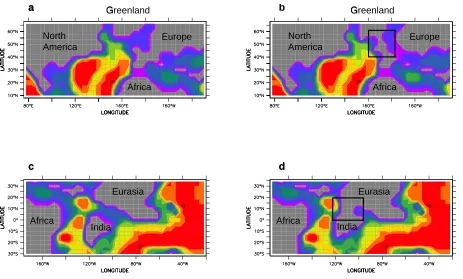
We now examine the sensitivity of the ocean response to this hydrologic cycle increase taking into consideration uncertainty in the precise paleogeographic reconstruction. To do this, the moisture flux perturbation experiment is repeated with three additional global ocean configurations, specifying either or both of the following changes: (a) North Atlantic basin modified to represent uplift and island construction associated with North Atlantic Volcanic Province magmatism and heat flow (Figure 4a, b), and (b) closed low latitude gateway with the earliest collision of western India and Eurasia (Figure 4 c, d). These changes represent plausible geographic configurations during the late Paleocene-early Eocene interval [Eldholm and
Thomas, 1993; Ritchie and Hitchen, 1996; Beck et al., 1998; Knox, 1998]. Of particular
1998]. Additionally, there is evidence to support the existence of a North Atlantic land bridge as a high latitude corridor for mammal migration from Europe to North America via Greenland at the Paleocene-Eocene boundary [Knox, 1998; Tiffney, 1998]. In fact, the appearance of many mammal orders in North America by migration across this bridge and a possible Bering land bridge occurs precisely coincident with the terrestrial record of the PETM [Koch et al., 1995;
Maas et al., 1995]. We will use the shorthand “Brito-Arctic bridge” to refer to a plausible barrier
to flow in the North Sea region associated with magmatism and high heat flow activity of the Iceland Plume in the latest Paleocene.
All three sensitivity experiments exhibit thermocline and upper intermediate water warming due to deepened subduction. However, when a Brito-Arctic bridge is specified in the North Atlantic basin, with India-Eurasia either open or closed, the THC undergoes an abrupt switch from dominant southern hemisphere sinking to northern hemisphere (Pacific) sinking at a factor of 1.6 x (E-P). Northern hemisphere overturning increases abruptly from 20 Sv to 45 Sv (Figure 5a), with what had been intermediate depth convection near the Alaskan margin deepening abruptly to 5200 meters. Bottom water formation abruptly decreases along the Antarctic margin region, but intermediate depth (~1200 m) convection continues in a small area to the west of the Antarctic Peninsula. Southern hemisphere THC strength decreases from 60 Sv to 12 Sv (Figure 5b). This switch in THC produces 3-5°C warming in the deep ocean. Prior to the switch, 11-12°C surface water convected at 74-80°S in the Pacific sector Southern Ocean. Bottom water warming occurs with the switch to convection of 15-16°C surface water at ~66°N on the Alaskan margin. The global mean ocean temperature increases by 3°C over several thousand years.
[image:6.612.201.447.67.245.2]The abrupt switch in THC occurs because North Pacific upper ocean salinities gradually increase, despite that fact that the stronger atmospheric water cycle causes more net precipitation at high latitudes. The primary mechanism for maintaining surface salinities in the northern North Pacific is increased transport of saline subtropical North Atlantic thermocline water through the Central American Seaway into the North Pacific basin. With the creation of a Brito-Arctic
Figure 3
Bice and Marotzke Year (10 )3
Temperature (
°
C)
0
2 4 6
8
10 15
16 17 18 19
bridge, low salinity North Sea water, which otherwise was introduced directly into the North Atlantic, is instead diverted south and eastward into the northern Tethyan basin. This allows moderately higher-salinity water to develop in the North Atlantic subtropics, which is transported southward and westward into the Pacific. There, much of it is entrained in the subtropical gyre and transported to the high-latitude North Pacific. The intermediate water sinking in the northern hemisphere is therefore not diminished as E-P increases from 1.0 to 1.5 x (E-P). It is instead maintained, and North Pacific salinity slowly increases, by less than 0.2 psu (Figure 6), until finally a switch to northern hemisphere sinking occurs at a 60% increase in E-P. Bottom water now formed in the North Pacific fills deep basins north and east of the Emperor-Hawaiian seamount chain and topography associated with the Pacific Superswell. It also flows west and southwestward as a deep Asian boundary current and turns westward through the Indonesian passage, into the eastern Indian Ocean basin.
3. Proposed Feedback for the Paleocene-Eocene Thermal Maximum
[image:7.612.75.538.68.347.2]The abrupt nature of the PETM bottom warming has long been interpreted as indicative of a THC switch, but the switch has been hypothesized to be from high southern latitude sinking to subtropical sinking [Kennett and Stott, 1991]. Our results suggest that the abrupt warming may instead have resulted from a switch from high southern to high northern latitude sinking at some critical point in the strength of the hydrologic cycle. This south-north switch in thermohaline circulation may therefore represent the “threshold” ocean response invoked for the PETM [Kennett and Stott, 1991; Zachos et al. 1993; Dickens et al., 1995].
Figure 4
Bice and Marotzke
a
b
c
d
North America
Eurasia
Europe
Africa India
Greenland
North America
Eurasia
Europe
Africa
India
Greenland
Africa Africa
Figure 5
Bice and Marotzke Year (10 )
3
0 2 4 6 8 10
Year (10 )3
0 2 4 6 8 10
0 20 40 60 80 0 10 20 30 40 50
NH Overturning (Sv)
SH Overturning (Sv)
a
b
[image:8.612.217.429.522.672.2]
Figure 5. Time series of the maximum meridional overturning strength (Sverdrups) for (a) northern hemisphere and (b) southern hemisphere. Colors are as indicated for Figure 3.
Figure 6
Bice and Marotzke Year (10 )3
Salinity (psu)
0 2 4 6 8 10
32.8 33.6 34.4 35.2 36.0
THC switch
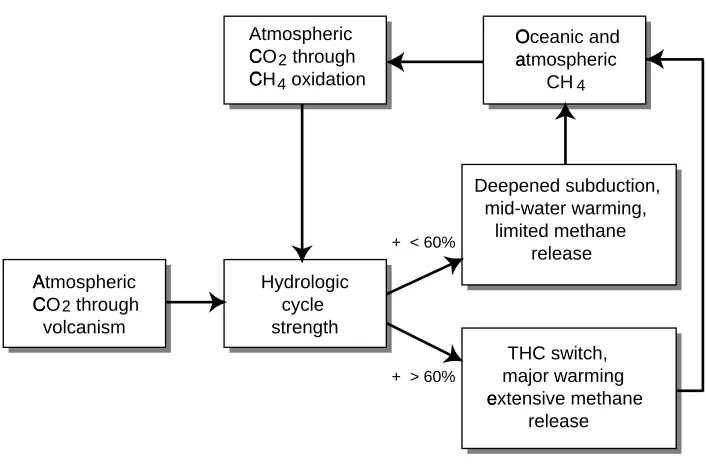
We propose a positive feedback (Figure 7) in which an increase in the strength of the hydrologic cycle (perhaps initiated by volcanic outgassing of CO2) leads first to subduction warming at intermediate depths and spatially limited thermal hydrate destabilization. Some part of the methane thus released is oxidized to CO2 in either the ocean or atmosphere [Dickens, 2000]. Increased atmospheric concentrations of CO2 (and plausibly methane) further amplify the warming and hydrologic cycle increase, eventually causing an abrupt switch to sinking in the warmer northern hemisphere. The resulting widespread, abrupt bottom warming would plausibly result in widespread methane hydrate destabilization. This sequence would allow for sequential, or pulsed, injections of methane carbon, consistent with observations in high resolution records [Bains et al., 1999; Röhl et al., 2000], but the chain of events is also self-limiting with regard to methane release: the widespread destabilization caused by abrupt deep-ocean warming at the THC switch could occur only once, until sufficient time had passed for the regeneration of extensive methane hydrate and gas reserves.
4. Model-Data Temperature Comparisons
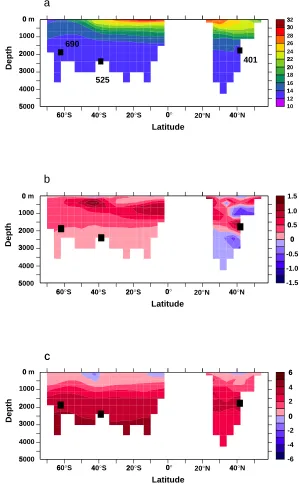
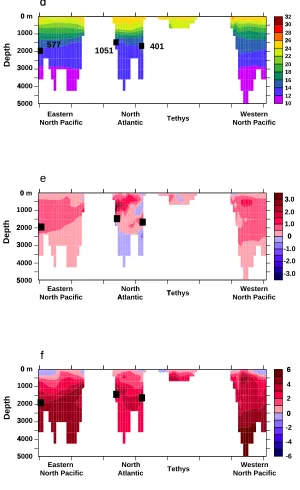
The unperturbed (pre-PETM) temperatures and predicted temperature change are shown in Figure 8 for two north-south and west-east vertical sections through all ocean basins. Figures 8a and 8d show the model-predicted temperatures for the control E-P case (“pre-PETM”). Nearby deep sea sites from which paleotemperature estimates are available (Table 1) are projected onto the sections. Figures 8b and 8e illustrate the warming between the control P case and 1.5 x E-P, just prior to the THC switch. Figures 8c and 8f show the temperature difference between the control E-P case and 1.6 x E-P, after the THC switch has occurred and the ocean model has approached a new steady-state.
Deepened subduction, mid-water warming, limited methane release
THC switch, major warming extensive methane
release Atmospheric
CO through
volcanism
2
Oceanic and
atmospheric
CH 4
Atmospheric CO through
CH oxidation
2 4
Hydrologic cycle strength
+ < 60%
[image:9.612.116.469.289.521.2]+ > 60%
Figure 7
Bice and Marotzke
0 m 3000 4000 1000 2000 5000 ! Depth 60 "
°S 0
° 20°N
40
#
°S 20°S #40
°N Latitude 1.5 -0.5 0 0.5 1.0 -1.5 -1.0 0 m 3000 4000 1000 2000 5000 ! Depth 60 "
°S 0
° 20°N
40
#
°S 20°S #40
°N Latitude 6 " -2 0 2 4 -6 -4 0 m 3000 4000 1000 2000 5000 ! Depth 60 "
°S 0
° 20°N
40
#
°S 20°S #40
[image:10.612.137.436.86.580.2]°N Latitude 32 $ 16 20 % 24 28 12 30 $ 14 & 18 22 % 26 10 690 401 525 Figure 8
Bice and Marotzke a
b
c
'
0 m 3000 4000 1000 2000 5000 ! Depth 3.0 -1.0 0 1.0 2.0 -3.0 -2.0 0 m 3000 4000 # 1000 2000 5000 ! Depth 6 " -2 0 2 4 -6 -4 0 m 3000 4000 # 1000 2000 5000 ! Depth 32 $ 16 & 20 24 % 28 12 30 $ 14 & 18 & 22 26 % 10 & Eastern North Pacific Western North Pacific North Atlantic Tethys Eastern North Pacific Western North Pacific North Atlantic ( Tethys ) Eastern North Pacific Western North Pacific North Atlantic Tethys
577 1051 401
Figure 8 (continued) Bice and Marotzke d
*
e
f
+
[image:11.612.138.438.85.575.2]One way to assess the validity of the predicted THC switch at the P/E boundary is to compare the model-predicted temperatures and temperature change against pre-PETM and PETM data. Unfortunately, there are very few localities from which both pre-PETM and peak PETM data are available, a result primarily of widespread dissolution of carbonate and hiatuses at the PETM [Thomas, 1998]. At those sites where sufficient carbonate material remains to allow recognition of the carbon isotope event, the size of the PETM excursion as expressed in the geochemistry of foraminifera is often truncated, allowing only a minimum temperature change to be inferred fromδ18O. The sites from which benthic foraminiferalδ18O measurements of pre-PETM and pre-PETM (or immediately post-pre-PETM) specimens are known are listed in Table 1. In order to have a somewhat larger dataset for comparison, data from DSDP Sites 401 and 577 are included, however the peak PETM is missing in benthic records from these sites (see Table 1 footnote). Peak PETM changes are well-pronounced at Site 1051, but there is evidence for an unconformity immediately prior to and at the onset of the PETM [Röhl et al., 2000].
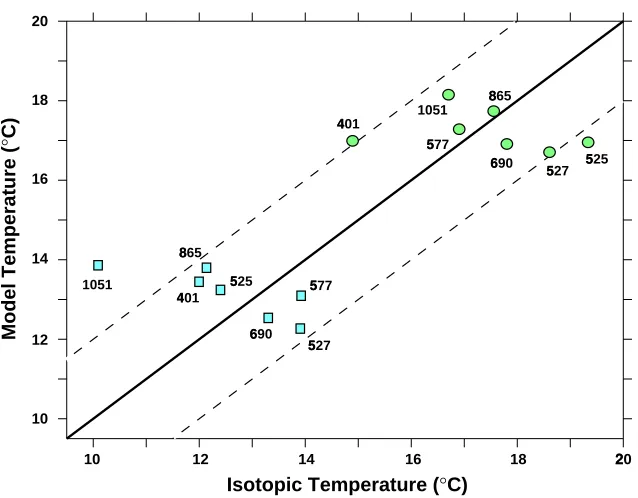
In terms of absolute temperatures, the model matches the inferred pre-PETM temperatures to within 2°C at all sites except Blake Nose Site 1051 (Figure 9). The model temperatures are therefore correct to within the estimated uncertainty in the Erez and Luz [1982] isotopic paleotemperature calculation [Bice et al., 2000b]. The reason for the ~4°C model mismatch at 1500 m on Blake Nose is not obvious. Given the good match between the model and North Atlantic data farther north, at Site 401, one possibility is that the model underestimates the volume transport of cooler South Atlantic water into the North Atlantic basin across the
[image:12.612.117.436.412.661.2]Equatorial Fracture Zone region. However, the possibility of burial diagenesis can not be ruled out for Site 1051 PETM samples, given the current burial depth (512 m, Table 1) and post-Eocene erosion on Blake Nose [Norris et al., 1998].
Figure 9
Bice and Marotzke
10 12 14 16 18 ,20
10 12 14 16 18 20
401
-527
.
1051
577
.
690
/
865
0
525
.
527
.
577
.
690
/
865
0
1051
401
-525
.
Model Temperature (
°
C)
Isotopic Temperature (°C)
The pre-PETM to PETM data show that the magnitude of the change in water temperature inferred fromδ18O is similar to that simulated by the model at these sites when the THC switch occurs (Table 1). At 5 of the 7 sites, the temperature change predicted by the model is within 1.5°C of the temperature change inferred fromδ18O, assuming no change in water oxygen isotopic composition at the PETM. The model under-predicts the temperature change at Sites 525 and 1051 by 3.3° and 2.4°C, respectively.
5. Predictions of the Hypothesis
In addition to the magnitude of temperature change, the proposed feedback mechanism suggested by the model results has a number of features that should be testable, if high temporal resolution (generally < 5 kyr) and depth-stratified marine isotopic data are obtained. We offer the following general predictions:
(1) Gradual surface warming would accompany (and drive) an increase in the hydrologic cycle. Next, thermocline and upper intermediate depths will warm gradually in some areas due to deepened subduction. Finally, abyssal waters warm abruptly everywhere due to the THC switch. Deepened subduction alone is unlikely to cause deep water warming. The PETM and interval immediately preceding it should therefore exhibit a largely “top-down” warming. Röhl et al. [2000] interpret the high resolution record from Site 1051 as indicating both gradual and catastrophic inputs of isotopically depleted carbon to the ocean system. This is consistent with our prediction of two mechanisms for hydrate destabilization, operating on different time scales.
(2) Though local warming (at any depth) would precede the thermal destabilization of hydrate at that site, subduction warming is not uniform and the distribution of hydrates is not likely to have been global. At sites with no methane destabilization, carbonateδ18O values may decrease (indicating warming) prior to a decrease inδ13C. Similarly, because of watermass transport and mixing, methane release in one locality could produce aδ13C decrease at a site that has not yet experienced warming. Therefore, a decrease inδ13C that precedes evidence of warming at the same site is not necessarily evidence against the methane hydrate hypothesis [Dickens et al., 1995]. The temporal resolution necessary to observe such leads and lags is likely to be on the order of thousands of years, requiring high resolution sampling in areas of high sedimentation rate.
(3) Prior to the massive input of light carbon at the PETM, destabilization of hydrates due to deepened subduction would have occurred at progressively greater depths. This progressive response could have been smooth or pulsed, depending on the true rate of change in atmospheric moisture transports and the location of significant clathrate reservoirs relative to regions of maximum warming. Bains et al. [1999] and Röhl et al. [2000] describe records from Blake Nose Site 1051 that are consistent with a pulsed release of methane carbon prior to the massive global carbon isotope excursion. Regarding a progressively deepening response, it may be unclear even from high resolution, depth-stratified geochemical records if destabilization occurred at
progressively deeper water depths, because aδ13C signal input at a given depth could presumably have been propagated up or down the water column, depending on local mixing conditions.
the PETM record than does release in other oceans. Evidence of PETM calcium carbonate dissolution (assumed to be an indicator of decreased local carbonate ion concentration due to CH4 oxidation) is apparently most pronounced in the Atlantic ocean [Thomas, 1998], further supporting the idea that extensive methane release occurred in the Atlantic [Katz et al., 1999].
(5) The THC should return to Southern Hemisphere deep water formation as radiative gases input to the atmosphere before and during the PETM are removed by long- and short-term carbon cycle processes [Bains et al., 2000; Beerling, 2000; Ravizza et al., 2001]. When we decrease E-P from its maximum value of 2.0 to the initial profile, the ocean cools, first gradually as subduction shallows, then abruptly, when the THC returns to its original state with deep sinking in the southern hemisphere. This cooling, driven by a hydrologic cycle “spin down,” is consistent with observations showing that benthicδ18O values (indicating temperature) decrease to near pre-PETM values over less than 100 kyr [Röhl et al., 2000]. The model switch back to the original THC state occurs at a lower E-P (1.2 x control) than does the forward switch (1.6 x control), indicating multiple equilibria in a small parameter range for paleogeographies with a Brito-Arctic bridge.
A few of the above predictions are broadly consistent with changes inferred from existing records, but most await new high resolution marine records. We note that the prediction of relative timing (i. e., leads and lags between surface, intermediate and bottom waterδ18O and
δ13C decreases) is not at all straightforward. The distribution of late Paleocene hydrates is unknown and the model ocean exhibits important longitudinal and latitudinal variations in response to subduction warming, so that it is impossible to make firm predictions about relative timing of records at any particular site.
6. Concluding Remarks
If the PETM included a switch in thermohaline circulation and massive methane release, why did the event occur at this time? Our results indicate a strong sensitivity to North Atlantic tectonism: the THC switch and subsequent widespread bottom warming occur always and only when a barrier representing possible Greenland-Iceland-Faeroe Ridge uplift is specified in the model configuration. This suggests that the Paleocene-Eocene paleogeography played a critical role in the response of the ocean system to a gradual perturbation of the atmospheric hydrologic cycle. It may be interpreted as a measure for how many influences must conspire, even in a warm climate, to produce an event as remarkable as the PETM. Still, we caution that there exists substantial uncertainty in the exact details of the Paleocene/Eocene ocean configuration. With any ocean model, is it necessary to explore the sensitivity of the model solution to fundamental uncertainty in this boundary condition, but it is impossible to test all possible configurations. We therefore offer these results as representative of one part of the spectrum of possible THC
solutions and sensitivity for the Paleocene-Eocene ocean.
The model runs shown here have employed some significant idealizations, such as the use of zonal mean atmospheric boundary conditions or the absence of an explicit atmospheric model. While either simplification is expected to change the results quantitatively, we argue that
qualitatively the results are robust. The existence of, and transitions between, multiple equilibria of the thermohaline circulation is a robust phenomenon, across the range of simple and complex, coupled and uncoupled models [e.g., Manabe and Stouffer, 1988; Marotzke, 1990; Marotzke and
Willebrand, 1991; Weaver and Hughes, 1996]. In mathematical terms, the bifurcation structures
wrong” qualitatively. The justification of a simple model approach is discussed further by Bice
and Marotzke [2001].
Although we impose a zonal mean forcing to the ocean model, in reality, there is certainly west-east asymmetry in the atmospheric hydrologic cycle, with generally drier conditions over the eastern subtropical oceans [Peixoto and Oort, 1992]. This asymmetry is apparent in PETM records from subtropical latitudes of the North Atlantic. Gibson et al. [2000] describe clay mineral changes in the Salisbury Embayment (VA-NJ coastal plain) that suggest an increase in drainage basin-integrated moisture flux over some part of eastern North America. At the same time, PETM drying is supported by mineralogical and isotopic studies in the subtropical eastern North Atlantic and western Europe [Schmitz et al., 2001; Schmitz and Andreasson, 2001]. The Salisbury embayment record suggests that western North Atlantic embayment surface waters could have become less saline due to increased runoff during the PETM, but it is unlikely that such a change would prevent deepened subduction in the North Atlantic; The subduction process that transports warmer, saline water into the thermocline tends to remove surface water from the eastern side of the subtropical gyre and deposit it in the western deep thermocline [Price, 2001]. The decreased salinity waters inferred by Gibson et al. may therefore have existed as a lower density mass in the subtropical marginal western North Atlantic and may have had little influence on thermocline ventilation by subduction.
How literally should we read the fact that, in experiments where a THC switch occurred, it occurred at a 60% increase in the strength of the hydrologic cycle? Given the use of zonal mean forcings and the lack of an ocean-atmosphere feedback in the uncoupled model, we would argue only that, if such a switch occurred, it occurred at “some critical value” of moisture transport. Climate models, both coupled and uncoupled, differ in their prediction of the magnitude of increase in the water cycle given some magnitude increase in atmospheric CO2 [Manabe et al., 1994], and many fewer studies have examined CH4-induced changes in the hydrologic cycle. How strong the positive feedback in our hypothesized system is would have to be investigated using reliable coupled physical-chemical atmosphere-ocean models. Strict quantification of forcings and feedbacks in such a system is probably not feasible with existing coupled models, given that such models being used for future climate change research do not agree on the fundamental question of whether a future doubling of atmospheric CO2 will stabilize or destabilize the modern thermohaline circulation [Manabe and Stouffer, 1993; Rahmstorf and
Ganopolski, 1999; Latif et al., 2000].
The precise location and amount of PETM methane release resulting from gradual
subduction warming and abrupt THC switch-induced warming are difficult to predict. The many complexities of late Paleocene marine productivity, hydrate formation and stability, sediment stability, and controls on hydrate phase change under gradual and abrupt warming in already “warm” oceans remain to be sorted out by the diverse research community studying the
Paleocene-Eocene Thermal Maximum. The results presented here raise the intriguing possibility that an abrupt change in thermohaline circulation from southern to northern sinking was an integral part of the PETM and that this change could have resulted from a gradual increase in the water cycle under conditions of late Paleocene volcanism and Paleocene-Eocene
paleogeography.
Acknowledgements. This material is based upon work supported by the National Science
from discussions with J. Pedlosky, R. Norris, D. C. Kelly and J. Scott. We thank J. Dickens and E. Thomas for helpful comments on earlier versions of the manuscript. The MOM2 ocean model was developed under the direction of R. Pacanowski at the Geophysical Fluid Dynamics
Laboratory. The GENESIS atmospheric model was developed at the National Center for Atmospheric Research by S. Thompson and D. Pollard. The baseline paleogeography was provided by C. Scotese. The GENESIS model was run on the Cray SV1 system at Penn State University’s Environment Computing Facility. Model data visualization was done using Ferret, a freely distributed software package developed by the Thermal Modeling and Analysis Project at NOAA/PMEL. This is WHOI Contribution No. xxxxx.
References
Bains, S., R. M. Corfield, and R. D. Norris, Mechanisms of climate warming at the end of the Paleocene, Science,
285, 724-727, 1999.
Bains, S., R. D. Norris, R. M. Corfield, and K. L. Faul, Termination of global warmth at the Palaeocene/Eocene boundary through productivity feedback, Nature, 407, 171-174, 2000.
Beck, R. A., A. Sinha, D. W. Burbank, W. J. Sercombe, and A. M. Khan, Climatic, oceanographic, and isotopic consequences of the Paleocene India-Asia collision, in Late Paleocene-Early Eocene Climatic and Biotic Events
in the Marine and Terrestrial Records, edited by M.-P. Aubry, S. G. Lucas, and W. A. Berggren, pp. 103-117,
Columbia Univ. Press, New York, 1998.
Beerling, D. J., Increased terrestrial carbon storage across the Palaeocene-Eocene boundary, Palaeogeogr.
Palaeoclimatol. Palaeoecol., 161, 395-405, 2000.
Bice, K. L., and J. Marotzke, Numerical evidence against reversed thermohaline circulation in the warm Paleocene/ Eocene ocean, J. Geophys. Res., 106, 11529-11542, 2001.
Bice, K. L., E. J. Barron, and W. H. Peterson, Reconstruction of realistic Early Eocene paleobathymetry and ocean GCM sensitivity to specified basin configuration, in Tectonic Boundary Conditions for Climate Reconstructions, edited by T. Crowley and K. Burke, pp. 227-247, Oxford University Press, New York, 1998.
Bice, K. L., C. R. Scotese, D. Seidov, and E. J. Barron, Quantifying the role of geographic change in Cenozoic ocean heat transport using uncoupled atmosphere and ocean models, Palaeogeogr. Palaeoclimatol. Palaeoecol., 161, 295-310, 2000a.
Bice, K. L., L. C. Sloan, and E. J. Barron, Comparison of early Eocene isotopic paleotemperatures and the three-dimensional OGCM temperature field: The potential for use of model-derived surface waterδ18O, in Warm
Cli-mates in Earth History, edited by B. T. Huber, K. G. MacLeod, and S. L. Wing, pp. 79-131, Cambridge
Univer-sity Press, 2000b.
Boulter, M. C., and S. B. Manum, The Brito-Arctic igneous province flora around the Paleocene/Eocene boundary,
Proc. Ocean Drill. Program Sci. Results, 104, 663-680, 1989.
Bralower, T. J., D. J. Thomas, J. C. Zachos, M. M. Hirschmann, U. Roehl, H. Sigurdsson, E. Thomas, and D. L. Whit-ney, High-resolution records of the late Paleocene thermal maximum and circum-Caribbean volcanism: Is there a causal link?, Geology, 25, 963-966, 1997.
Chamberlin, T. C., On a possible reversal of deep-sea circulation and its influence on geologic climates, J. Geol., 14, 363-373, 1906.
Clift, P.D., and J. Turner, Paleogene igneous underplating and subsidence anomalies in the Rockall-Faeroe-Shetland area, Mar. Petrol. Geol., 15, 223-243, 1998.
Clift, P.D., J. Turner, and Leg 152 Scientific Party, The tectonics of volcanic margin formation in the NE Atlantic and the influence of the Icelandic hotspot, J. Geophys. Res., 100, 24,473-24,486, 1995.
Crowley, T. J., Paleomyths I have known, in Modeling the Earth’s Climate and Its Variability, edited by R. Holland, S. Joussaume, and F. David, pp. 377-430, Elsevier, Amsterdam, 1999.
Dickens, G. R., Methane oxidation during the Late Palaeocene Thermal Maximum, Bull. Geol. Soc. France, 171, 37-49, 2000.
Dickens, G. R., J. R. O’Neil, D. K. Rea, and R. M. Owen, Dissociation of Oceanic Methane Hydrate as a Cause of the Carbon-Isotope Excursion at the End of the Paleocene, Paleoceanography, 10, 965-971, 1995.
Eldholm, O., and E. Thomas, Environmental impact of volcanic margin formation, Earth Planet. Sci. Lett., 117, 319-329, 1993.
Erez, B., and J. Luz, Experimental paleotemperature equation for planktonic foraminifera, Geochim. Cosmochim.
Ac-ta, 47, 1025-1031, 1983.
Gibson, T. G., L. M. Bybell, D. B. Mason, Stratigraphic and climatic implications of clay mineral changes around the Paleocene/Eocene boundary of the northeastern US margin, Sed. Geol., 134, 65-92, 2000.
Hall, A., and R. J. Stouffer, An abrupt event in a coupled ocean-atmosphere simulation without external forcing,
Na-ture, 409, 171-174, 2001.
Kaiho, K., T. Arinobu, R. Ishiwatar, et al., Latest Paleocene benthic foraminiferal extinction and environmental chang-es at Tawanui, New Zealand, Paleoceanography, 11, 447-465, 1996.
Katz, M., D. K. Pak, G. R. Dickens, and K. G. Miller, The source and fate of massive carbon input during the latest Paleocene thermal maximum, Science, 286, 1531-1533, 1999.
Kennett, J. P., and L. D. Stott, Abrupt deep-sea warming, palaeoceanographic changes and benthic extinctions at the end of the Paleocene, Nature 353, 225-229, 1991.
Knox, R. W. O’B., The tectonic and volcanic history of the North Atlantic region during the Paleocene-Eocene tran-sition: Implications for NW European and global biotic events, in Late Paleocene-Early Eocene Climatic and
Biotic Events in the Marine and Terrestrial Records, edited by M.-P. Aubry, S. G. Lucas, and W. A. Berggren,
pp. 91-102, Columbia Univ. Press, New York, 1998.
Koch, P. L., J. C. Zachos, and P. D. Gingerich, Correlation between isotope records in marine and continental carbon reservoirs near the Palaeocene/Eocene boundary, Nature, 358, 319-322, 1992.
Koch, P. L., J. C. Zachos, and D. L. Dettman, Stable isotope stratigraphy and paleoclimatology of the Paleogene Big-horn Basin (Wyoming, USA), Palaeogeogr. Palaeoclimatol. Palaeoecol., 115, 61-89, 1995.
Kvenvolden, K. A., A primer on the geological occurrence of gas hydrate, in Gas hydrates; relevance to world margin
stability and climate change, edited by J. P. Henriet and J. Mienert, Geol. Soc. Spec. Pub. 137, pp. 9-30, 1998.
Latif, M., E. Roeckner, U. Mikolajewicz, and R. Voss, Tropical stabilization of the thermohaline circulation in a green-house warming simulation, J. Climate, 13, 1809-1813, 2000.
Luyten, J. R., J. Pedlosky, and H. Stommel, The ventilated thermocline, J. Phys. Oceanogr., 13, 292-309, 1983. Maas, M. C., M. R. L. Anthony, P. D. Gingerich, G. F. Gunnell, and D. W. Krause, Mammalian generic diversity and
turnover in the late Paleocene and early Eocene of the Bighorn and Crazy Mountains Basins, Wyoming and Mon-tana (USA), Palaeogeogr. Palaeoclimatol. Palaeoecol., 115, 181-207, 1995.
Manabe, S., Early development in the study of greenhouse warming: The emergence of climate models, Ambio, 26, 47-51, 1996.
Manabe, S., and K. Bryan, CO2-induced change in a coupled ocean-atmosphere model and its paleoclimatic implications, J. Geophys. Res., 90, 1689-1707, 1985.
Manabe, S., and R. J. Stouffer, Two stable equilibria of a coupled ocean-atmosphere model, J. Climate, 1, 841-866, 1988.
Manabe, S., and R. J. Stouffer, Century-scale effects of increased atmospheric CO2 on the ocean-atmosphere system, Nature, 364, 215-218, 1993.
Manabe, S., and R. J. Stouffer, Simulation of abrupt climate change induced by freshwater input to the North Atlantic Ocean, Nature, 378, 165-167, 1995.
Manabe, S., R. J. Stouffer, and M. J. Spelman, Response of a coupled ocean-atmosphere model to increasing atmospheric carbon dioxide, Ambio, 23, 44-49, 1994.
Marotzke, J., Instabilities and multiple equilibria of the thermohaline circulation, Ph. D. thesis. Berichte Inst. Meereskunde, 194, Kiel, 1990.
Marotzke, J., Analysis of thermohaline feedbacks, in Decadal Climate Variability: Dynamics and Predictability, edited by D.L.T. Anderson and J. Willebrand, pp. 333-378, Springer-Verlag, New York, 1996.
Marotzke, J., and J. Willebrand, Multiple equilibria of the global thermohaline circulation, J. Phys. Oceanogr., 21, 1372-1385, 1991.
Matsumoto, R. Causes of theδ13C anomalies of carbonates and a new paradigm ‘Gas Hydrate Hypothesis’, J. Geol.
Soc. Japan, 11, 902-924, 1995.
Norris, R. D., D. Kroon, A. Klaus, and the Leg 171B Scientific Party, Synthesis, Proc. Ocean Drill. Program Sci.
Results, 171B, 351-360, 1998.
Pak, D. K., and K. G. Miller, Paleocene to Eocene benthic foraminiferal isotopes and assemblages: Implications for deepwater circulation, Paleoceanography, 7, 405-422, 1992.
Peirce, J., J. Weissel, and Leg 121 Scientific Party, Site 757, Proc. Ocean Drill. Program Sci. Results, 121, 305-358, 1989.
Peixoto, J. P., and A. H. Oort, Physics of Climate, 520 pp., American Institute of Physics, New York, 1992. Price, J. F., Subduction, in Ocean Circulation and Climate: Observing and Modelling the Global Ocean, edited by
G. Siedler, J. Church, and J. Gould, pp. 357-371, Academic Press, San Diego, 2001.
Quilty, P. G., Upper Cretaceous benthic foraminifers and paleoenvironments, southern Kerguelen Plateau, Indian Ocean, Proc. Ocean Drill. Program Sci. Results, 120, 393-443, 1992.
Rahmstorf, S. and A. Ganopolski, Long-term global warming scenarios computed with an efficient coupled climate model, Climatic Change, 43, 353-367, 1999.
Ravizza, G., R. N. Norris, J. Blusztajn, and M.-P. Aubry, An osmium isotope excursion associated with the late Paleocene thermal maximum: Evidence of intensified chemical weathering, Paleoceanography, 16, 155-163, 2001.
Ritchie, J. D., and K. Hitchen, Early Paleogene offshore igneous activity to the northwest of the UK and its
relationship to the North Atlantic igneous province, in Correlation of the Early Paleogene in Northwest Europe,
Geol. Soc. Spec. Pub., 101, 63-78, 1996.
Robert, C., and J. P. Kennett, Antarctic subtropical humid episode at the Paleocene-Eocene boundary: Clay-mineral evidence, Geology, 22, 211-214, 1994.
Roberts, D. G., J. Backman, A. C. Morton, J. W. Murray, and J. B. Keene, Evolution of volcanic rifted margins: Syn-thesis of Leg 81 results on the west margin of Rockall Plateau, Deep Sea Drill. Proj. Init. Rep., 81, 883-912, 1984. Röhl, U., T. J. Bralower, R. D. Norris, and G. Wefer, New chronology for the late Paleocene thermal maximum and
its environmental implications, Geology, 28, 927-930, 2000.
Schmitz, B., and F. P. Andreasson, Air humidity and lakeδ18O during the latest Paleocene-earliest Eocene in France from recent and fossil fresh-water and marine gastropodδ18O,δ13C, and87Sr/86Sr, Geol. Soc. Am. Bull., 113, 774-789, 2001.
Schmitz, B., V. Pujalte, and K. Núñez-Betelu, Climate and sea-level perturbations during the initial Eocene thermal maximum: Evidence from siliciclastic units in the Basque Basin (Ermua, Zumaia and Trabakua Pass), northern Spain, Palaeogeogr. Palaeoclimatol. Palaeoecol., 165, 299-320, 2001.
Stott, L. D., J. P. Kennett, N. J. Shackleton, and R. M. Corfield, The evolution of Antarctic surface waters during the Paleogene: Inferences from the stable isotopic composition of planktonic foraminifers, ODP Leg 113, Proc.
Ocean Drill. Program Sci. Results, 113, 849-863, 1990.
Thomas, E., Biogeography of the late Palaeocene benthic foraminiferal extinction, in Late Paleocene-Early Eocene
Climatic and Biotic Events in the Marine and Terrestrial Records, edited by M.-P. Aubry, S. G. Lucas, and
W. A. Berggren, pp. 214-243, Columbia Univ. Press, New York, 1998.
Thomas, E., and N. J. Shackleton, The Paleocene-Eocene benthic foraminiferal extinction and stable isotope anomalies, in Correlation of the Early Paleogene in Northwest Europe, Geol. Soc. Spec. Pub., 101, 401-441, 1996.
Thomas, E., J. C. Zachos, and T. J. Bralower, Deep sea environments on a warm earth: Latest Paleocene-early Eocene, in Warm Climates in Earth History, edited by B. T. Huber, K. G. MacLeod, and S. L. Wing, pp. 132-160, Cambridge Univ. Press, Cambridge, 2000.
Thompson, S. L., and D. Pollard, Greenland and Antarctic mass balances for present and doubled CO2 from the GENESIS version 2 global climate model, J. Climate, 10, 871-900, 1997.
Tiffney, B. H., Wyoming: A crossroads in the Paleogene tropics (abstract), in Climate and Biota of the Early
Paleo-gene, Abstract Volume, edited by A. W. Ash and S. L. Wing, p. 94, Smithsonian Institution, Washington, 2001.
Weaver, A. J., and T. M. C. Hughes, On the compatibility of ocean and atmosphere models and the need for flux adjustments, Climate Dynamics, 12, 141-170, 1996.
White, N. J., and B. Lovell, Measuring the pulse of a plume with the sedimentary record, Nature, 387, 888-891, 1997. Zachos, J. C., K. C. Lohmann, J. C. G. Walker, and S. W. Wise, Abrupt Climate Change and Transient Climates
During the Paleogene - a Marine Perspective, J. Geol., 101, 191- 213, 1993.
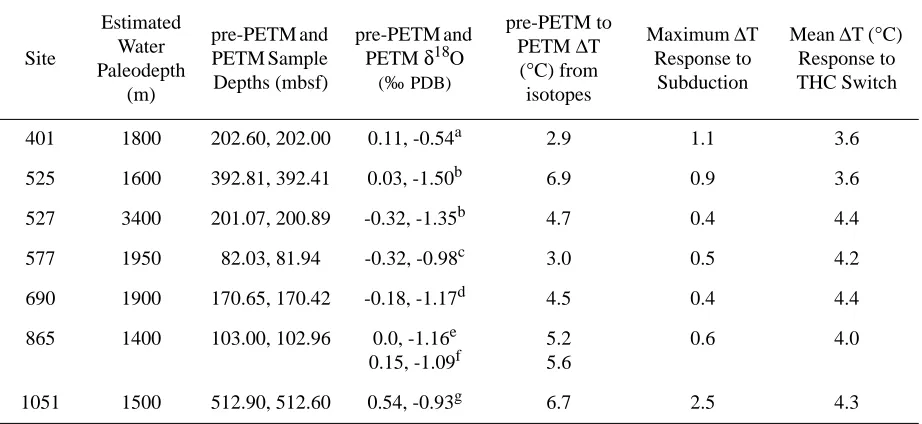
Table 1. Comparison of temperatures inferred fromδ18O of benthic foraminifera across the PETM and those predicted by the ocean model.
Site
Estimated Water Paleodepth
(m)
pre-PETM and PETM Sample Depths (mbsf)
pre-PETM and PETMδ18O
(‰PDB)
pre-PETM to PETM∆T (°C) from isotopes
Maximum∆T Response to
Subduction
Mean∆T (°C) Response to THC Switch
401 1800 202.60, 202.00 0.11, -0.54a 2.9 1.1 3.6
525 1600 392.81, 392.41 0.03, -1.50b 6.9 0.9 3.6
527 3400 201.07, 200.89 -0.32, -1.35b 4.7 0.4 4.4
577 1950 82.03, 81.94 -0.32, -0.98c 3.0 0.5 4.2
690 1900 170.65, 170.42 -0.18, -1.17d 4.5 0.4 4.4
865 1400 103.00, 102.96 0.0, -1.16e 0.15, -1.09f
5.2 5.6
0.6 4.0
1051 1500 512.90, 512.60 0.54, -0.93g 6.7 2.5 4.3
The isotopic temperature calculation [Erez and Luz, 1982] assumes local bottom waterδ18O equaled -1‰ (SMOW) and did not change across the PETM.
aCibicidoides [Pak and Miller, 1992] The peak PETM is missing in benthic records from Site 401, so the∆δ
recorded here is an underestimate of the actual change.
bNuttallides [Thomas and Shackleton, 1996]
cNuttallides [Pak and Miller, 1992] Samples across the P/E boundary at Site 577 do not contain the PETM. The
∆δrecorded here is for pre-PETM to post-PETM specimens.
dBulimina ovula [Thomas and Shackleton, 1996; Thomas et al., 2000]
eCibicidoides [Zachos et al., 2001]
fBulimina ovula [Zachos et al., 2001]
gOridorsalis [Katz et al., 1999] The onset of the PETM is missing in Site 1051, but peak PETM values appear to