www.esri.ie
Working Paper No. 357
October 2010
An Estimate of the Value of Lost Load for Ireland
Eimear Leahy
and Richard S.J. Tol
a,b cAbstract: This paper estimates the value of short term lost load in the all island electricity market which includes the Republic of Ireland and Northern Ireland. The value of lost load, also known as the value of security of electricity supply, is inferred using a production function approach. Detailed electricity use data for the Republic of Ireland allows us to estimate the value of lost load by time of day, time of week and type of user. We find that the value of lost load is highest in the residential sector in both the Republic of Ireland and Northern Ireland. Our results can be used to advise policy decisions in the case of supply outages and to encourage optimum supply security. In the context of this study short term is taken to be a matter of hours rather than days or weeks.
Corresponding Author: [email protected]
Key words: Value of lost load; Ireland
a
Department of Economics, Trinity College, Dublin, Ireland
b
Institute for Environmental Studies, Vrije Universiteit, Amsterdam, The Netherlands
c
Department of Spatial Economics, Vrije Universiteit, Amsterdam, The Netherlands
ESRI working papers represent un-refereed work-in-progress by researchers who are solely responsible for the content and any views expressed therein. Any comments on these papers will be welcome and should be sent to the author(s) by email. Papers may be downloaded for personal use only.
An Estimate of the Value of Lost Load for Ireland
1. Introduction
The value of lost load is the average willingness of electricity consumers to pay to
avoid an additional period without power. In an efficient market, it should be equal to
the wholesale peak price of electricity. The value of lost load would then affect
decisions regarding investment in new generation capacity and closure of older, less
efficient plants. Due to regulation in the Irish electricity market, customers cannot
express their willingness to pay. Thus, the value of lost load has to be inferred.
It appears that peak and reserve capacity is undersupplied in Ireland (Lyons et al. 2007)
and the possibility of supply shortages is real (Bazilian et al., 2006; Lyons et al., 2007;
Malaguzzi Valeri and Tol, 2006), although the risk is smaller now due to the recession.
As Ireland’s electricity supply becomes increasingly variable, primarily because of the
growing share of wind power in total power generation, capacity management and
reward is extremely important. New forms of electricity demand, such as electric and
hybrid vehicles, as well as increased interconnection will also lead to variability in
demand and supply. An accurate and up to date assessment of the value of lost load is
therefore essential to inform future planning.
This paper updates Tol (2007) which is the first and only published empirical estimate
of the value of lost load for the Republic of Ireland. The main advantage of this paper
is that access has now been provided to data on the time profile of electricity use per
type of user in the Republic of Ireland. Whereas Tol (2007) assumed that the
probability of a brown-out1 is constant across consumer groups, we can now estimate
which users would be hardest hit by such an event. We use this data to estimate the
value of lost load in the Republic of Ireland between 2001 and 2008. We also estimate
the value of lost load for Northern Ireland between 2000 and 2007. Thus, this paper
constitutes a substantially refined estimate of the value of lost load in the all island
market.
The value of lost load can be estimated in three ways. The first is that used by
Beenstock et al. (1998) which relies on consumer surveys and is based on stated
preferences. Since no Irish data of this kind exists, this method is unavailable to us.
1
A brown-out is defined as a condition where the voltage supplied to the system falls below the specified operating range, but above zero volts. A black-out is a total loss of electrical power in a region.
Corwin and Miles (1978) estimated the value of lost load using cost estimates from
previous supply outages. The underlying assumption is that the past and the future are
similar, which is not appropriate for Ireland given the rapid economic and structural
changes that have taken place. The third alternative, which is employed in this paper, is
based on estimates of production functions. This approach relates electricity use to firm
output, or in the case of households, the value of time spent on non paid work. Our
methodology is discussed further in section 2.
In 2007 the regulatory authorities of the Single Electricity Market2, the CER and
NIAUR, set the value of lost load at €10/KWh based on the estimated peak price of
planned electricity capacity (CER and NIAUR, 2007). The stated reasoning is rather
unrealistic since it assumes that planned capacity will always equal desired capacity.
The value has been re-estimated on an annual basis by using the previous year’s value
and adjusting it by applying the weighted average of the year-on-year increase in the
Irish Harmonised Index of Consumer Prices (HICP) and the UK HICP.3 Using this
method the value of lost load for 2010 is €10.27/KWh (CER and NIAUR, 2009).
The paper continues as follows. Section 2 presents the data and methods and Section 3
the results. Section 4 provides a discussion and Section 5 concludes.
2. Data and Methods
We follow the methodology of de Nooij et al. (2007), Tol (2007) and de Nooij et al.
(2009) and estimate the value of lost load using the production function technique. The
value of lost load can be derived by dividing Gross Value Added (GVA) (in € millions)
in a specific sector by the amount of electricity (in GWh) used. This will give the value
per KWh that this sector generates, roughly equal to the value that would be lost in the
case of a brown-out.
For Northern Ireland, we assume that each sector’s production function is linear and
that companies are able to shift production within the year. Thus, the time at which the
brown-out occurs is not important, but of course some production will be lost due to
the brown-out. This assumption is a reasonable one for most activities. Another
2
The Single Electricity Market is a joint electricity market between the Republic of Ireland and Northern Ireland.
3
The Irish HICP is given a weight of 2/3 and the UK HICP is given a weight of 1/3. Year on year increases are based on July estimates.
assumption is that the duration of the electricity outage does not matter. This is also
reasonable as any brown-outs that could occur in Northern Ireland are likely to be for
short periods. For households we define the value of lost load as the value of time
spent on non paid work divided by electricity used. We assume that all activity stops
when there is no electricity. Thus, an hour without electricity is an hour of time lost.
This seems a generous assumption, but risk and annoyance are not taken into account.
The value placed on time spent on non paid work varies with electricity use by time of
day. Exelon (2007) shows that in the UK 44% of household electricity is used during
the day, 35% in the evening, and 20% at night. For Northern Ireland we estimate the
value of time spent at non paid work by day, evening and night for midweek days and
weekend days.
Estimates of annual electricity use in Northern Ireland are taken from DECC (2008).
NIAUR (2010) provides figures for household electricity use. However, estimates of
electricity use in other sectors are not available. Instead, we allocate electricity use in
these sectors using the appropriate UK and ROI shares. Thus, we have two estimates
for the value of lost load in these sectors. GVA per sector data is taken from ONS
(2009) and we convert these to constant prices (HM Treasury, 2010). Operating hours
in the industrial and service sectors are taken from de Nooij et al. (2007). Estimates of
the number of hours worked and average earnings are from the Annual Survey of
Hours and Earnings (ASHE) 1999-2008 (ONS, 2010a). UK tax rates are taken from
OECD (2009) while estimates of the number employed are taken from DETI (2010).
Wages are adjusted for inflation using the Consumer Price Index for the UK (ONS,
2010b). The population of Northern Ireland is estimated by NISRA (2008).
With regard to the Republic of Ireland, ESBI (2009) has provided data on the
electricity profiles of the residential, industrial and commercial sectors for each hour of
2001. We derive the proportion of electricity used by each sector at each hour and use
it as a proxy for the proportion used by each sector in each hour in later years. Data on
annual electricity use per sector are taken from SEAI (2009). For the industrial and
commercial sectors, we estimate the annual average value of 1 KWh of electricity as
before. Since we do not know the value added by the industrial and commercial sectors
per day and hour, we cannot derive the value of lost load per time of day or year.
However, we can estimate the total hourly value of electricity by multiplying the
average value of 1 KWh of electricity by the amount of electricity used.
To evaluate lost load in the residential sector, we incorporate data from the 2005 Time
Use in Ireland Survey (ESRI, 2005). Using this data we can assess the activities in
which people are involved over two 24 hour periods; one midweek and the other
weekend. For those who are not at home or at home but asleep, the cost of a brown-out
is zero. For those who are working from home we assume that the opportunity cost of
time spent on non paid work is equal to the average wage after tax. For those at home
and neither working nor asleep, the opportunity cost of time spent on non paid work is
equal to half of the average wage as in de Nooij et al. (2007) and Tol (2007). Thus, the
opportunity cost varies throughout the day and between midweek and weekend days.
As we have data on the profile of household electricity use, we can find hourly values
of lost load by dividing the value of time spent on non paid work in that hour by the
amount of electricity used.
Estimates of GVA per sector in constant prices are taken from CSO (2010). Population
and labour force data are taken from GGDC (2010). Data on after tax non agricultural
wages in constant prices4 are taken from the ESRI databank (Bergin and FitzGerald,
2009).
There are of course limitations associated with the use of production functions to
estimate the value of lost load. One drawback is that additional assumptions are
required such as rationality of economic agents and divisibility of goods and services.
Also, production functions are usually estimated on an annual basis and thus may not
be appropriate for estimating the impact of hourly electricity interruptions. We are
unable to account for restart time in businesses after an outage or annoyance in
households caused by a supply interruption.
3. Results
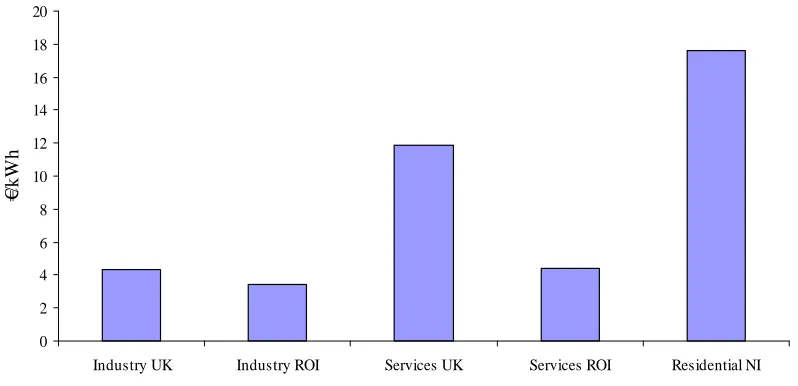
Figure 1 shows the value of lost load in Northern Ireland if power outages had
occurred in 2007. The value of electricity to the industrial and commercial sectors
varies depending on whether electricity use was allocated using ROI or NI shares. The
use of ROI and UK shares result is a surprisingly similar value of lost load in the
industrial sector. The value of lost load in the commercial sector varies depending on
whether UK or ROI shares are used. This can be attributed to the higher share of
4
2004=100
electricity use in the UK services sector relative to that of ROI. The value of lost load
[image:6.595.113.512.179.372.2]in the residential sector far outweighs that of the other sectors.
Figure 1. The Value of Lost Load in NI 2007
0 2 4 6 8 10 12 14 16 18 20
Industry UK Industry ROI Services UK Services ROI Residential NI
€/
kW
h
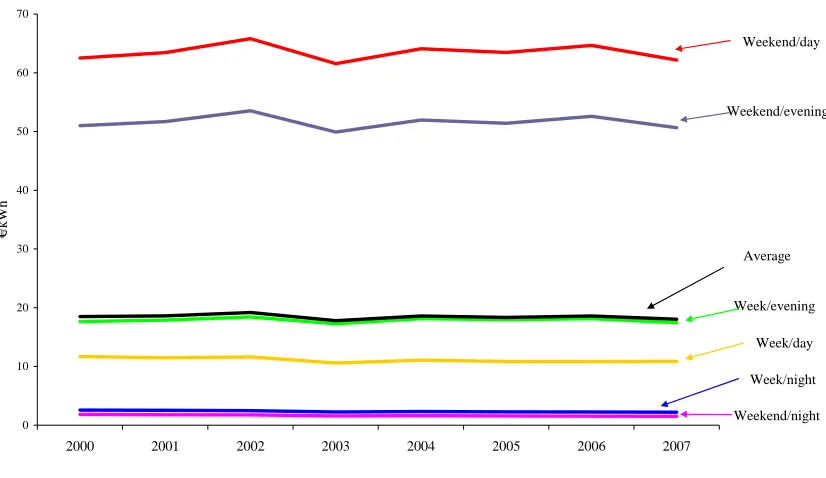
Figure 2 shows the value of lost load in Northern Ireland by time of day over the
period 2000 to 2007.5 The value differs substantially between midweek and weekend
days and by time of day. The value of lost electricity to industry is highest on midweek
days between the hours of 8am and 6pm. For households, the value of electricity is
highest at the weekends, especially during the day. Because the value of lost load is so
much greater to households than it is to industry, we see that this pattern is repeated in
the average results. As expected, the loss is lowest during the night both midweek and
at the weekend.
5
We estimated these values using both ROI and NI electricity shares in the non residential sector and found that the results were very similar. This graph represents an average of the two results.
Figure 2. NI value of lost load by time of week and year (2000-2007)
0 10 20 30 40 50 60 70
2000 2001 2002 2003 2004 2005 2006 2007
€/kWh
Weekend/day
Weekend/evening
Week/day
Week/night
Weekend/night Average
Week/evening
With regard to the Republic of Ireland, the average value of lost load is highest in the
residential sector. This happens because of the relatively high value which is placed on
time spent at non paid work on both midweek and weekend days and evenings. The
total value of hourly electricity is also much higher in the residential sector than it is in
the industrial and commercial sectors. The total cost of a lost hour of electricity varies
considerably by time of day, especially in the commercial and residential sectors.
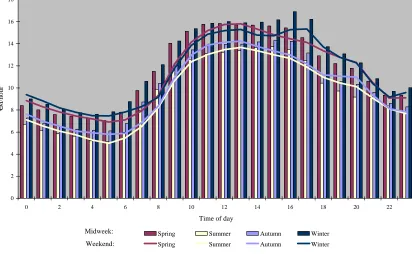
Figure 3 shows the average value in 2008 of a lost hour to the industrial sector at
different times of year. Note that figure 3 shows the value per hour rather than the
value per KWh. The bars and lines represent midweek and weekend days respectively.
The pattern is somewhat similar across seasons. The value of a lost hour is lowest
between the hours of 16.00 and 18.00 in winter. This may be partly due to a lower
demand for cooling at this time of year. The value of a lost hour is highest at 07.00 on
midweek days all year round. At weekends, however, the value of a lost hour falls
between 6am and 8am and between 3pm and 6pm. This pattern is repeated throughout
the year. In general, the value of a lost hour is lower at weekends than it is midweek
due to reduced activity on Saturdays and Sundays.
Figure 3. ROI Industry hourly value of electricity by season and time of week
(2008)
0 1 2 3 4 5 6 7 8 9
0 2 4 6 8 10 12 14 16 18 20 22
Time of day
€M/hour
Spring Summer Autumn Winter Spring Summer Autumn Winter Midweek:
Weekend:
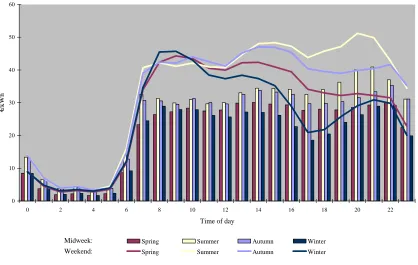
Figure 4 shows the average value in 2008 of a lost hour of electricity in the commercial
sector at different times of year for midweek (represented by bars) and weekend
(represented by lines) days. Again, figure 4 shows the value of electricity per hour
rather than per KWh. Both midweek and weekend days follow a similar pattern. As
expected, in each case, the loss is highest during standard business hours. The value
can be as high as €17 million per hour. As the commercial sector represents all of the
service industry and the public service, it is not surprising that the loss is lowest in
summer when the demand for electricity is also low because of natural light.
Figure 4.ROI Commercial hourly value of electricity by season and time of week
(2008)
0 2 4 6 8 10 12 14 16 18
0 2 4 6 8 10 12 14 16 18 20 22
Time of day
€M/hour
Spring Summer Autumn Winter Spring Summer Autumn Winter Midweek:
[image:9.595.112.524.135.389.2]Weekend:
Figure 5 shows the value of a lost unit of electricity in households in 2008. Unlike
figures 3 and 4, figure 5 shows the value of lost load. The bars, which represent
midweek days, show that the value of lost load is low during the night and increases
substantially between the hours of 5am and 7am. It then remains relatively steady until
evening time, mainly driven by the fact that the value of time spent on non paid work is
low and stable between 8-9am and 17-18pm when most people are at work. On
midweek days, in the evening time, the value is highest in summer and lowest in
winter. Although electricity use is highest in winter, electricity is valued in terms of
time spent on non paid work and thus the amount people are willing to pay per unit of
electricity falls.6 However, the hourly value of electricity will remain high in winter.
The continuous lines represent the value of lost load at weekends. Again, the value is
lowest during the night and increases between the hours of 5am and 8am. From midday
onwards, the value varies by season. At 20.00 on weekend evenings in summer, the
value of lost load reaches an average of €51/KWh when most people are at home but
6
Because the value of lost load is defined as loss of time spent on non paid work divided by electricity use, the overall value people are willing to pay for a lost unit of electricity will fall when electricity use, the denominator, increases.
not asleep. For the most part, the value of lost load on weekend days exceeds that of
[image:10.595.100.518.144.409.2]midweek days.
Figure 5.Household value of lost load by season and time of week in ROI (2008)
0 10 20 30 40 50 60
0 2 4 6 8 10 12 14 16 18 20 22
Time of day
€/
kWh
Spring Summer Autumn Winter Spring Summer Autumn Winter Midweek:
Weekend:
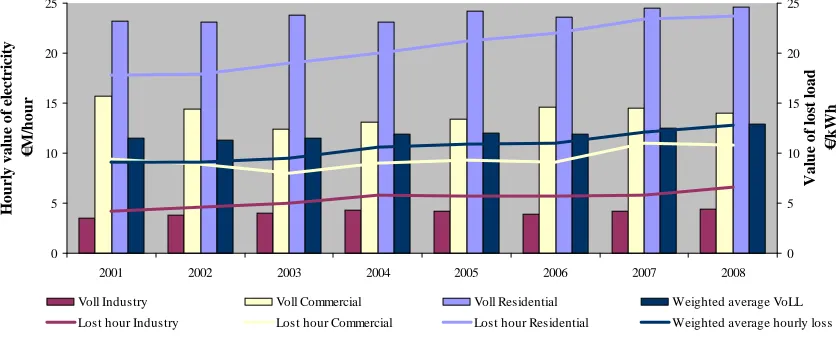
Figure 6 shows the evolution of the value of electricity over time for both the hourly
value (€/hr) and the value of lost load (€/KWh). The total value of a lost hour of
electricity to all three sectors (indicated by the lines on the chart) increased between
2001 and 2008. We estimate the cumulative annual growth rates in the value of a lost
hour of electricity in the industrial, commercial and residential sectors as being 6.7%,
1.9% and 4.2% respectively. The bars (and secondary axis) on the chart show the
average value of losing 1 KWh of electricity in each of the sectors. The residential
values increased only slightly over the period (by 0.8%). This trend is largely due to
the stabilisation of wage taxes and saturation of the employment ratio. The industrial
value of lost load increased over the period as GVA outgrew electricity use in this
sector, however, the commercial value decreased slightly.
Figure 6. Hourly value of electricity and value of lost load in ROI 2001-2008 0 5 10 15 20 25
2001 2002 2003 2004 2005 2006 2007 2008
H o u rl y v a lu e o f el ec tr ici ty €M /h our 0 5 10 15 20 25 V a lu e o f lo st lo a d €/ kWh
Voll Industry Voll Commercial Voll Residential Weighted average VoLL Lost hour Industry Lost hour Commercial Lost hour Residential Weighted average hourly loss
4. Discussion
4.1. Current capacity regulations
On 1st November 2007 the trading of wholesale electricity in the Republic of Ireland
and Northern Ireland began on an all-island basis. In this Single Electricity Market
(SEM) all electricity generated in or imported into Ireland must be sold into a common
pool and all electricity for consumption in Ireland or export to other countries must be
purchased from the pool. The SEM replaces the old system in which a central planner
would specify a level of capacity (for example, by estimating expected demand plus a
reserve margin) thought sufficient to meet a defined standard for system reliability.
The aim of the SEM is to allow market forces to ensure that adequate capacity is built
in an efficient and timely manner. It is hoped that this will lower prices in the long run.
The market operates on pool arrangements whereby all suppliers pay and generators
receive the same System Marginal Price.7 Generators also receive capacity payments,
which are based on annually determined fixed amounts and are ultimately paid for by
consumers. The aim of such payments is to increase certainty of revenues, encourage
investment and ensure that capacity is made available when it is required. The benefit
for generators is that if they make plant available when capacity margins are tight,
revenues can be earned which are greater than the short run costs. The level of
payments is based on estimates of the tightness of the market and the cost of new
7
The system marginal price is determined by the bid price of the marginal dispatched plant and all dispatched plants receive this price. Dispatched plants are chosen on the basis that all plants are stacked according to their bid, from the cheapest to the most expensive. The cheapest plants that are needed to match demand in each half hour are dispatched.
peaking capacity. Since this system has been implemented availability of plants has
increased slightly in the Republic of Ireland.
Current dispatchable capacity stands at approximately 7,000 MW. At times of high
demand, surplus capacity is currently about 800MW (Eirgrid, 2009). However, forced
outages among a small number of ageing generation units could sharply increase the
risk of shortages if they were to coincide with peak winter demand (Malaguzzi Valeri
and Tol, 2006). Continued increases in demand (although the recession resulted in
decreased demand last year) and planned retirement of old plant have increased the
need for investment in new plants over the coming years. According to the energy
forecasts of SEAI (Walker et al., 2009), electricity demand is set to increase by 12%
between 2008 and 2020.8 The growing importance of wind generation in the SEM
suggests that the system will need more mid-merit and peaking capacity to help meet
system reliability goals in future. Peaking plants can be switched on and off relatively
easily due to the relatively high level of variable costs to fixed costs that they face.
Thus, these plants can be used to meet fluctuating demand. Base load plants, on the
other hand, face relatively high fixed costs to variable costs and so, it is most efficient
to use them in a continuous way. Mid-merit plants generally produce electricity for
several hours at a time but can be shut down and restarted on a daily basis.
4.2. The implications of using the estimated value of lost load
The value placed on lost load should be used to assist decisions regarding investment
in new capacity and closure of older, less efficient plants in order to meet the desired
supply security. Capacity management is increasingly important as electricity supply
and demand become more variable. In Ireland, the growing share of wind power in
total generation means that supply is already less predictable than it used to be. The
expected growth in interconnection, electric and hybrid vehicles, and smart appliances
will further complicate capacity management.
Our results show that the weighted average value of lost load in ROI is €12.9/KWh.
This indicates that the €10/KWh set by CER & NIAUR is too low for short term loss
of load (several hours). The average value of lost load in Northern Ireland in 2007 was
8
Despite forecasted decreases in demand between 2008 and 2012, the average annual growth rate for both electricity and total energy is estimated to be 0.9% between 2008 and 2020.
€4/KWh for the industrial sector, €13/KWh for the commercial sector and €18/KWh
for the residential sector. In contrast, in the Republic of Ireland in 2008, the average
value of lost load was around €4/KWh for the industrial sector, €14/KWh for the
commercial sector and €24.6/KWh for households. The residential value is an average,
brought down by the very low values which occur during the night. It can reach values
over €60/KWh, usually at weekends when most people are at home. Between the hours
of 18.00 and 21.00 on midweek days, when brown-outs are most likely, hourly values
of electricity are at their highest; between €41 million and €45 million. In 2008, peak
electricity demand occurred at 17.00 on 15th December. At this time, the average value
of lost load was €15.2/KWh but it was even higher at €35/KWh between 08.00 and
09.00 that day. Thus, the peak value of lost load and peak electricity demand do not
occur simultaneously. This opens some opportunities for peak shifting to minimise the
damage of brown-outs.
The estimate for Northern Ireland suffers from a lack of detailed data on residential
electricity use and time use. The average VoLL we have estimated for NI may be an
overestimate, as the incorporation of detailed data on residential electricity use for the
Republic of Ireland has resulted in a downward revision of the weighted average value
of lost load compared to that estimated by Tol (2007).
At present, during a brown-out, it is policy to shut off electricity in residential areas
first, and in industrial estates later. As the value of lost load is highest in the residential
sector, in both Northern Ireland and in the Republic of Ireland (during the relevant
hours), this policy may be reconsidered. However, the decision as to which sector will
be subject to rationing should depend on the day and time at which the shortage occurs.
During the hours of 1am and 6am the value of a lost hour of electricity in the industrial
and commercial sectors is much higher than it is in the residential sector.
5. Conclusion
In this paper, we use a simple version of the production function approach to estimate
the short term value of lost load in Northern Ireland for the period 2000-2007 and in
the Republic of Ireland for the period 2001-2008.
These results come with a number of caveats. More detailed data on electricity use per
type of user in Northern Ireland would enable us to deliver more accurate results. It
would be good to test the validity of our results based on the production function
approach with estimates based on contingent valuation and contingent choice methods
as well as with estimates based on observed black-outs. Our estimates are valid only
for short interruptions of the power supply. Longer interruptions, while much more
unlikely, may well be disproportionally damaging. All this is deferred to future
research.
Acknowledgements
Sean Lyons, Laura Malaguzzi Valeri, Pat McCullen and Gerry White had excellent
comments on an earlier version of this paper. Financial support by ESBI is gratefully
acknowledged. All errors and opinions are ours.
References
Bazilian, M., O'Leary, F., O’Gallachoir, B., Howley, M., 2006. Security of Supply in
Ireland. Sustainable Energy Ireland, Cork.
Beenstock, M., Goldin, E., Haitovsky, Y., 1998. Response Bias in a Conjoint Analysis
of Power Outages. Energy Economics, 20, 135-156.
Bergin, A., FitzGerald, J., 2009. The ESRI Data Bank. Economic and Social Research
Institute, Dublin.
CER and NIAUR, 2007. The Value of Lost Load, the Market Price Cap and the Market
Price Floor -- A Response and Decision Paper. Commission for Electricity Regulation
and Northern Ireland Authority for Utility Regulation, Dublin.
CER and NIAUR, 2009. The Value of Lost Load in 2010 Decision Paper.
Commission for Electricity Regulation and Northern Ireland Authority for Utility
Regulation, Dublin.
Corwin, J., Miles, W., 1978. Impact Assessment of the 1977 New York City Blackout.
US Department of Energy, Washington, DC.
CSO, 2010. National Accounts. Central Statistics Office,
http://www.cso.ie/statistics/nationalacc.htm.
de Nooij, M., Koopmans, C., Bijvoet, C., 2007. The value of supply security: The costs
of power interruptions: Economic input for damage reduction and investment in
networks. Energy Economics, 29, 277-295.
de Nooij, M., Lieshout, R., Koopmans, C., 2009. Optimal blackouts: Empirical results
on reducing the social cost of electricity outages through efficient regional rationing.
Energy Economics, 31, 342-347.
DECC, 2008. Sub National Electricity Figures. Department of Energy and Climate
Change,
http://www.decc.gov.uk/en/content/cms/statistics/publications/ecuk/ecuk.aspx.
DETI, 2010. Employment Statistics. Department of Enterprise, Trade and Investment,
http://www.detini.gov.uk/deti-stats-index/stats-labour-market/stats-labour-market-employment.htm.
Eirgrid, 2009. Generation Adequacy Report 2010-2016. Eirgrid,
http://www.eirgrid.com/media/Generation%20Adequacy%20Report%202010-2016.pdf
Elexon, 2007. Load Profiles and their Use in Electricity Settlement. Elexon,
http://www.elexon.co.uk/documents/Participating_in_the_Market/Market_Guidance_-_Industry_Helpdesk_faqs/Load_Profiles.pdf.
ESBI, 2009. Electricity Profiles 2001. ESB International, www.esbi.ie.
ESRI, 2005. Irish National Time Use Survey 2005. Economic and Social Research
Institute, www.esri.ie.
GGDC, 2010. Total Economy Database. Groningen Growth and Development Centre,
http://www.ggdc.net.
HM Treasury, 2010. GDP Deflators. Her Majesty's Treasury,
http://www.hm-treasury.gov.uk/d/gdp_deflators.xls.
Lyons, S., Fitz Gerald, J., McCarthy, D., Malaguzzi Valeri, L., Tol, R.S.J., 2007.
Preserving Electricity Market Efficiency while Closing Ireland's Capacity Gap.
Quarterly Economic Commentary, Autumn, 62-82.
Malaguzzi Valeri, L., Tol, R.S.J., 2006. Electricity Shortages in Ireland: Probability
and Consequences. Quarterly Economic Review, Winter, 1-7.
NIAUR, 2010. Electricity. The Northern Ireland Authority for Utility Regulation,
http://www.niaur.gov.uk/electricity.
NISRA, 2008. Demography. Northern Ireland Statistics and Research Agency,
http://www.nisra.gov.uk/archive/demography/population/midyear/NI_Home_Pop_5yrb
ds(1961-2008).xls.
OECD, 2009. Taxing Wages 2008. Organisation for Economic Co-operation and
Development, Paris.
ONS, 2009. NUTS1 GVA (1989-2008) Data. Office for National Statistics,
http://www.statistics.gov.uk/downloads/theme_economy/CRC2008ALL.pdf.
ONS, 2010a. ASHE Results. Office for National Statistics,
http://www.statistics.gov.uk/statBase/product.asp?vlnk=13101.
ONS, 2010b. Consumer Price Indices. Office for National Statistics.
http://www.statistics.gov.uk/statbase/Product.asp?vlnk=868
SEAI, 2009. Energy Balance Statistics, Sustainable Energy Authority of Ireland,
http://www.cso.ie/px/sei/database/SEI/Energy%20Balance%20Statistics/Energy%20Ba
lance%20Statistics.asp
17
Tol, R.S.J., 2007. The Value of Lost Load, in: O'Leary, F., Bazilian, M., Howley, M.,
O’Gallachoir, B. (Eds.), Security of Supply in Ireland 2007 Report, Sustainable Energy
Ireland, Cork, pp. 63-66.
Walker, N., Scheer, J., Clancy, M., Ó Gallachóir,B., 2009. Energy Forecasts for Ireland
Year Number Title/Author(s) ESRI Authors/Co-authors Italicised
2010
356 Public Policy Towards the Sale of State Assets in Troubled
Times: Lessons from the Irish Experience
Paul K. Gorecki, Sean Lyons and Richard S. J. Tol
355 The Impact of Ireland’s Recession on the Labour Market
Outcomes of its Immigrants
Alan Barrett and Elish Kelly
354 Research and Policy Making
Frances Ruane
353 Market Regulation and Competition; Law in Conflict: A
View from Ireland, Implications of the Panda Judgment
Philip Andrews and Paul K Gorecki
352 Designing a property tax without property values: Analysis
in the case of Ireland
Karen Mayor, Seán Lyons and Richard S.J. Tol
351 Civil War, Climate Change and Development: A Scenario
Study for Sub-Saharan Africa
Conor Devitt and Richard S.J. Tol
350 Regulating Knowledge Monopolies: The Case of the IPCC
Richard S.J. Tol
349 The Impact of Tax Reform on New Car Purchases in
Ireland
Hugh Hennessy and Richard S.J. Tol
348 Climate Policy under Fat-Tailed Risk:
An Application of FUND
David Anthoff and Richard S.J. Tol
347 Corporate Expenditure on Environmental Protection
Stefanie A. Haller and Liam Murphy
346 Female Labour Supply and Divorce: New Evidence from
Ireland
Olivier Bargain, Libertad González, Claire Keane and
Berkay Özcan
345 A Statistical Profiling Model of Long-Term Unemployment
Risk in Ireland
Philip J. O’Connell, Seamus McGuinness, Elish Kelly
344 The Economic Crisis, Public Sector Pay, and the Income
Distribution
Tim Callan, Brian Nolan (UCD) and John Walsh
343 Estimating the Impact of Access Conditions on
Service Quality in Post
Gregory Swinand, Conor O’Toole and Seán Lyons
342 The Impact of Climate Policy on Private Car Ownership in
Ireland
Hugh Hennessy and Richard S.J. Tol
341 National Determinants of Vegetarianism
Eimear Leahy, Seán Lyons and Richard S.J. Tol
340 An Estimate of the Number of Vegetarians in the World
Eimear Leahy, Seán Lyons and Richard S.J. Tol
339 International Migration in Ireland, 2009
Philip J O’Connell and Corona Joyce
338 The Euro Through the Looking-Glass:
Perceived Inflation Following the 2002 Currency Changeover
Pete Lunn and David Duffy
337 Returning to the Question of a Wage Premium for
Returning Migrants
Alan Barrett and Jean Goggin
2009 336 What Determines the Location Choice of Multinational
Firms in the ICT Sector?
Iulia Siedschlag, Xiaoheng Zhang, Donal Smith
335 Cost-benefit analysis of the introduction of weight-based
charges for domestic waste – West Cork’s experience
Sue Scott and Dorothy Watson
334 The Likely Economic Impact of Increasing Investment in
Wind on the Island of Ireland
Conor Devitt, Seán Diffney, John Fitz Gerald, Seán Lyons
and Laura Malaguzzi Valeri
333 Estimating Historical Landfill Quantities to Predict Methane
Emissions
Seán Lyons, Liam Murphyand Richard S.J. Tol
332 International Climate Policy and Regional Welfare Weights
Daiju Narita, Richard S. J. Tol, and David Anthoff
331 A Hedonic Analysis of the Value of Parks and
Green Spaces in the Dublin Area
Karen Mayor, Seán Lyons, David Duffy and Richard S.J. Tol
330 Measuring International Technology Spillovers and Progress Towards the European Research Area Iulia Siedschlag
329 Climate Policy and Corporate Behaviour
Nicola Commins, Seán Lyons, Marc Schiffbauer,and
Richard S.J. Tol
328 The Association Between Income Inequality and Mental
Health: Social Cohesion or Social Infrastructure
Richard Layte and Bertrand Maître
327 A Computational Theory of Exchange:
Willingness to pay, willingness to accept and the endowment effect
Pete Lunn and Mary Lunn
326 Fiscal Policy for Recovery
John Fitz Gerald
325 The EU 20/20/2020 Targets: An Overview of the EMF22
Assessment
Christoph Böhringer, Thomas F. Rutherford, and Richard
S.J. Tol
324 Counting Only the Hits? The Risk of Underestimating the
Costs of Stringent Climate Policy
Massimo Tavoni, Richard S.J. Tol
323 International Cooperation on Climate Change Adaptation
from an Economic Perspective
Kelly C. de Bruin, Rob B. Dellink and Richard S.J. Tol
322 What Role for Property Taxes in Ireland?
T. Callan, C. Keane and J.R. Walsh
321 The Public-Private Sector Pay Gap in Ireland: What Lies
Beneath?
Elish Kelly, Seamus McGuinness, Philip O’Connell
320 A Code of Practice for Grocery Goods Undertakings and An
Ombudsman: How to Do a Lot of Harm by Trying to Do a Little Good
Paul K Gorecki
319 Negative Equity in the Irish Housing Market
David Duffy
318 Estimating the Impact of Immigration on Wages in Ireland
Alan Barrett, Adele Bergin and Elish Kelly
317 Assessing the Impact of Wage Bargaining and Worker
Preferences on the Gender Pay Gap in Ireland Using the National Employment Survey 2003
Seamus McGuinness, Elish Kelly, Philip O’Connell, Tim Callan
316 Mismatch in the Graduate Labour Market Among
Immigrants and Second-Generation Ethnic Minority Groups
Delma Byrne and Seamus McGuinness
315 Managing Housing Bubbles in Regional Economies under
EMU: Ireland and Spain
Thomas Conefrey and John Fitz Gerald
314 Job Mismatches and Labour Market Outcomes
Kostas Mavromaras, Seamus McGuinness, Nigel O’Leary,
Peter Sloane and Yin King Fok
313 Immigrants and Employer-provided Training
Alan Barrett, Séamus McGuinness, Martin O’Brien
and Philip O’Connell
312 Did the Celtic Tiger Decrease Socio-Economic Differentials
in Perinatal Mortality in Ireland?
Richard Layte and Barbara Clyne
311 Exploring International Differences in Rates of Return to
Education: Evidence from EU SILC
Maria A. Davia, Seamus McGuinness and Philip, J.
O’Connell
310 Car Ownership and Mode of Transport to Work in Ireland
Nicola Commins and Anne Nolan
309 Recent Trends in the Caesarean Section Rate in Ireland
1999-2006
Aoife Brick and Richard Layte
308 Price Inflation and Income Distribution
Anne Jennings, Seán Lyons and Richard S.J. Tol
307 Overskilling Dynamics and Education Pathways
Kostas Mavromaras, Seamus McGuinness, Yin King Fok
306 What Determines the Attractiveness of the European
Union to the Location of R&D Multinational Firms? Iulia Siedschlag, Donal Smith, Camelia Turcu, Xiaoheng Zhang
305 Do Foreign Mergers and Acquisitions Boost Firm
Productivity?
Marc Schiffbauer, Iulia Siedschlag, Frances Ruane
304 Inclusion or Diversion in Higher Education in the Republic of Ireland?
Delma Byrne
303 Welfare Regime and Social Class Variation in Poverty and
Economic Vulnerability in Europe: An Analysis of EU-SILC
Christopher T. Whelan and Bertrand Maître
302 Understanding the Socio-Economic Distribution and
Consequences of Patterns of Multiple Deprivation: An Application of Self-Organising Maps
Christopher T. Whelan, Mario Lucchini, Maurizio Pisati and Bertrand Maître
301 Estimating the Impact of Metro North
Edgar Morgenroth
300 Explaining Structural Change in Cardiovascular Mortality in
Ireland 1995-2005: A Time Series Analysis
Richard Layte, Sinead O’Hara and Kathleen Bennett
299 EU Climate Change Policy 2013-2020: Using the Clean
Development Mechanism More Effectively
Paul K Gorecki, Seán Lyons and Richard S.J. Tol
298 Irish Public Capital Spending in a Recession
Edgar Morgenroth
297 Exporting and Ownership Contributions to Irish
Manufacturing Productivity Growth
Anne Marie Gleeson, Frances Ruane
296 Eligibility for Free Primary Care and Avoidable
Hospitalisations in Ireland Anne Nolan
295 Managing Household Waste in Ireland:
Behavioural Parameters and Policy Options
John Curtis, Seán Lyons and Abigail O’Callaghan-Platt
294 Labour Market Mismatch Among UK Graduates;
An Analysis Using REFLEX Data
Seamus McGuinness and Peter J. Sloane
293 Towards Regional Environmental Accounts for Ireland
Richard S.J. Tol , Nicola Commins, Niamh Crilly, Sean
Lyons and Edgar Morgenroth
292 EU Climate Change Policy 2013-2020: Thoughts on
Property Rights and Market Choices
Paul K. Gorecki, Sean Lyons and Richard S.J. Tol
291 Measuring House Price Change David Duffy
290 Intra-and Extra-Union Flexibility in Meeting the European
Union’s Emission Reduction Targets Richard S.J. Tol
289 The Determinants and Effects of Training at Work:
Bringing the Workplace Back In
Philip J. O’Connell and Delma Byrne
288 Climate Feedbacks on the Terrestrial Biosphere and the
Economics of Climate Policy: An Application of FUND
Richard S.J. Tol
287 The Behaviour of the Irish Economy: Insights from the
HERMES macro-economic model
Adele Bergin, Thomas Conefrey, John FitzGerald and Ide
Kearney
286 Mapping Patterns of Multiple Deprivation Using
Self-Organising Maps: An Application to EU-SILC Data for Ireland
Maurizio Pisati, Christopher T. Whelan, Mario Lucchini and
Bertrand Maître
285 The Feasibility of Low Concentration Targets:
An Application of FUND Richard S.J. Tol
284 Policy Options to Reduce Ireland’s GHG Emissions
Instrument choice: the pros and cons of alternative policy instruments
Thomas Legge and Sue Scott
283 Accounting for Taste: An Examination of Socioeconomic
Gradients in Attendance at Arts Events
Pete Lunn and Elish Kelly
282 The Economic Impact of Ocean Acidification on Coral
Reefs
Luke M. Brander, Katrin Rehdanz, Richard S.J. Tol, and
Pieter J.H. van Beukering
281 Assessing the impact of biodiversity on tourism flows: A
model for tourist behaviour and its policy implications Giulia Macagno, Maria Loureiro, Paulo A.L.D. Nunes and Richard S.J. Tol
280 Advertising to boost energy efficiency: the Power of One
campaign and natural gas consumption
Seán Diffney, Seán Lyons and Laura Malaguzzi Valeri
279 International Transmission of Business Cycles Between Ireland and its Trading Partners
Jean Goggin and Iulia Siedschlag
278 Optimal Global Dynamic Carbon Taxation
David Anthoff
277 Energy Use and Appliance Ownership in Ireland
Eimear Leahy and Seán Lyons
276 Discounting for Climate Change
David Anthoff, Richard S.J. Tol and Gary W. Yohe
275 Projecting the Future Numbers of Migrant Workers in the
Health and Social Care Sectors in Ireland
Alan Barrett and Anna Rust
274 Economic Costs of Extratropical Storms under Climate
Change: An application of FUND
Daiju Narita, Richard S.J. Tol, David Anthoff
273 The Macro-Economic Impact of Changing the Rate of
Corporation Tax
Thomas Conefrey and John D. Fitz Gerald
272 The Games We Used to Play
An Application of Survival Analysis to the Sporting Life-course
Pete Lunn
2008
271 Exploring the Economic Geography of Ireland
Edgar Morgenroth
270 Benchmarking, Social Partnership and Higher
Remuneration: Wage Settling Institutions and the Public-Private Sector Wage Gap in Ireland
Elish Kelly, Seamus McGuinness, Philip O’Connell
269 A Dynamic Analysis of Household Car Ownership in Ireland
Anne Nolan
268 The Determinants of Mode of Transport to Work in the
Greater Dublin Area
Nicola Commins and Anne Nolan
267 Resonances from Economic Development for Current
Economic Policymaking Frances Ruane
266 The Impact of Wage Bargaining Regime on Firm-Level
Competitiveness and Wage Inequality: The Case of Ireland
Seamus McGuinness, Elish Kelly and Philip O’Connell
265 Poverty in Ireland in Comparative European Perspective
Christopher T. Whelan and Bertrand Maître
264 A Hedonic Analysis of the Value of Rail Transport in the
Greater Dublin Area
Karen Mayor, Seán Lyons, David Duffy and Richard S.J. Tol
263 Comparing Poverty Indicators in an Enlarged EU
Christopher T. Whelan and Bertrand Maître
262 Fuel Poverty in Ireland: Extent,
Affected Groups and Policy Issues
Sue Scott, Seán Lyons, Claire Keane, Donal McCarthy and
Richard S.J. Tol
261 The Misperception of Inflation by Irish Consumers
David Duffy and Pete Lunn
260 The Direct Impact of Climate Change on Regional Labour
Productivity
Tord Kjellstrom, R Sari Kovats, Simon J. Lloyd, Tom Holt, Richard S.J. Tol
259 Damage Costs of Climate Change through Intensification
of Tropical Cyclone Activities: An Application of FUND
Daiju Narita, Richard S. J. Tol and David Anthoff
258 Are Over-educated People Insiders or Outsiders?
A Case of Job Search Methods and Over-education in UK
Aleksander Kucel, Delma Byrne
257 Metrics for Aggregating the Climate Effect of Different
Emissions: A Unifying Framework
Richard S.J. Tol, Terje K. Berntsen, Brian C. O’Neill, Jan S.
Fuglestvedt, Keith P. Shine, Yves Balkanski and Laszlo Makra
256 Intra-Union Flexibility of Non-ETS Emission Reduction
Obligations in the European Union Richard S.J. Tol
255 The Economic Impact of Climate Change
Richard S.J. Tol
254 Measuring International Inequity Aversion
Richard S.J. Tol
253 Using a Census to Assess the Reliability of a National
Household Survey for Migration Research: The Case of Ireland
Alan Barrett and Elish Kelly
252 Risk Aversion, Time Preference, and the Social Cost of
Carbon
David Anthoff, Richard S.J. Tol andGary W. Yohe
251 The Impact of a Carbon Tax on Economic Growth and
Carbon Dioxide Emissions in Ireland
Thomas Conefrey, John D. Fitz Gerald, Laura Malaguzzi
Valeri and Richard S.J. Tol
250 The Distributional Implications of a Carbon Tax in Ireland
Tim Callan, Sean Lyons, Susan Scott, Richard S.J. Tol and
Stefano Verde
249 Measuring Material Deprivation in the Enlarged EU
Christopher T. Whelan, Brian Nolan and Bertrand Maître
248 Marginal Abatement Costs on Carbon-Dioxide Emissions: A
Meta-Analysis
Onno Kuik, Luke Brander and Richard S.J. Tol
247 Incorporating GHG Emission Costs in the Economic
Appraisal of Projects Supported by State Development Agencies
Richard S.J. Tol and Seán Lyons
246 A Carton Tax for Ireland
Richard S.J. Tol, Tim Callan, Thomas Conefrey, John D.
Fitz Gerald, Seán Lyons, Laura Malaguzzi Valeri and Susan
Scott
245 Non-cash Benefits and the Distribution of Economic
Welfare
Tim Callan and Claire Keane
244 Scenarios of Carbon Dioxide Emissions from Aviation
Karen Mayor and Richard S.J. Tol
243 The Effect of the Euro on Export Patterns: Empirical
Evidence from Industry Data
Gavin Murphy and Iulia Siedschlag
242 The Economic Returns to Field of Study and Competencies
Among Higher Education Graduates in Ireland
Elish Kelly, Philip O’Connell and Emer Smyth
241 European Climate Policy and Aviation Emissions
Karen Mayor and Richard S.J. Tol
240 Aviation and the Environment in the Context of the EU-US Open Skies Agreement
Karen Mayor and Richard S.J. Tol
239 Yuppie Kvetch? Work-life Conflict and Social Class in
Western Europe
Frances McGinnity and Emma Calvert
238 Immigrants and Welfare Programmes: Exploring the
Interactions between Immigrant Characteristics, Immigrant Welfare Dependence and Welfare Policy
Alan Barrett and Yvonne McCarthy
237 How Local is Hospital Treatment? An Exploratory Analysis
of Public/Private Variation in Location of Treatment in Irish Acute Public Hospitals
Jacqueline O’Reilly and Miriam M. Wiley
236 The Immigrant Earnings Disadvantage Across the Earnings
and Skills Distributions: The Case of Immigrants from the EU’s New Member States in Ireland
Alan Barrett, Seamus McGuinness and Martin O’Brien
235 Europeanisation of Inequality and European Reference
Groups
Christopher T. Whelan and Bertrand Maître
234 Managing Capital Flows: Experiences from Central and
Eastern Europe
Jürgen von Hagen and Iulia Siedschlag
233 ICT Diffusion, Innovation Systems, Globalisation and
Regional Economic Dynamics: Theory and Empirical Evidence
Charlie Karlsson, Gunther Maier, Michaela Trippl, Iulia
Siedschlag, Robert Owen and Gavin Murphy
232 Welfare and Competition Effects of Electricity
Interconnection between Great Britain and Ireland Laura Malaguzzi Valeri
231 Is FDI into China Crowding Out the FDI into the European
Union?
Laura Resmini and Iulia Siedschlag
230 Estimating the Economic Cost of Disability in Ireland
John Cullinan, Brenda Gannon and Seán Lyons
229 Controlling the Cost of Controlling the Climate: The Irish
Government’s Climate Change Strategy
Colm McCarthy, Sue Scott
228 The Impact of Climate Change on the
Balanced-Growth-Equivalent: An Application of FUND
David Anthoff, Richard S.J. Tol
227 Changing Returns to Education During a Boom? The Case
of Ireland
Seamus McGuinness, Frances McGinnity, Philip O’Connell
226 ‘New’ and ‘Old’ Social Risks: Life Cycle and Social Class
Perspectives on Social Exclusion in Ireland
Christopher T. Whelan and Bertrand Maître
225 The Climate Preferences of Irish Tourists by Purpose of
Travel
Seán Lyons, Karen Mayor and Richard S.J. Tol
224 A Hirsch Measure for the Quality of Research Supervision,
and an Illustration with Trade Economists
Frances P. Ruane and Richard S.J. Tol
223 Environmental Accounts for the Republic of Ireland:
1990-2005
Seán Lyons, Karen Mayor and Richard S.J. Tol
2007 222 Assessing Vulnerability of Selected Sectors under
Environmental Tax Reform: The issue of pricing power
J. Fitz Gerald, M. Keeney and S. Scott
221 Climate Policy Versus Development Aid
Richard S.J. Tol
220 Exports and Productivity – Comparable Evidence for 14
Countries
The International Study Group on Exports and Productivity
219 Energy-Using Appliances and Energy-Saving Features:
Determinants of Ownership in Ireland
Joe O’Doherty, Seán Lyons and Richard S.J. Tol
218 The Public/Private Mix in Irish Acute Public Hospitals:
Trends and Implications
Jacqueline O’Reilly and Miriam M. Wiley
217 Regret About the Timing of First Sexual Intercourse: The
Role of Age and Context
Richard Layte, Hannah McGee
216 Determinants of Water Connection Type and Ownership of
Water-Using Appliances in Ireland
Joe O’Doherty, Seán Lyons and Richard S.J. Tol
215 Unemployment – Stage or Stigma?
29
Being Unemployed During an Economic Boom Emer Smyth
214 The Value of Lost Load
Richard S.J. Tol
213 Adolescents’ Educational Attainment and School
Experiences in Contemporary Ireland
Merike Darmody, Selina McCoy, Emer Smyth
212 Acting Up or Opting Out? Truancy in Irish Secondary
Schools
Merike Darmody, Emer Smyth and Selina McCoy
211 Where do MNEs Expand Production: Location Choices of
the Pharmaceutical Industry in Europe after 1992
Frances P. Ruane, Xiaoheng Zhang
210 Holiday Destinations: Understanding the Travel Choices of
Irish Tourists
Seán Lyons, Karen Mayor and Richard S.J. Tol
209 The Effectiveness of Competition Policy and the Price-Cost
Margin: Evidence from Panel Data
Patrick McCloughan, Seán Lyons and William Batt
208 Tax Structure and Female Labour Market Participation:
Evidence from Ireland