Original Article
Programmed cell death 2 functions
as a tumor suppressor in osteosarcoma
Yuanxun Yang1*, Yan Jin2*, Wenxi Du3
1Department of Orthopedics, First People’s Hospital of Jinan, Jinan 250013, Shandong, China; 2Jinan Center for Disease Control and Prevention, Jinan 250021, Shandong, China; 3Department of Orthopedics, The First Affiliated Hospital of Zhejiang Chinese Medical University, Hangzhou 310006, Zhejiang, China. *Co-first authors.
Received May 31, 2015; Accepted July 21, 2015; Epub September 1, 2015; Published September 15, 2015
Abstract: Objectives: To investigate the role of programmed cell death 2 (PDCD2) in osteosarcoma (OS), along with correlations between PDCD2 and CD4+/CD8+. Methods: Sprague-Dawley (SD) rats were randomly assigned
to control group and OS group. The OS group rats were subjected to induce models of OS by transplantation with UMR106 cells. Peripheral blood was collected to test the percentages of the CD4+ and CD8+ cell subsets using flow
cytometry (FCM). Western blotting was performed to determine the PDCD2 protein level. The correlations between PDCD2 and CD4+/CD8+ were analyzed by Pearson correlation coefficient. Besides, specific small interfering RNAs
(siRNA) against PDCD2 and nonspecific (NS)-siRNA were transfected into UMR106 cells. Cell viability and invasive
ability were determined after transfection. Results: CD4+ cells percentages were significantly decreased in the OS
group, while CD8+ cells were significantly increased (P < 0.05). The PDCD2 protein levels were markedly lower than
that in the control group (P < 0.05). Additionally, PDCD2 was positively correlated with CD4+ (R2 = 0.66, P < 0.05),
but was negatively correlated with CD8+ (R2 = -0.94, P < 0.05). Moreover, the cell viability and invasion ability were
significantly higher than that in the control group and the NS siRNA group after transfection with PDCD2 siRNA (P
< 0.05). Conclusion: These results suggest that PDCD2 is involved in the pathogenesis of OS, and PDCD2 may play an important role in tumor suppression. These mechanisms might be related to immune response induced by CD4+
and CD8+ T cells.
Keywords: Osteosarcoma, programmed cell death 2, CD4+, CD8+
Introduction
Osteosarcoma (OS) is a relatively rare cancer, which is responsible for 5% of childhood tumors and 8.9% of tumor-related deaths in teenagers
[1]. But it is the most frequent pediatric primary
malignant bone tumor around the world [2], with males in predominance (male/female = 1.6:1) [3, 4]. Additionally, OS develops rapidly, progresses aggressively and usually has a high occurrence of lung metastasis [5]. Although advances in the tailored therapies and improve-ment in the 5-year disease-free survival rate have taken place [6-8], amputation is still the principal treatment in most cases [5], resulting in physical disability and psychological distress for both the patients and their families. Therefore, there is an urgent need to unveil the pathogenesis of OS to improve treatment.
Recently, dysregulation of immune system has been reported to be associated with the devel-opment of OS [9-11]. A previous study found that programmed cell death (PDCD)1 was
sig-nificantly increased on both OS patients’ periph -eral CD4+ and CD8+ T cells, suggesting that PDCD1 is associated with the pathogenesis of OS and the progression of disease [12]. However, the role of PDCD2 in OS has not been explored. PDCD2, a highly conserved nuclear
protein, was identified by Kawakami et al. [13]. It has been paid attention since aberrant PDCD2 expression is involved in cell apoptosis
[14]. Besides, previous studies reported that
The role of PDCD2 in OS
potential targeting anticancer treatment [17]. Little information is available regarding the cor-relations between PDCD2 and CD4+/CD8+ in OS.
Therefore, in the present study, we explored the role of PDCD2 in OS, and the relationship between PDCD2 expression and CD4+/CD8+ T
cell percentages. We firstly established the OS
model using transplantation with UMR106 cell line. Next, the percentages of CD4+/CD8+ were evaluated, and the PDCD2 protein level was
confirmed in both OS and health controls.
Further, the cell viability and invasive ability were assessed after silencing of expression of PDCD2. Our results may provide an essential research for searching a new target therapy of OS.
Materials and methods
Cell line, rats and tumors
The UMR106 OS cell line, provided by the American Type Culture Collection (ATCC; Mana-
ssas, VA, USA), were cultured in Dulbecco’s Modified Eagle’s Medium (DMEM) which was
supplemented with 10% fetal bovine serum
(FBS), 100 U/ml penicillin and 100 µg/ml strep -tomycin. The medium and the drugs were all purchased from Invitrogen, Carlsbad, CA, USA. The cells were maintained in a 5% CO2 incuba-tor at 37°C.
Fifty-six male Sprague-Dawley (SD) rats (2-3 weeks old, weighing 40-50 g) were used in our experiment. The animal care and use was in consistent with the Guide for Care and Use of Laboratory Animals published by the China National Institutes of Health. All animals were randomly divided into two groups (n = 28): OS group and control group. The animal models of OS were established according to previous
studies [19, 20]. Briefly, after washing twice
with 0.01 mmol/L phosphate buffer solution
(PBS, pH =7.4), the UMR106 OS cells were
re-suspended in PBS at a concentration of 2 ×
107/ml. Under sterile conditions, the cell
sus-pension (0.5 ml) and PBS (0.5 ml) were slowly
injected into the subcutaneous tissue on the back of OS group rats and control group rats, respectively. At 8-12 days after transplantation, the tumors diameter reached approximately 1.0 centimeters.
Flow cytometry (FCM)
Venous whole blood samples were collected from each rat in the both two groups at 30 days after transplantation, and stored at -80°C until use. Fluorescently labeled anti-CD4+ and anti-CD8+ monoclonal antibodies were added to the blood samples. After 15 min incubation at room temperature, 1 ml hemolysin was added to the mixture. Then the mixture was kept away from the light at room temperature for another 15 min. After 5 minutes centrifugation at 5000 r/ min, the supernatant was discarded, and the
cells were washed twice with PBS. The percent -ages of the CD4+ and CD8+ cell subsets in the peripheral blood were determined using FCM
(Becton Dickinson, USA).
Western blotting
Rats were sacrificed to acquire the tissues.
Tumor tissues from the OS group and distal femoral or proximal tibial tissues from the con-trol group were harvested and stored at -80°C until used. For Western blotting analysis, the
tissues were washed with PBS. Protein density was determined using BCA assay kit (TaKaRa BIO INC, Japan) according to the manufactur
-er’s instruction. Protein samples (15 μL) from
each group were separated by 10-12% stan-dard electrophoresis sodium dodecyl sulfate polyacrylamide (SDS-PAGE) gel and transferred
onto polyvinylidene difluoride (PDVF) mem
-branes (Nihon Millipore Kogyo, Tokyo, Japan).
Defatted milk powder (5%) was used to block
nonspecific protein-binding sites on the PVDF
membranes for 2 h at room temperature. After
washing with Tris-buffered saline Tween (TBST),
the membranes were incubated overnight at 4°C with anti-PDCD2 antibody (1:500; Pro-
teintech) or anti-β-actin antibody (1:1000, Novus Biologicals, Littleton, CO). Then the
membranes were incubated with appropriate peroxidase-conjugated secondary antibodies at room temperature. After another washing
with TBST, enhanced chemiluminescence and
densitometric analysis was performed. Finally, Gel-Pro analyzer software (version 4, Toyobo, Osaka, Japan) was used to assess the band. Transfection
After post-culturing in 10% FBS/DMEM for 24
against PDCD2 and nonspecific (NS)-siRNA
(Qiagen, Venlo, Netherlands) were transfected into UMR106 cells with Lipofectamine 2000
(Invitrogen, USA) based on the manufacturer’s
protocols. Experiments were carried out 48 h later for further analysis.
Cell proliferation assay
The UMR-106 cells were collected for mea- surement of cell viability using 3-(4, 5-dimethyl-thiazol-2-yl)-2, 5-diphenyltetrazolium bromide (MTT) colorimetric assay according to the
man-ufacturer’s guidelines. Briefly, the UMR 106 cells were washed with PBS and placed in 96-well plate at a final concentration of 1 × 10⁵ cells/well. After transfection at 0 h and 24 h,
10 μl MTT (0.5 mg/mL) was added to each well,
and the plates were incubated at 37°C for another 2 h. The absorbance at 570 nm was measured using a microplate reader (Molecular Devices Corp., Sunnyvale CA). Experiments were performed 3-5 times.
Matrigel invasion assay
The Matrigel invasion assay was conducted to evaluate the effects of PDCD2 on the invasive properties of the UMR106 cells. A 12-well plate
with Transwell inserts insisting of 12.0-μm pore (Becton-Dickinson, Franklin Lakes, NJ, USA) were coated with 200 μl Matrigel matrix base
-ment membrane (BD Biosciences, San Jose,
CA, USA). The cells were harvested after trans-fection with siRNAs for 48 h later, and then the cells were suspended in serum-free DMEM
media at a density of 1 × 10⁵ cells/ml. A total of
100 μl cell suspensions from each sample were
placed to each well in triplicate. After
incuba-tion 48 h at 37°C in a humidified incubator con -taining 5% CO2, the membranes were stained with 0.5% crystal violet in methanol and the remaining cells were calculated using a light
microscope (Olympus, Tokyo, Japan) at × 100 magnification. Each experiment was carried out in duplicate. Eight high powered fields were ran -domly collected and counted for each mem- brane.
Statistical analysis
One-sample K-S test was firstly performed to confirm the normal distribution. Chi-square test
or rank-sum test was used to analyze the enu-meration data. The collected data, expressed as mean ± standard deviation (SD), were ana-lyzed by statistical package for the social sci-ences (SPSS) (version 19.0; SPSS Inc., Chicago, IL). Student t-test and analysis of variance (ANOVA) were used to analyze the measure-ment data for two groups and more than three groups, respectively. Further post-hoc Tukey test was performed to evaluate the compari-sons between groups. Pearson correlation
coefficient was used to determine the relation -ship between PDCD2 and CD4+/CD8+. A
[image:3.612.99.520.74.265.2]statis-tical significance was defined when P < 0.05. Figure 1. Expression of CD4+ and CD8+ T cells after transplantation with UMR106 cells. A. Expression of CD4+ cells
after transplantation with UMR106 cells; B. Expression of CD8+ cells after transplantation with UMR106 cells; *P <
The role of PDCD2 in OS
Results
Expression of CD4+ and CD8+ T cells after transplantation with UMR106 cells
To understand the expression of CD4+ and CD8+ T cells in OS, we firstly induced the model of OS by transplantation with UMR106 cells. The FCM results showed that the percentage of CD4+ cells percentage was significantly dec-reased in the OS group than that in the control group (P < 0.05), but CD8+ T cells percentage
was significantly increased in the OS group (P < 0.05) (Figure 1A and 1B).
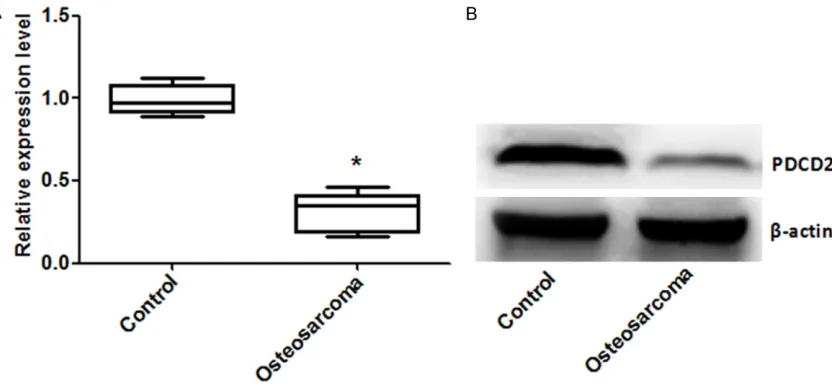
Expression of PDCD2 after transplantation with UMR106 cells
To confirm the expression of PDCD2 in UMR106
cells, we performed Western blotting to assess the protein expression of PDCD2. As shown in
Figure 2A and 2B, the protein expression level of PDCD2 was lower than that in the control
group, and there was a significance between
the two groups (P < 0.05).
Correlations between PDCD2 and CD4+/CD8+
[image:4.612.100.516.74.268.2]To evaluate the relationship between the ex- pression of PDCD2 and CD4+/CD8+, Pearson Figure 2. Expression of PDCD2 after transplantation with UMR106 cells. A. Relative protein expression level of
PDCD2; B. Western blotting picture of PDCD2; PDCD, programmed cell death; *P < 0.05 compared with the control
[image:4.612.97.518.332.489.2]group.
Figure 3.Correlations between PDCD2 and CD4+/CD8+. A. The correlation between PDCD2 and CD4+; B. The cor
correlation coefficient was carried out. As
shown in Figure 3A and 3B, we found that the expression of PDCD2 was correlated strongly positive with CD4+ (R2 = 0.66, P < 0.05), but was correlated strongly negative with CD8+ (R2 = -0.94, P < 0.05).
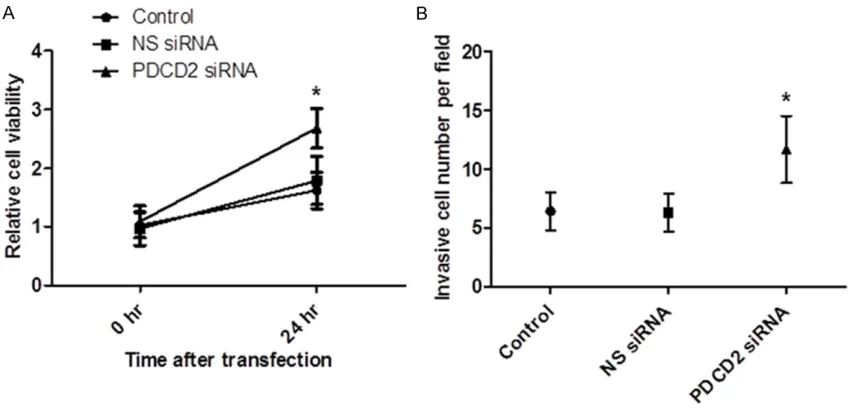
Silencing of PDCD2 to UMR106 cells increases cell viability and invasion ability
To examine the effect of silencing of PDCD2 on the cell viability and invasion ability, we
per-formed the target sequence for PDCD2-specific
siRNA into UMR106 cells. The MTT results
showed that the cell viability was significantly
higher than that in the control group and the NS siRNA group by transfection with PDCD2 siRNA (P < 0.05, Figure 4A). In addition, the Matrigel invasion assay showed that the average
inva-sive cell numbers pre field in the control group
and the NS siRNA group were 5-6, while in the PDCD2 siRNA group it was 12.3. The cell
inva-sion ability was significantly increased in the
PDCD2 siRNA group than that in the other two groups (P < 0.05, Figure 4B).
Discussion
PDCD2 protein is responsible for embryonic development and tissue remodeling by induc-tion of apoptosis, and alterainduc-tion of PDCD2 expression is associated with development of human cancers. In the present study, we
explored the role of PDCD2 in OS and the cor-relations between PDCD2 and CD4+/CD8+. We found that the PDCD2 protein levels were
sig-nificantly reduced in the OS group than that in
the control group. In addition, the cell viability
and invasion ability were significantly increased
after silencing of the expression of PDCD2. Moreover, PDCD2 was correlated with both the CD4+ and CD8+ cells percentages. These results demonstrate that PDCD2 is involved in the pathogenesis of OS, and PDCD2 may func-tion as an important factor in tumor suppression.
PDCD2 gene, the human homologue of the rat Rp8 gene, is reported to be located on
chromo-some 6q27, which encodes a nuclear protein
found in many tissues [17]. It has been
identi-fied as a target of the transcriptional repressor BCL6 that is required for lymph node germinal
center development. The function of PDCD2 is mainly explored in hematological tumors in
[image:5.612.94.520.74.280.2]pre-vious studies. A study conducted by Baron et al. [21] indicated that the apoptosis in human erythroleukemia cells induced by expression of PDCD2 through activation of caspases. Another study showed that knockdown of PDCD2 expression in both leukemia Jurkat cells and lung cancer A549 cells could impair cell prolif-eration and progression to S phase of the cell cycle [17]. Recently, the role of PDCD2 in other human cancers has gained more attention. Zhang et al. reported that loss of PDCD2 Figure 4. Silencing of PDCD2 to UMR106 cells increases cell viability and invasion ability. A. Silencing of PDCD2
The role of PDCD2 in OS
expression is involved in the development and progression of gastric cancer, and that the cell growth is arrested at the early S phase of the cell cycle [18]. Fan et al. showed that the expression of PDCD2 decreased in multidrug-resistant colon cancer cells [22]. However, the role of PDCD2 in OS has been rarely reported. Therefore, we speculated that PDCD2 may be associated with OS.
To confirm the hypothesis, we evaluated the
protein expression level of PDCD2 in OS model. The OS model was successfully established by transplantation with UMR106 cells. The Western blotting showed that the PDCD2
pro-tein expression was significantly decreased in
the OS model group than that in the control group. The results indicated that PDCD2 might be involved in the pathogenesis of OS. To fur-ther assess the function of PDCD2 in OS, we silenced the expression of PDCD2 in UMR106 cell line. The cell viability and invasion ability were determined. The results demonstrated that silencing of PDCD2 expression resulted in increase of cancer cell viability and invasion ability, indicating that PDCD2 might be function as a potential tumor suppression factor. The above results were in line with previous studies [18, 21, 22].
It has been well accepted that CD4+ T cells are essential for antitumor immune responses [23-26]. CD4+ T cells remove tumors by activation and recruitment of some effector cells, such as macrophages and eosinophils [23, 27]. However, CD8+ T cells can directly and destroy tumor masses in vivo by infiltrating the cancer cell nest [28]. Besides, CD4+ T cells are benefit for prime CD8+ T cells responses [25]. Moreover, CD4+ T cells play an important role in maintain-ing effector functions of CD8+T cells by secret-ing some cytokines (e.g. interleukin 2) that is
required for growth and proliferation of CD8+ T cells [29]. Furthermore, the cooperative role of CD4+ T cells and CD8+ cytotoxic T lymphocytes (CTLs) has been reported to in tumor suppres-sion in vivo [30]. Zheng et al. found that the OS
patients presented significantly upregulated
percentages of PDCD1 on both peripheral CD4+ and CD8+ T cells. Therefore, we speculated that PDCD2 expression might also be associated with peripheral CD4+ and CD8+ T cells. We found that OS group presented lower CD4+ cells percentages and higher CD8+ T cells. The results indicated that the immune function of
OS patients might be inhibited, leading to reduced ability to remove tumor cells. Additionally, the correlations between the PDCD2 expression and CD4+ and CD8+ T cells percentages were investigated. Our results showed that PDCD2 was strongly positive with CD4+ cells percentages, but negatively corre-lated with CD8+ T cells percentages, suggesting that the tumor suppression of PDCD2 might be involved with immune response.
In conclusion, our results suggest that PDCD2 is involved in the pathogenesis of OS, and PDCD2 may play an important role in tumor suppression. These mechanisms might be related to immune response induced by CD4+ and CD8+ T cells.
Disclosure of conflict of interest
None.
Address correspondence to: Dr. Wenxi Du, Depart-
ment of Orthopedics, The First Affiliated Hospital of
Zhejiang Chinese Medical University, 54 You-Dian Road, Hangzhou 310006, Zhejiang, China. Tel: +86-0571-86620271; Fax: +86-+86-0571-86620271; E-mail: duwenxi2098@126.com
References
[1] Yang J and Zhang W. New molecular insights into osteosarcoma targeted therapy. Curr Opin Oncol 2013; 25: 398-406.
[2] Luetke A, Meyers PA, Lewis I and Juergens H. Osteosarcoma treatment-where do we stand? A state of the art review. Cancer Treat Rev 2014; 40: 523-532.
[3] Longhi A, Errani C, De Paolis M, Mercuri M and
Bacci G. Primary bone osteosarcoma in the pe -diatric age: state of the art. Cancer Treat Rev 2006; 32: 423-436.
[4] Quan G, Ojaimi J, Nadesapillai A, Zhou H and Choong P. Resistance of epiphyseal cartilage to invasion by osteosarcoma is likely to be due to expression of antiangiogenic factors. Pathobiol 2001; 70: 361-367.
[5] Zhu XZ, Yin HM and Mei J. Inhibition of tumors cell growth in osteosarcoma-bearing SD rats through a combination of conventional and metronomic scheduling of neoadjuvant che-motherapy. Acta Pharmacol Sinica 2010; 31: 970-976.
[6] Wittig JC, Bickels J, Priebat D, Jelinek J, Kellar-Graney K, Shmookler B and Malawer MM.
[7] Ferguson WS and Goorin AM. Current treat-ment of osteosarcoma. Cancer Invest 2001; 19: 292-315.
[8] Ferrari S, Smeland S, Mercuri M, Bertoni F,
Longhi A, Ruggieri P, Alvegard TA, Picci P,
Capanna R and Bernini G. Neoadjuvant che -motherapy with dose Ifosfamide, high-dose methotrexate, cisplatin, and doxorubicin for patients with localized osteosarcoma of the extremity: a joint study by the Italian and Scandinavian Sarcoma Groups. J Clin Oncol 2005; 23: 8845-8852.
[9] Pahl JH, Santos SJ, Kuijjer ML, Boerman GH, Sand LG, Szuhai K, Cleton-Jansen A, Egeler RM, Boveé JV and Schilham MW. Expression of
the immune regulation antigen CD70 in osteo-sarcoma. Cancer Cell Int 2015; 15: 31. [10] Shen JK, Cote GM, Choy E, Yang P, Harmon D,
Schwab J, Nielsen GP, Chebib I, Ferrone S and Wang X. Programmed cell death ligand 1 ex-pression in osteosarcoma. Cancer Immunol Res 2014; 2: 690-698.
[11] Lussier DM, O’Neill L, Nieves LM, McAfee MS,
Holechek SA, Collins AW, Dickman P, Jacobsen
J, Hingorani P and Blattman JN. Enhanced
T-Cell Immunity to Osteosarcoma Through
Antibody Blockade of PD-1/PD-L1 Interactions.
J Immunother 2015; 38: 96-106.
[12] Zheng W, Xiao H, Liu H and Zhou Y. Expression of programmed death 1 is correlated with pro-gression of osteosarcoma. APMIS 2015; 123: 102-7.
[13] Kawakami T, Furukawa Y, Sudo K, Saito H,
Takami S, Takahashi E and Nakamura Y. Isolation and mapping of a human gene (PDCD2) that is highly homologous to Rp8, a rat gene associated with programmed cell death. Cytogenet Genet Res 1995; 71: 41-3. [14] Owens GP, Hahn WE and Cohen JJ. Identification
of mRNAs associated with programmed cell
death in immature thymocytes. Mol Cell Biol
1991; 11: 4177-4188.
[15] Mu W, Munroe RJ, Barker AK and Schimenti JC.
PDCD2 is essential for inner cell mass devel-opment and embryonic stem cell
mainte-nance. Develop Biol 2010; 347: 279-288.
[16] Minakhina S, Druzhinina M and Steward R. Zfrp8, the Drosophila ortholog of PDCD2, func-tions in lymph gland development and controls cell proliferation. Development 2007; 134: 2387-2396.
[17] Barboza N, Minakhina S, Medina DJ, Balsara B, Greenwood S, Huzzy L, Rabson AB, Steward
R and Schaar DG. PDCD2 functions in cancer cell proliferation and predicts relapsed
leuke-mia. Cancer Biol Ther 2013; 14: 546-555.
[18] Zhang J, Wei W, Jin HC, Ying RC, Zhu AK and
Zhang FJ. Programmed cell death 2 protein in-duces gastric cancer cell growth arrest at the early S phase of the cell cycle and apoptosis in a p53-dependent manner. Oncol Rep 2015;
[19] Li X, Xu K, Li W, Qiu X, Ma B, Fan Q and Li Z.
Immunologic response to tumor ablation with irreversible electroporation. PLoS One 2012; 7: e48749.
[20] Yu Z, Sun H, Fan Q, Long H, Yang T and Ma Ba.
Establishment of reproducible osteosarcoma rat model using orthotopic implantation
tech-nique. Oncol Rep 2009; 21: 1175-1180.
[21] Baron BW, Hyjek E, Gladstone B, Thirman MJ and Baron JM. PDCD2, a protein whose expres
-sion is repressed by BCL6, induces apoptosis
in human cells by activation of the caspase
cascade. Blood Cell Mol Dis 2010; 45:
169-175.
[22] Fan CW, Chan CC, Chao C, Fan HA, Sheu DL and Chan EC. Expression patterns of cell cycle and apoptosis-related genes in a multidrug-re-sistant human colon carcinoma cell line. Scand J Gastroenterol 2004; 39: 464-469. [23] Hung K, Hayashi R, Lafond-Walker A,
Lowenstein C, Pardoll D and Levitsky H. The central role of CD4+ T cells in the antitumor immune response. J Exp Med 1998; 188: 2357-2368.
[24] Pardoll DM and Topalian SL. The role of CD4+ T cell responses in antitumor immunity. Curr Opin Immunol 1998; 10: 588-594.
[25] Toes RE, Ossendorp F, Offringa R and Melief CJ. CD4 T cells and their role in antitumor im-mune responses. J Exp Med 1999; 189: 753-756.
[26] Cohen PA, Peng L, Plautz GE, Kim JA, Weng DE
and Shu S. CD4+ T cells in adoptive immuno-therapy and the indirect mechanism of tumor rejection. Crit Rev Immunol 2000; 20: 17-56. [27] Greenberg PD. Adoptive T cell therapy of
tu-mors: mechanisms operative in the recogni-tion and eliminarecogni-tion of tumor cells. Adv Immunol 1991; 49: 281-355.
[28] Cho Y, Miyamoto M, Kato K, Fukunaga A, Shichinohe T, Kawarada Y, Hida Y, Oshikiri T, Kurokawa T, Suzuoki M, Nakakubo Y, Hiraoka K, Murakami S, Shinohara T, Itoh T, Okushiba S, Kondo S and Katoh H. CD4+ and CD8+ T
cells cooperate to improve prognosis of
pa-tients with esophageal squamous cell carcino -ma. Cancer Res 2003; 63: 1555-1559. [29] Rosenberg SA, Yang JC, Schwartzentruber DJ,
Hwu P, Marincola FM, Topalian SL, Restifo NP, Dudley ME, Schwarz SL and Spiess PJ. Immunologic and therapeutic evaluation of a synthetic peptide vaccine for the treatment of patients with metastatic melanoma. Nat Med 1998; 4: 321.
[30] Huang H, Li F, Gordon JR and Xiang J. Synergistic enhancement of antitumor
immu-nity with adoptively transferred tumor-specific