Simulation of
A
˜
1B
1\
X
˜
1A
1CF
2single vibronic level emissions:
Including anharmonic and Duschinsky effects
Foo-Tim Chaua)
Department of Applied Biology and Chemical Technology, Hong Kong Polytechnic University, Hung Hom, Kowloon, Hong Kong
John M. Dyke and Edmond P. F. Lee
Department of Chemistry, University of Southampton, Highfield, Southampton SO17 1BJ, United Kingdom
Daniel K. W. Mok
Department of Applied Biology and Chemical Technology, Hong Kong Polytechnic University, Hung Hom, Kowloon, Hong Kong
共Received 18 June 2001; accepted 10 July 2001兲
CASSCF/MRCI/aug-cc-pVQZ共no g兲and RCCSD共T兲/aug-cc-pVQZ potential energy functions were reported for the A˜ 1B1 and X˜ 1A1 states of CF2, respectively. Vibrational wave functions of the
symmetric stretching and bending modes of the two states of CF2 were obtained in variational
calculations, employing Watson’s Hamiltonian for a nonlinear molecule and anharmonic vibrational wave functions expressed as linear combinations of harmonic basis functions. Franck–Condon factors共FCFs兲were computed for A˜ 1B1→X˜ 1A
1CF2single vibronic level共SVL兲emissions and the
SVL emission spectra were simulated with the computed FCFs. When compared with the observed spectra, the simulated spectra obtained in the present investigation, which include allowance for anharmonicity and the Duschinsky effect, were found to be significantly superior to those reported previously, based on the harmonic oscillator model. Using the iterative Franck–Condon analysis procedure, with the geometry of the X˜ 1A1 state fixed at the recently determined experimental
equilibrium geometry, the geometry of the A˜ 1B1state of CF2, which gave the best match between simulated and observed spectra, was found to be re(CF兲⫽1.317 Å and e(FCF)⫽121.25 °. © 2001 American Institute of Physics. 关DOI: 10.1063/1.1398103兴
I. INTRODUCTION
Recently, we have reported simulated spectra of A˜ 1B1 →X˜1A1CF2single vibronic level共SVL兲emissions,
employ-ing our Franck–Condon factor共FCF兲code, CART-FCF. This is based on the harmonic oscillator model and includes Duschinsky rotation 共see Ref. 1 for details兲. The observed
A
˜ 1B1→X˜ 1A
1 CF2 SVL emissions consist of very long
vi-brational progressions in the bending mode. Comparison be-tween the simulated1 and observed spectra2 led to the con-clusion that the harmonic oscillator model employed in the simulations was inadequate for high vibrational levels of the
X ˜ 1A
1state involved in the electronic transition. Recently, we
have reviewed existing FCF methods, which include anhar-monic effects.1,3 In a prior article,1 a simple approach of incorporating anharmonicity in multidimensional FCF calcu-lations was proposed. In a later article,3 we reported our recently developed AN-FCF code, which includes both an-harmonicity and Duschinsky effects, and its first application to the simulation of the HeI photoelectron spectrum of ClO2. In the present study, with the AN-FCF code, we
present significantly improved simulated spectra of A˜ 1B1 →X˜ 1A1 CF2 SVL emissions, employing CASSCF/MRCI/
aug-cc-pVQZ共no g兲 and RCCSD共T兲/aug-cc-pVQZ potential energy functions 共PEFs兲 of the two electronic states in-volved.
Earlier experimental and theoretical studies on the A˜ 1B1
and X˜ 1A
1 states of CF2, which have been discussed in Ref.
1, will not be repeated here. Nevertheless, a few very recent publications, which are relevant to the present study, should be mentioned. Firstly, Margules et al.4 derived equilibrium geometrical parameters of the X˜ 1A1 state of CF2 from
ex-perimental rotational constants共Aeand Be兲, which were re-ported in previous high-resolution spectroscopic studies,5–7 giving values of 1.2975 Å and 104.81° for re(CF) and
e(FCF), respectively. These authors also estimated the equilibrium geometrical parameters of reandeas 1.297共2兲 Å and 104.78共2兲°, respectively, from the highly reliable av-eraged geometrical parameters of rav⫽1.3035⫾0.0001 Å
and av⫽104.778⫹0.02/⫺0.008° 共Ref. 8兲. These two sets
of experimentally derived equilibrium geometrical param-eters agree well with each other and also with the best ab
initio estimates of 1.2972 Å and 104.858° available at that
time关at the RCCSD共T兲/共cc-pVQZ plus augmented functions on F only兲level, with all electrons correlated; see Ref. 4兴. It was concluded that the best theoretical re agreed with the derived experimental value to⫾0.0003 Å.
Second, in an ab initio study on F2CC, Breidung and
Thiel9 reported CCSD共T兲/aug-cc-pCVQZ 共all electron兲
cal-a兲Electronic mail: [email protected]
5816
culations on CF2. This is at present the highest level of cal-culation on CF2. The computed equilibrium geometry ob-tained at this level of calculation was re⫽1.2981 Å ande
⫽104.85° and was compared with the experimental equilib-rium geometry derived by Margules et al.,4so as to establish error estimates in the computed restructure at the same level of calculation for F2CC. It was concluded that computed
geometrical parameters at this level of calculation are reli-able to within 0.0006 Å and 0.04° for equilibrium bond lengths and angles, respectively.
Third, in an ab initio investigation of halocarbene, Schwartz and Marshall10 carried out geometry optimization on a number of halocarbenes, including CF2, at the
QCISD/6-311G*level and quoted experimental equilibrium geometrical parameters of 1.3035⫾.0001 Å and 104.78
⫾0.02° for the X˜ 1A1state of CF2.11It should be noted that these experimental values of reande are actually identical to the rav andav values of Kirchhoff et al.8determined by
microwave spectroscopy; they are probably the averaged val-ues rather than the equilibrium valval-ues.
Fourth, Sendt and Bacskay performed CASSCF, CASPT2, and CCSD共T兲 calculations on the X˜ 1A1, a˜ 3B1,
and A˜ 1B1states of CX2, where X⫽F, Cl, and Br, employing
the cc-pVTZ basis set.12Among a large number of computed spectroscopic constants, the discrepancies, which were sig-nificant, between the computed harmonic vibrational fre-quencies obtained at higher levels of calculation 关CASPT2, CCSD共T兲, and also MRCI兴 and the observed fundamental frequencies of the two stretching modes of the A˜ 1B
1state of
CF2, particularly the asymmetric stretch, were discussed. The authors of this work were convinced that further im-provement in the methodology and/or basis set would not reduce the discrepancies and suggested that they were prob-ably due to the neglect of anharmonicities in the computed values. It should be mentioned that, in Ref. 1, we have dis-cussed the large range of the computed values of the asym-metric stretching harmonic frequencies of the A˜ 1B1 state of
CF2 based on the results of our CASSCF and MP2
calcula-tions and the earlier CASSCF results of Cameron et al.13It was pointed out that better agreement for the asymmetric stretch of the A˜ 1B1 state of CF2 between the computed
CASSCF harmonic frequencies and the observed fundamen-tal frequency were only obtained with CASSCF calculations, which employed a large active space.1 It appears that the shape of the potential energy surface in the asymmetric stretching coordinate of the A˜ 1B
1 state of CF2 is very
sen-sitive to the level of calculation. It was also pointed out that the computed bond angle of the A˜ 1B1 state of CF2 is
sensi-tive to the level of calculation.1
Last, to our knowledge, the only PEFs available for CF2
are the three-dimensional CASSCF/关7s4 p2d兴 potential en-ergy surfaces of the ground electronic state by Peterson
et al.14
II. THEORETICAL CONSIDERATIONS AND COMPUTATIONAL DETAILS
The theoretical method employed in the anharmonic FCF code, AN-FCF, used in this study has been presented
previously in Ref. 3. Therefore only an outline of the method and some technical details, which are specific to the present study, are given below.
For each electronic state involved in the emission pro-cess, the potential energy function, V, was determined by fitting the following polynomial to an appropriate number of CASSCF/MRCI/aug-cc-pVQZ共no g兲 or RCCSD共T兲 /aug-cc-pVQZ single point energies关for the A˜ 1B1 or X˜ 1A1 states of
CF2, respectively兴:
V⫽
兺
i j
Ci j共S1兲i共S2兲j⫹Veqm. 共1兲
The PEFs are expressed in terms of a Morse type coordinate:15
S1⫽关1⫺e⫺␥共r⫺reqm兲/reqm兴/␥,
and a bending coordinate suggested by Carter and Handy:16
S2⫽⌬⫹␣⌬2⫹⌬3,
where r is the CF bond length, and⌬is the displacement in the F–C–F bond angle. By restricting the gradient of S2 to
zero when the molecule is linear 共i.e.,⫽兲, the following expression relating to ␣andcan be obtained:16
⫽关1⫹3␣共⫺eqm兲2兴/关⫺2共⫺eqm兲兴.
The nonlinear least-squares fit procedure,17 NL2SOL, was employed to obtain the Ci j’s, Veqm, reqm, eqm,␣, and
␥from the computed single point energy data set. The asym-metric stretching modes of the two states considered have been ignored, because the observed SVL emission spectra do not show vibrational structure in the asymmetric stretch2and the computed FCFs involving the asymmetric stretching modes, obtained based on the harmonic oscillator model, have negligible relative intensities.1
Terms of up to the fifth order and also the C06 and the
C60terms were included in the PEF关Eq.共1兲兴of each of the
two states involved in the emissions. As the SVL spectra consist of very long progressions in the bending mode of the ground electronic state, higher order terms in the bending mode, C07 and C08, were added only to the PEF of the
ground state. The numbers of single point RCCSD共T兲 /aug-cc-pVQZ total energies evaluated were 100 for the ground state of CF2 covering ranges of 1.1 Å⭐r⭐1.745 Å and
75°⭐⭐154°. For the A˜ 1B1 state, 40
CASSCF/MRCI/aug-cc-pVQZ total energies covering the ranges of 1.1 Å⭐r ⭐1.4 Å and 91°⭐⭐160° were evaluated. The CASSCF/ MRCI/aug-cc-pVQZ共no g兲 and RCCSD共T兲/aug-cc-pVQZ energy calculations were performed using the MOLPRO suite of programs,18,19with three 1s core orbitals frozen in the correlation treatment. In the CASSCF and MRCI calculations20,21on the open-shell singlet excited A˜ 1B1state,
oscillator functions, h(v1,v2), where v1 andv2 denote the
quantum numbers of the harmonic basis functions for the symmetric stretching and bending mode, respectively 共see Ref. 3 for details兲. Harmonic basis functions up to h(10,30) with the restriction of v1⫹v2⬍30 were employed for the ground state calculation. For the A˜ 1B1 state, harmonic basis
functions of up to h(10,15) with the restrictionv1⫹v2⬍15 were used. The total numbers of basis functions used in the variational calculations were 286 and 121 for the X˜ 1A1 and
A ˜ 1B
1 states of CF2, respectively.
Since the anharmonic vibrational wave functions are ex-pressed as linear combinations of harmonic basis functions, the anharmonic FCFs can be expressed in terms of the over-lap integrals of the corresponding harmonic functions. The latter were evaluated by the method of Chen24 共for details, see Refs. 1 and 3兲. Vibronic bands in the CF2 SVL emission
spectra, A˜ 1B1→X˜ 1A
1, were simulated, using Gaussian
functions with a full width at half maximum共FWHM兲of 0.3 nm共28 cm⫺1at 325 nm兲, and relative intensities as given by the corresponding computed anharmonic FCFs.
The iterative Franck–Condon analysis共IFCA兲procedure was carried out in the spectral simulation of each SVL emis-sion employing the AN-FCF code共see Ref. 3 for details兲. In the IFCA procedure, the geometry of the X˜ 1A1 state was
fixed to the available experimental equilibrium geometry. The geometrical parameters of the A˜ 1B1 state were initially
chosen according to the computed geometry change on exci-tation from ab initio calculations and were then varied, over a small range, systematically, until a best match between the simulated and observed spectra was achieved. In Ref. 1, ex-perimentally derived geometrical parameters of the A˜ 1B1
state of CF2 were obtained from the IFCA procedure, em-ploying the harmonic CART-FCF code. However, a good match between the simulated and observed spectra was only achieved for a few vibrational components with low quan-tum numbers in the ground electronic state. In the present study with the AN-FCF code, it was possible to obtain a good match throughout the whole spectral band 共see Sec. III兲. In Ref. 1, the r0 geometry of Mathews25was employed
for the X˜ 1A1 state in the IFCA procedure. In the present
study, with the recently available experimentally derived equilibrium geometrical parameters of Margules et al.,4 the geometry of the X˜ 1A1 state of CF2 was fixed at re
[image:3.612.316.560.74.362.2]⫽1.2975 Å ande⫽104.8° in the IFCA procedure. Based on the two sets of experimentally derived geometrical param-eters given in Ref. 4共see Sec. I兲, upper limits of the uncer-tainties associated with these ground state geometrical pa-rameters are probably around ⫾0.0010 Å and⫾0.1° for re anderespectively.
TABLE I. CASSCF/MRCI/aug-cc-pVQZ共no g兲 and RCCSD共T兲 /aug-cc-pVQZ PEF of the A˜1B
1and X˜ 1A
1states of CF2, respectively. a
Parameters X˜1A1 A˜1B1
C20 3.0469 2.7504
C11 0.3986 0.1350
C03 0.2710 0.1241
C30 ⫺5.6472 10.6753
C21 ⫺1.7372 ⫺0.0997
C12 ⫺1.0191 ⫺0.4177
C03 ⫺0.0698 ⫺0.0213
C40 6.2001 48.4845
C22 1.5673 ⫺0.7977
C04 0.2528 0.0373
C31 0.5872 0.2078
C13 2.1408 0.6084
C05 0.1008 0.0984
C06 ⫺0.4663 0.3177
C50 ⫺1.7222 148.2864
C60 ⫺3.2016 181.0831
C41 ⫺0.3516 3.6957
C32 ⫺1.5753 ⫺0.9673
C23 ⫺1.8493 ⫺0.4355
C14 ⫺0.8155 ⫺0.4291
C07 ⫺0.0887 ¯
C08 1.3159 ¯
reqm/Å 1.3008 1.3215
eqm/° 104.754 121.980
␣/radian⫺1 ⫺0.0516 ⫺0.1944
␥ 1.3151 6.9581
aFor each state, the rms deviation of the fitted PEF from the ab initio total
energies is⬍10 cm⫺1. The units for C
i jare hartree radian⫺1.
TABLE II. Anharmonic vibrational wave functions and energies共cm⫺1兲of the first four vibrational levels and the兩0,17典level of the X˜1A
1state of CF2.
Levela Energy Wave function
兩0,17典 11 229.632 0.3372h共0,17兲⫺0.2994h共1,15兲⫺0.2570h共0,22兲 ⫺0.2463h共0,21兲⫹0.2344h共0,18兲⫹0.2300h共0,14兲 ⫺0.2195h共0,23兲⫺0.2112h共0,20兲⫺0.1972h共0,13兲 ⫹0.1937h共1,17兲⫹0.1932h共1,18兲⫺0.1825h共0,16兲 ⫺0.1750h共0,15兲⫺0.1673h共0,24兲⫹0.1617h共2,13兲 ⫹0.1543h共0,12兲⫺0.1489h共2,15兲⫺0.1477h共1,12兲 ⫹0.1467h共1,19兲⫹0.1428h共1,13兲⫺0.1223h共0,25兲 ⫹0.1156h共1,11兲⫹0.1026h共1,20兲
兩0,2典 1336.254 ⫺0.9696h共0,2兲⫺0.1937h共0,3兲⫹0.1172h共0,1兲
兩1,0典 1231.106 0.9870h共1,0兲⫹0.1031h共2,0兲⫹0.0931h共1,1兲
兩0,1典 668.275 ⫺0.9902h共0,1兲⫺0.1179h共0,2兲⫹0.0536h共0,0兲
兩0,0典 0.0 0.9977h共0,0兲⫹0.0536h共0,1兲⫹0.0379h共1,0兲
aNotation used here is兩v
1,v2典for the anharmonic wave function, wherev1is the vibrational quantum number
[image:3.612.127.490.591.738.2]III. RESULTS AND DISCUSSION
The PEFs of the A˜ 1B1and X˜ 1A1states of CF2are given
in Table I. With the selected Ci j terms, and r and ranges
given above, the rms deviations of the fitted PEF from the computed ab initio energies are within 10 cm⫺1 for both electronic states. The anharmonic vibrational wave functions of the first four vibrational levels 兩v1,v2
典
, and theanhar-monic level, 兩0,17典, of the X˜ 1A1 state, and their computed
energies are given in Table II. 共The highest observable level of the X˜ 1A1 state in the SVL emission spectra has v2 at
around 17.兲 With harmonic basis functions of up to
h(10,30), as given above, the computed vibrational energy
of the兩0,17典anharmonic level converged to within 1 cm⫺1in the variational calculation. The effects of a larger harmonic basis set 关up to h(10,50)兴on the computed vibrational ener-gies and anharmonic wave functions were also checked and were found to be negligible.
The deviation of the coefficient of the leading harmonic basis function from unity is a measure of the magnitude of anharmonic effects in the corresponding anharmonic vibra-tional wave function. In Table II, it can been seen that anhar-monic effects are significant, even for low-lying anharanhar-monic vibrational levels of the X˜ 1A1 state of CF2. For the
[image:4.612.317.556.50.352.2]anhar-monic 兩0,17典 level, all harmonic functions with coefficients larger than 0.1 are included in Table II. The highest quantum number of the harmonic basis function, which has a signifi-cant contribution 共with a coefficient of larger than 0.1兲, to this anharmonic level, is v2⫽25. The h(0,26) harmonic function has a coefficient of ⫺0.0846, while all h(0,v2) FIG. 1. Simulated spectra of the A˜1B
1(0,2,0)→X˜ 1A
1CF2single vibronic level共SVL兲emission:共a兲employing the CASSCF/MRCI/aug-cc-pVQZ共no g兲and RCCSD共T兲/aug-cc-pVQZ geometries for the two states, respectively, and共b兲employing the experimental equilibrium geometry from Ref. 4 for the X˜1A1state and the IFCA geometry of re(CF兲⫽1.317 Å ande(FCF) ⫽121.25° for the A˜1B
1state.
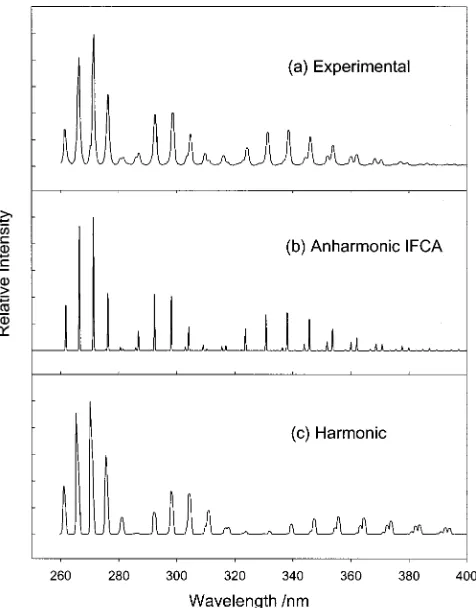
FIG. 2. A˜1B1(0,0,0)→X˜ 1
A1CF2single vibronic level共SVL兲emission:共a兲 experimental spectrum from Ref. 2,共b兲simulated spectrum including anhar-monicity and employing the IFCA geometry of re(CF兲⫽1.317 Å and
[image:4.612.51.299.86.191.2]e(FCF)⫽121.25° for A˜1B1state, and共c兲simulated spectrum based on the harmonic oscillator model关with MP2 force constants and the IFCA geom-etry of re(CF兲⫽1.318 Å ande(FCF)⫽121.6°; Fig. 1 of Ref. 1兴. TABLE III. Comparison of the observed and computed vibrational energies
of the X˜1A
1 state of CF2 obtained from SVL emission spectra共Ref. 2兲, CASSCF PEF共Ref. 14兲and CCSD共T兲PEF共this work兲.
兩v1,v2,v3典 Observed共average兲a Std. dev.a CASSCF RCCSD共T兲
0,1,0 659 20 674 668 1,0,0 1189 47 1230 1231 0,2,0 1327 30 1347 1336 1,1,0 1837 35 1898 1894 0,3,0 1976 20 2019 2003 1,2,0 2477 53 2565 2556 0,4,0 2640 43 2690 2671 1,3,0 3188 32 3232 3218
a
The numbers shown are the averaged values of the observed vibrational spacings in the X˜1A
1 state of CF2, obtained from emissions originated from different vibrational levels of the A˜1
B1state, as given in Ref. 2. Note that the measured vibrational spacings obtained from different SVL emis-sions, as given in Ref. 2, are not the same for the same pairs of vibrational levels in the X˜1A
[image:4.612.54.294.363.696.2]functions with v2 larger than 26 have coefficients smaller
than 0.05. From the computed anharmonic vibrational wave function of the兩0,17典level, it can be concluded that the har-monic basis functions employed in the variational calcula-tions are adequate for the purpose.
Calculated low-lying anharmonic vibrational energies for the first eight levels for excitation in the symmetric stretching mode (1) and the symmetric bending mode (2) relative to the 兩0,0,0典 level of the X˜ 1A1 state of CF2,
em-ploying the RCCSD共T兲PEF reported, are shown in Table III together with those of the CASSCF PEF from Ref. 14. The vibrational energies determined from the SVL spectra of King et al.2 are also included in Table III for comparison. The experimental vibrational energies of the X˜ 1A1 state of
CF2, given in Table III, are averages obtained from different
SVL spectra from different vibrational levels of the A˜ 1B1
state 共see footnote to Table III兲. Based on comparison of calculated and averaged experimental vibrational energies, our CCSD共T兲 PEF appears to be slightly superior to the CASSCF PEF of Peterson et al.14 We have also employed the CASSCF PEF of the X˜ 1A1 state of CF2 关instead of our
RCCSD共T兲PEF; see the later text兴 in the anharmonic FCF calculations. The simulated spectra thus obtained are very similar to those obtained employing our RCCSD共T兲 PEF; small deviations in the relative component intensities be-tween the two simulations arise only from transitions to v2
⬙
⭓8. Comparison between the simulated and observed spectra suggests that the simulated spectra employing the RCCSD共T兲 PEF are slightly superior to those with the CASSCF PEF in the high wavelength region. Subsequently, we will concentrate on the spectral simulations employing our RCCSD共T兲PEF for the X˜ 1A
1 state.
Some selected simulated spectra are shown in Figs. 1– 4. Figure 1共a兲 shows the ‘‘purely’’ theoretical spectrum of the
A
˜ (0,2,0)→X˜ emission, employing the CASSCF/MRCI and
RCCSD共T兲equilibrium geometries for the A˜ 1B1 and X˜ 1A1
states of CF2, respectively,共see Table I兲. Figure 1共b兲shows
the simulated spectrum, which best matches the experimental
A
˜ (0,2,0)→X˜ emission spectrum, obtained with the
experi-mental equilibrium geometry for the X˜ 1A1 state and the
IFCA geometry of re⫽1.317 Å and e⫽121.25° for the
A ˜ 1B
1 state. The differences between these two simulations
are significant. On one hand, these spectra demonstrate the sensitivity of computed FCFs to the relative geometries of the electronic states involved in the transition. On the other hand, they suggest that there is still a small difference be-tween the ab initio relative geometrical parameters of the two states and the true ones.
[image:5.612.323.557.47.374.2]In Figs. 2 and 3, the observed A˜ (0,2,0)→X˜ and
FIG. 3. A˜1B
1(0,2,0)→X˜ 1A
1CF2single vibronic level共SVL兲emission:共a兲 experimental spectrum from Ref. 2,共b兲simulated spectrum including anhar-monicity and employing the IFCA geometry of re(CF兲⫽1.317 Å and
e(FCF)⫽121.25° for A˜1B1state, and共c兲simulated spectrum based on the harmonic oscillator model关with MP2 force constants and the IFCA geom-etry of re(CF兲⫽1.318 Å ande(FCF)⫽121.6°; Fig. 1 of Ref. 1兴.
FIG. 4. Simulated spectra of the A˜1B
1(0,v2,0)→X˜1A1CF2single vibronic level 共SVL兲emissions, forv2⫽0 – 6, employing the CASSCF/MRCI/aug-cc-pVQZ共no g兲and RCCSD共T兲/aug-cc-pVQZ PEF for the two states, re-spectively, the experimental geometry from Ref. 4 for the X˜1A1state and the IFCA geometry of re(CF兲⫽1.317 Å and e(FCF)⫽121.25° for the A
[image:5.612.56.294.49.353.2]A
˜ (0,0,0)→X˜ emissions 关Figs. 2共a兲 and 3共a兲, respectively兴, are compared with the corresponding simulated spectra ob-tained previously within the harmonic oscillator model1
关Figs. 2共c兲and 3共c兲兴and those obtained in the present study with anharmonicity included in the FCF calculations 关Figs. 2共b兲and 3共b兲兴.共Each of the simulated spectra employed the respective IFCA geometry for the A˜ 1B1state; see figure
cap-tions of Figs. 2 and 3.兲It is pleasing to see that the agreement between the simulated and observed spectra is much im-proved when anharmonicity is included. As mentioned above, an excellent match between the simulated and ob-served spectra can be obtained throughout the whole spectral band for each SVL emission. The whole series of SVL
A
˜ (0,v2
⬘
,0)→X˜ emissions, where v2⬘
⫽0 to 6, reported byKing et al.,2 have been simulated and are shown in Fig. 4. The agreement between the simulated and observed spectra for the whole series of SVL emissions is very good.
IV. CONCLUDING REMARKS
Following our preliminary work on the spectral simula-tions of A˜→X˜ CF2 SVL emissions, we have replaced the
harmonic oscillator model used with an anharmonic model and obtained simulated spectra which include anhar-monicity. The significant improvement in the simulated
spectra presented in this work confirms that the discrep-ancies between previously reported simulated spectra ob-tained within the harmonic oscillator model and the observed spectra are mainly due to the lack of allowance for anhar-monicity in the electronic states in the previous FCF calculations. In this study, the CASSCF/MRCI/aug-cc-pVQZ共no g兲 and RCCSD共T兲/aug-cc-pVQZ PEFs employed in the FCF calculations are also of a higher level than the MP2/6-311⫹G(2d f ) and CASSCF/6-31G* calculations used in Ref. 1.
The excellent agreement throughout the whole spectral range between the simulated spectra obtained here and the observed A˜→X˜ CF2SVL emission spectra reported in Ref. 2 is very encouraging. This also suggests that the changes of electronic transition moment across the spectral bands are probably negligibly small. In this connection, the reliability of the IFCA geometry of the A˜ 1B1 state obtained from the
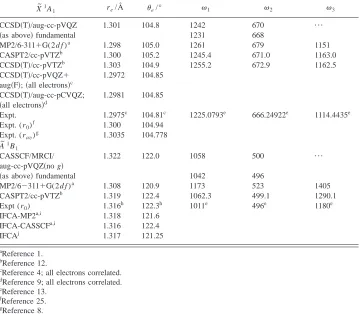
[image:6.612.127.487.77.391.2]present study employing the AN-FCF code is significantly strengthened, as the match between the simulated and ob-served spectra is now almost perfect. Merely based on com-parison of the slightest observable changes in the simulated relative intensities with the smallest changes in the IFCA geometrical parameters, upper limits of the uncertainties as-sociated with the IFCA geometrical parameters are estimated TABLE IV. Summary of some computed and experimental geometrical parameters and vibrational frequencies
共cm⫺1兲of the A˜1B 1and X˜
1A
1states of CF2.
X
˜1A1 re/Å
e/° 1 2 3
CCSD共T兲/aug-cc-pVQZ 1.301 104.8 1242 670 ¯
共as above兲fundamental 1231 668
MP2/6-311⫹G(2d f )a 1.298 105.0 1261 679 1151 CASPT2/cc-pVTZb 1.300 105.2 1245.4 671.0 1163.0 CCSD共T兲/cc-pVTZb 1.303 104.9 1255.2 672.9 1162.5 CCSD共T兲/cc-pVQZ⫹
aug共F兲;共all electrons兲c
1.2972 104.85
CCSD共T兲/aug-cc-pCVQZ; 共all electrons兲d
1.2981 104.85
Expt. 1.2975c 104.81c 1225.0793e 666.24922e 1114.4435e Expt. (r0)
f
1.300 104.94 Expt. (rav)g 1.3035 104.778
A ˜1B
1
CASSCF/MRCI/ aug-cc-pVQZ共no g兲
1.322 122.0 1058 500 ¯
共as above兲fundamental 1042 496
MP2/6⫺311⫹G(2d f )a 1.308 120.9 1173 523 1405
CASPT2/cc-pVTZb 1.319 122.4 1062.3 499.1 1290.1
Expt (r0) 1.316 h
122.3h 1011e 496e 1180e IFCA-MP2a,i 1.318 121.6
IFCA-CASSCFa,i 1.316 122.4
IFCAj 1.317 121.25
a
Reference 1.
bReference 12.
cReference 4; all electrons correlated. dReference 9; all electrons correlated. e
Reference 13.
f
Reference 25.
gReference 8. hReference 26. i
IFCA geometries of the A˜1B1state were obtained employing the CART-FCF code, with the MP2 and CASSCF force constants, respectively, reference 1 for details.
jFrom the present study, employing the ANF-FCF code, with the CASSCF/MRCI and RCCSD共T兲PEF for the
A
˜1
to be⫾0.003 Å and⫾0.3° in reande, respectively, in the
A ˜ 1B
1 state of CF2.
Optimized geometrical parameters and computed vibra-tional frequencies of the two electronic states of CF2 consid-ered, obtained at the highest levels of calculations, and the corresponding experimentally derived values are summa-rized in Table IV. The highest level of calculation on the
X ˜ 1A
1 state of CF2 is the RCCSD共T兲/aug-cc-pCVQZ 共all
electrons correlated兲level from Ref. 9. However, vibrational frequencies are not available at this level. The RCCSD共T兲/ aug-cc-pVQZ level of calculation from the present study is the highest level for computed vibrational frequencies of the
X ˜ 1A
1state. For the A˜ 1B1state of CF2, the CASSCF/MRCI/
aug-cc-pVQZ共no g兲level of this work is the highest level of calculation performed to date. Regarding equilibrium geo-metrical parameters of the A˜ 1B
1 state, the IFCA values
ob-tained from this work should be the most reliable. For both electronic states, the agreement between the computed geo-metrical parameters obtained at the CASSCF/MRCI/aug-cc-pVQZ共no g兲 or RCCSD共T兲/aug-cc-pVQZ levels from this work and the available experimental values are in general fairly good, with bond lengths agreeing to within 0.004 Å and the bond angle agreeing to within 0.7°. Regarding vibra-tional frequencies, we have obtained not only harmonic val-ues, but also fundamentals in the present study for the sym-metric stretching and bending modes of both the X˜ 1A1 and
A ˜ 1B
1 states of CF2. The agreement between the computed
and observed fundamental frequencies is within ⬃30 cm⫺1. In general, the computed fundamental frequencies agree bet-ter with the experimental values than the computed harmonic ones, as expected. Regarding the CASSCF/MRCI and RCCSD共T兲 PEFs reported here, although the asymmetric stretching coordinate has not been considered and the ranges of the bond length covered in the energy scans for the two states may be considered as narrow, the excellent match be-tween the simulated spectra employing these PEFs and the observed spectra suggest that these PEFs are adequate for the purpose of FCF calculations; they are at present the highest level PEFs available for the two states of CF2.
The results of this work, and the results of our earlier article on the simulation of the UV photoelectron bands of ClO2 with this method,
3
strongly suggest that this approach can be applied with confidence to electronic and photoelec-tron spectra of other small polyatomic molecules.
ACKNOWLEDGMENTS
The authors are grateful to the Research Grant Council
共R.G.C.兲 of the Hong Kong Special Administrative Region
共Project POLYU 5180/99P and 5187/00P兲and the Research Committee of the Hong Kong Polytechnic University. Sup-port from the EPSRC共UK兲and the Leverhulme Trust are also acknowledged.
1
F. T. Chau, J. M. Dyke, E. P. F. Lee, and D. C. Wang, J. Electron Spec-trosc. Relat. Phenom. 97, 33共1998兲.
2S. D. King, P. K. Schenck, and J. C. Stephenson, J. Mol. Spectrosc. 78, 1 共1979兲.
3
D. K. W. Mok, E. P. F. Lee, F. T. Chau, D. C. Wang, and J. M. Dyke, J. Chem. Phys. 113, 5791共2000兲.
4L. Margules, J. Demaison, and J. E. Boggs, J. Phys. Chem. A 103, 7732 共1999兲.
5A. Charo and F. C. DeLucia, J. Mol. Spectrosc. 94, 363共1982兲. 6
J. B. Burholder, C. J. Howard, and D. A. Hamilton, J. Mol. Spectrosc. 127, 362共1988兲.
7H.-B. Qian and D. B. Davies, J. Mol. Spectrosc. 169, 201共1995兲. 8W. H. Kirchhoff, D. R. Lide, Jr., and F. X. Powell, J. Mol. Spectrosc. 47,
491共1993兲.
9
J. Breidung and W. Thiel, J. Mol. Spectrosc. 205, 28共2001兲.
10M. Schwartz and P. Marshall, J. Phys. Chem. A 103, 7900共1999兲.
11Thermodynamic Properties of Individual Substances, edited by L.
Gurvich, I. V. Veyts, and C. B. Alcock共Hemisphere, New York, 1992兲, Vol. 2.
12K. Sendt and G. B. Bacskay, J. Chem. Phys. 112, 2227共2000兲. 13M. R. Cameron, S. H. Kable, and G. B. Bacskay, J. Chem. Phys. 103,
4476共1995兲.
14
K. A. Peterson, R. C. Mayrhofer, E. L. Sibert III, and R. C. Woods, J. Chem. Phys. 94, 414共1991兲.
15W. Meyer, P. Botschwina, and P. Burton, J. Chem. Phys. 84, 891共1986兲. 16S. Carter and N. C. Handy, J. Chem. Phys. 87, 4294共1987兲.
17J. E. Dennis, Jr., D. M. Gay, and R. E. Welsh, ACM Trans. Math. Software 7, 348共1981兲; ibid. 7, 369共1981兲.
18
MOLPRO is a package of ab initio programs by H.-J. Werner and P. J. Knowles, with contributions from J. Almlo¨f, R. D. Amos, A. Berning
et al.
19P. J. Knowles, C. Hampel, and H. J. Werner, J. Chem. Phys. 99, 5219 共1993兲.
20H.-J. Werner and P. J. Knowles, J. Chem. Phys. 82, 5053共1985兲. 21H.-J. Werner and P. J. Knowles, J. Chem. Phys. 89, 5803共1988兲. 22E. R. Davidson, Chem. Phys. Lett. 52, 403共1977兲.
23
J. K. G. Watson, Mol. Phys. 19, 465共1970兲.
24
P. Chen, in Unimolecular and Bimolecular Reaction Dynamics, edited by C. Y. Ng et al.共Wiley, New York, 1994兲, pp. 371– 425.
25C. W. Matthews, Can. J. Phys. 45, 2355共1967兲.