Differences in the composition of total and whey
proteins in goat and ewe milk and their changes
throughout the lactation period
A. Hejtmánková
1, V. Pivec
1, E. Trnková
1, H. Dragounová
21Department of Chemistry, Faculty of Agrobiology, Food and Natural Resources, Czech University of Life Sciences Prague, Prague, Czech Republic
2Dairy Research Institute Ltd., Prague, Czech Republic
ABSTRACT: This study was conducted to evaluate changes in composition of whey proteins of Czech White Short-haired goat and East Friesian ewe milk and their comparison throughout lactation. Some differences in composition between ewe and goat milk were found. The results showed that the mean total protein (%), whey protein (g/100 g), and β-lactoglobulin (β-Lg, g/100 g) contents of goat milk were 2.75, 0.433, and 0.119 respectively and of ewe milk 6.36, 1.11, and 0.732 respectively. The contents of total protein as well as acid whey proteins in goat milk were nearly constant throughout the lactation period and fluctuated around the mean value while the contents of total protein as well as acid whey proteins in ovine milk were dependent on the period of lactation. The total protein content in ovine milk continuously increased during the lactation period. A higher content of ovine acid whey proteins was noticed at the beginning and in the final period of lactation. The average ratio of whey to total protein was 15.8 ± 2.61% in goat milk and 17.4 ± 2.68% in ewe
milk and ranged from 13.0 to 20.4% in goat and from 14.0 to 20.8% in ewe milk. The total contents of two major whey proteins. α-lactalbumin and β-lactoglobulin (α-La + β-Lg = AG), averaged 87% of total whey protein, 92% in ovine milk. The main component of acid whey proteins in goat milk was α-La while in ovine milk the main component of acid whey proteins was β-Lg, however, at the end of the lactation period the content of β-Lg for both kinds of milk increased steeply, and the β-Lg/α-La ratio reached a maximum value of 1.94 in goat milk and of 9.74 in ewe milk. In addition, goat milk contains a similar amino acid profile to ewe milk but the amino acid pattern in whey proteins differs from that in milk. Total essential amino acids were approximately 40% of the total amino acids in goat and ewe milk as well as in goat and ewe whey.
Keywords: total proteins; whey proteins; β-lactoglobulin; α-lactalbumin; amino acids; goat; ewe
Sheep and goat breeding has recently expanded in the Czech Republic, primarily on private farms with direct cheese production. Goat and ewe cheeses are a non-traditional commodity and an increasing interest in these foodstuffs is evident. The consum-ers consider goats and ewes ecologically breeded animals and the products from them are increas-ingly adapted to maintain human health. The White Short-haired (WSH) goat and East Friesian ewe (EF)
are the most significant Czech breeds used for pro-duction of milk processed into goat and ewe cheeses. The cheese quality depends closely on the com-position and quality of milk. Protein contents vary widely within species, and are influenced by breed, stage of lactation, feeding, climate, parity, season, and udder health status (Park et al., 2007).
A large amount of whey is produced by the cheese-making process. Whey proteins keep even higher
nutritive value than casein. Due to suitable compo-sition of their amino acids, whey proteins represent one of the best-quality sources of readily available proteins. Whey is also a high-quality source of vitamins and mineral substances (Sinkiewicz and Riedel, 1990). Although whey proteins keep a high nutritive value, only a small part of them is used as human nourishment in Central Europe. One of the possibilities is žinčica, a drink made from sheep milk whey similar to kefir or sydora from goat milk whey and urda sheep whey cheese.
According to most studies, milk whey proteins account for approximately 20% of total proteins. β-lactoglobulin (β-Lg) and α-lactalbumin (α-La) are the most important whey proteins due to their high content in total whey proteins and significance for the food industry (Janovič et al., 2005). α-La and β-Lg are strongly correlated with the nutritional value and the functional properties (i.e. gelling, film-forming, foaming, and emulsifying) of whey and whey products (De Wit, 1989; Kinsella and Whitehead, 1989; Casper et al., 1999).
Goat as well as ewe wheys have a unique whey protein composition compared to bovine whey (Moatsou et al., 2005), in which β-Lg represents approximately 50% and α-La 25% (Walzem, 1999). Ewe whey is especially rich in proteins (Alichanidis and Polychroniadou, 1996; Pintado et al., 1999). The main characteristics of ewe acid whey are a high level of β-Lg and a low α-La percentage. In general, the β-Lg percentage of goat acid whey is lower compared to ewe acid whey. The β-Lg/α-La ratio depends on the type of breed, and differences in the β-Lg/α-La ratios could be related to differ-ent functional properties of the individual wheys (Moatsou et al., 2005). However, limited studies on the distribution of individual proteins in ewe and goat whey and the lactational variance have been published (Pintado and Malcata, 1996; Fellippe and Law, 1997; Casper et al., 1998).
The HPLC determination of whey proteins can also be used for detection of adulteration of one type of milk by another (Frutos et al., 1991; Romero et al., 1996; Ferreira and Cacote, 2003; Borková and Snášelová, 2005).
The objective of this study was to determine the changes in the amount of total protein and amount and composition of major acid whey proteins in Czech White Short-haired breed goat and East Friesian breed ewe milk throughout the lactation period. The differences in protein composition be-tween goat and ewe milk were also observed.
MATERIAL AND METHODS
Collection of milk samples
Bulk goat’s milk samples from one flock of goats of the Czech White Short-haired breed (about 400 heads) from southern Moravia were collected monthly throughout the whole lactation period (March to October). Kidding was in the course of March and April and lactation lasted for 8 months. The daily feeding ration consisted of oats haylage with the addition of pea plant (Pisum sativum
subsp. arvense), grass hay, fodder barley, crushed wheat, and forage straw. The goats were watered with whey from treated milk.
Bulk sheep milk samples from one flock of ewes of East Friesian breed (about 50 heads) in their second lactation period from eastern Bohemia were collected monthly throughout the whole lactation from June to October. Kidding was in April–May and lactation lasted for 7 months. The feeding ra-tion consisted of pasture with the addira-tion of hay and fodder barley.
No mineral supplements containing additives, which could intentionally change the composition of milk, were fed. The samples were taken after the colostrum period.
The samples were cooled to 4°C. Concentrations of total protein were determined immediately after sample transportation to the laboratory. The por-tions of each sample were stored at –20°C until the whey proteins and amino acids analyses.
Compositional analysis
Concentrations of total protein (TP) were deter-mined by near infrared absorption spectroscopy (Milco Scan 133B FOSS Electrics, FOSS, Hillerød, Denmark) calibrated monthly.
The total undenaturated acid whey proteins, α-La and β-Lg, were determined by size-exclusion chro-matography (SEC) using photo diode array detector (PDA) according to IDF-Standard 162-2002. The substances eluting in retention time 8.5–12 min are considered as whey proteins. The total amount of whey proteins is expressed in concentration of β-Lg (tr = ca. 10.8 min).
detection (FD) according to Waters AccQ TagTM
Method. The Method is based on a derivatizing reagent Waters AccQ FluorTM developed
specifi-cally for amino acids analysis. Milk samples were placed in an autoclave and hydrolyzed using 6M hydrochloric acid in a laboratory dryer at 145°C for 4 h.
Tryptophan is destroyed by acid hydrolysis (McKenzie, 1970), therefore its values are not reported. Because glutamine is converted to glu-tamate and asparagine to aspartate during the hydrolysis, the values reported as glutamate in-clude both glutamate and glutamine and those for aspartate include both aspartate and asparagine. Total amino acid concentration is the sum of all particular amino acids analysed. Tryptophan was not included in the amino acid concentration. The amino acid pattern of milk is defined as the amount of each particular amino acid divided by the total amount of amino acids.
All of the used chemical substances including wa-ter were either of HPLC or p.a. quality. Samples were analysed in triplicate (milk samples were taken on 3 consecutive days).
Statistical analysis
Data were statistically analysed using ANOVA (method of one-way analysis of variance by the multiple mean comparison method and probability level either 95 or 99% implemented into software program STATISTICA CZ 9 version) procedure of SAS (SAS, 2001). The studied factors were breed, month of sample collection, and type of proteins. Milk samples in triplicate were analyzed monthly and the average of each variable was used for mean comparison between the months of lactation.
Statistical evaluation of the differences be-tween goat and ewe milk quality. The following parameters were evaluated: total protein content, total undenaturated acid whey protein content (TWP), content of β-lactoglobulin (β-Lg), sum of β-lactoglobulin and α-lactalbumin (AG), β-Lg/AG, β-Lg/TWP, and AG/TWP.
The breed was the factor, individual monthly samplings were considered as individual occur-rences.
Evaluated parameters − amino acids.For the purpose of statistical evaluation (representation of amino acids in (1) total protein of goat and ewe milk, (2) total undenatured acid whey protein of
goat and ewe milk, (3) total and whey goat protein, (4) total and whey ewe protein), four experimental data sets were created and evaluated for each amino acid separately.
Individual occurrences correspond to the rep-resentation of the amino acids in the sample in a monthly sampling (8 samples of goat milk and 5 samples of ewe milk).
Statistical evaluation of the differences in goat and ewe milk quality between the months of lac-tation. All the monitored parameters of goat and ewe milk were evaluated separately. The month of the sample collection was the factor. If there were significant effects of the period of lactation (month), Tukey’s HSD test was used to locate sig-nificant differences between the means.
RESULTS AND DISCUSSION
Concentrations of total and acid whey proteins
The differences in contents of total protein and total acid whey protein in goat and sheep milk (P < 0.01) were determined.
accordance with Chornobai et al. (1999), Aganga et al. (2002), Soryal et al. (2005), and Kuchtík et al. (2008). The initial higher protein content reported by Zeng and Escobar (1996) was not recorded as the samples were taken after the colostrum period.
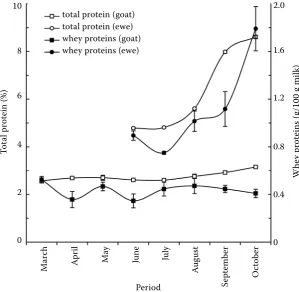
Progression of the total acid whey protein tion curve is similar to that of the protein lacta-tion curve (Figure 1). Whey proteins content in goat milk showed fluctuations around the mean value 0.433 g/100 g in the concentration range from 0.346 to 0.524 g/100 g. Total ewe acid whey protein content exhibited a descending phase in early lacta-tion after reaching the trough (the second month of lactation) followed by an ascending phase in the concentration range from 0.749 to 1.791 g/100 g. The highest contents of whey proteins were noticed in the beginning and at the final stage of lactation. It has recently been shown that the concentration of whey component related to support of the im-mune system increased toward the end of lactation (Leitner at al., 2011).
The mean value of whey protein contents in to-tal protein was 15.8 ± 2.61% in goat milk and 17.4 ± 2.68%in ewe milk, respectively . In both cases it is less than the commonly given value of 20%. The range of the determined value in WSH goat milk (13.0–20.4%) is, however, similar to the findings of Albenzio et al. (2006) in Garganica goat milk (10.3–16.7%) and the
range of the determined value (14.0–20.8%) in EF ewe milk is similar to the values (17–22%) given by Park et al. (2007) in ewe milk generally. The coefficient of variation is very similar – 15.4% in ewe milk and 16.6% in goat milk, respectively.
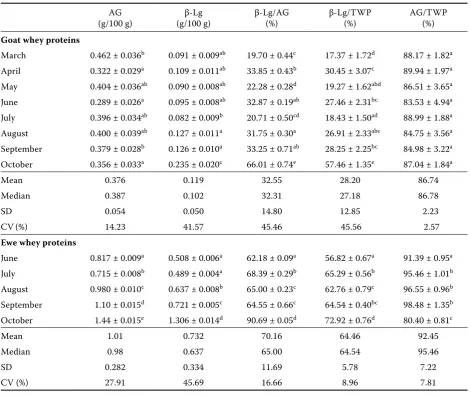
Concentrations of β-lactoglobulin and α-lactabumin
Attention was paid particularly to the deter-mination of β-Lg and α-La in ewe and goat milk (Table 1). The total content of these two major whey proteins (AG) represented on average in ewe milk 92.4 ± 7.22% and in goat milk 86.7 ± 2.23% of the total whey protein.Differences (P < 0.05) in the content of all monitored parameters (Table 1) with the exception of the representation of the AG/TWP between goat and ewe milk were found.
[image:4.595.64.364.83.375.2]It is also known that goat’s whey contains minor components which, although present at low con-centrations, can influence profound metabolic, im-munological and physiological processes and thus contribute to some of the key advantages of goat milk in developing nutritional products (Silanikove et al., 2010). Thus, in future studies it would be in-teresting to follow the changes of other components of the whey fraction in different stages of lactation.
Figure 1. Changes of the total and whey proteins in the goat and ewe milk throughout the lactation period
Tot
al pr
ot
ein (%)
Whe
y pr
ot
eins (
g/100 g milk)
Mar
ch
A
pr
il
M
ay
June July
A
ug
ust
Se
pt
emb
er
O
cto
ber
Period 10
8
6
4
2
0
2.0
1.6
1.2
0.8
0.4
0 total protein (goat)
Although the content of acid whey proteins in ewe milk increased in the second half of the lac-tation period, the percentage of AG in ewe acid whey proteins significantly decreased (P < 0.01) at the end of the lactation period. The content of acid whey proteins in milk as well as the percent-age of AG in acid whey proteins fluctuated around the mean value. Ewe whey contained significantly more β-Lg than did goat whey. These relationships were consistent with previous reports (Law, 1995; Pintado and Malcata, 1996; Casper et al., 1998; Pintado et al., 1999; Moatsou et al., 2005).
Concentration of β-Lg in ewe milk was always higher than that of α-La. Concentration of β-Lg in goat milk was, with the exception of the end of the lactation period, always lower than the
concentra-tion of α-La. The average β-Lg/α-La ratio in EF ewe milk was 3.44 and ranged from 1.65 to 9.74 during the lactation period. The average β-Lg/α-La ratio in WSH goat milk was 0.59 and ranged from 0.25 to 1.94 during the lactation period.
At the end of the lactation period the β-Lg/α-La ratio was consistently the highest (P < 0.01). The average β-Lg/α-La ratio given by Moatsou et al. (2005) for the other ewe breeds ranged from 3.91 to 6.65 and was always higher than that for the East Friesien breed. Accordingly, the β-Lg/α-La ratio for the other goat breeds ranged from 2.02 to 3.04 and it was also always higher than that for the Czech White Short-haired breed.
[image:5.595.63.535.99.497.2]The highest concentration of β-Lg in both ewe and goat milk was consistently found at the end
Table 1. Changes in the content of goat and ewe whey proteins throughout the lactation period
AG
(g/100 g) (g/100 g)β-Lg β-Lg/AG(%) β-Lg/TWP(%) AG/TWP(%)
Goat whey proteins
March 0.462 ± 0.036b 0.091 ± 0.009ab 19.70 ± 0.44c 17.37 ± 1.72d 88.17 ± 1.82a
April 0.322 ± 0.029a 0.109 ± 0.011ab 33.85 ± 0.43b 30.45 ± 3.07c 89.94 ± 1.97a
May 0.404 ± 0.036ab 0.090 ± 0.008ab 22.28 ± 0.28d 19.27 ± 1.62abd 86.51 ± 3.65a
June 0.289 ± 0.026a 0.095 ± 0.008ab 32.87 ± 0.19ab 27.46 ± 2.31bc 83.53 ± 4.94a
July 0.396 ± 0.034ab 0.082 ± 0.009b 20.71 ± 0.50cd 18.43 ± 1.50ad 88.99 ± 1.88a
August 0.400 ± 0.039ab 0.127 ± 0.011a 31.75 ± 0.30a 26.91 ± 2.33abc 84.75 ± 3.56a
September 0.379 ± 0.028b 0.126 ± 0.010a 33.25 ± 0.71ab 28.25 ± 2.25bc 84.98 ± 3.22a
October 0.356 ± 0.033a 0.235 ± 0.020c 66.01 ± 0.74e 57.46 ± 1.35e 87.04 ± 1.84a
Mean 0.376 0.119 32.55 28.20 86.74
Median 0.387 0.102 32.31 27.18 86.78
SD 0.054 0.050 14.80 12.85 2.23
CV(%) 14.23 41.57 45.46 45.56 2.57
Ewe whey proteins
June 0.817 ± 0.009a 0.508 ± 0.006a 62.18 ± 0.09a 56.82 ± 0.67a 91.39 ± 0.95a
July 0.715 ± 0.008b 0.489 ± 0.004a 68.39 ± 0.29b 65.29 ± 0.56b 95.46 ± 1.01b
August 0.980 ± 0.010c 0.637 ± 0.008b 65.00 ± 0.23c 62.76 ± 0.79c 96.55 ± 0.96b
September 1.10 ± 0.015d 0.721 ± 0.005c 64.55 ± 0.66c 64.54 ± 0.40bc 98.48 ± 1.35b
October 1.44 ± 0.015e 1.306 ± 0.014d 90.69 ± 0.05d 72.92 ± 0.76d 80.40 ± 0.81c
Mean 1.01 0.732 70.16 64.46 92.45
Median 0.98 0.637 65.00 64.54 95.46
SD 0.282 0.334 11.69 5.78 7.22
CV (%) 27.91 45.69 16.66 8.96 7.81
AG = total contents of α-La + β-Lg, α-La = α-lactalbumin, β-Lg = β-lactoglobulin, TWP = total acid whey proteins in 100 g milk, SD = standard deviation, CV = coefficient of variation
of the lactation period. The importance in the increased content of β-Lg relates to the fact that it is a major protein in the whey of ruminant milk and may play important roles in the bind-ing and transport of hydrophobic ligands such as retinoids, alkenes, and fatty acids. Moreover it is an important source of amino acids for the offspring (Kontopidis et al., 2004). The changes in concentration of individual whey proteins as well as in total whey protein content during the lactation period have not been sufficiently de-scribed yet. Seasonal variations were observed by Law and Brown (1994) in goat milk and by Casper et al. (1998) in individual ewe whey protein from Manchego-type cheese and goat whey from
[image:6.595.65.534.320.634.2]Cheddar-type cheese but there was no significant change in whey from Chevre cheese. According to Casper et al. (1998) relative amounts of α-La decreased only with a slight drift among the ob-tained values throughout the season, but β-Lg rose in the middle phase of lactation and then gradu-ally decreased toward the end of lactation in ewe whey from Manchego-type cheese while relative amounts of α-La fluently decreased and those of β-Lg increased in acid whey goat protein from Cheddar-type cheese. Pintado and Malcata (1996) reported similar trends in goat whey proteins and identified a decrease in total whey protein as the animals changed the stored feed diet for pasture in the middle of lactation.
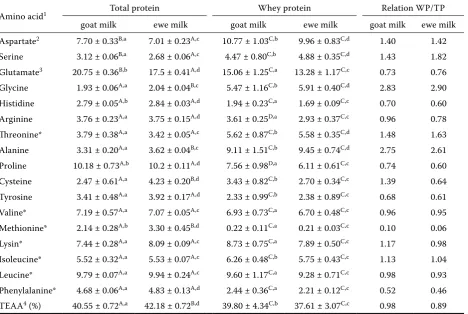
Table 2. Amino acids composition of total and whey protein
Amino acid1 Total protein Whey protein Relation WP/TP
goat milk ewe milk goat milk ewe milk goat milk ewe milk
Aspartate2 7.70 ± 0.33B,a 7.01 ± 0.23A,c 10.77 ± 1.03C,b 9.96 ± 0.83C,d 1.40 1.42
Serine 3.12 ± 0.06B,a 2.68 ± 0.06A,c 4.47 ± 0.80C,b 4.88 ± 0.35C,d 1.43 1.82
Glutamate3 20.75 ± 0.36B,b 17.5 ± 0.41A,d 15.06 ± 1.25C,a 13.28 ± 1.17C,c 0.73 0.76
Glycine 1.93 ± 0.06A,a 2.04 ± 0.04B,c 5.47 ± 1.16C,b 5.91 ± 0.40C,d 2.83 2.90
Histidine 2.79 ± 0.05A,b 2.84 ± 0.03A,d 1.94 ± 0.23C,a 1.69 ± 0.09C,c 0.70 0.60
Arginine 3.76 ± 0.23A,a 3.75 ± 0.15A,d 3.61 ± 0.25D,a 2.93 ± 0.37C,c 0.96 0.78
Threonine* 3.79 ± 0.38A,a 3.42 ± 0.05A,c 5.62 ± 0.87C,b 5.58 ± 0.35C,d 1.48 1.63
Alanine 3.31 ± 0.20A,a 3.62 ± 0.04B,c 9.11 ± 1.51C,b 9.45 ± 0.74C,d 2.75 2.61
Proline 10.18 ± 0.73A,b 10.2 ± 0.11A,d 7.56 ± 0.98D,a 6.11 ± 0.61C,c 0.74 0.60
Cysteine 2.47 ± 0.61A,a 4.23 ± 0.20B,d 3.43 ± 0.82C,b 2.70 ± 0.34C,c 1.39 0.64
Tyrosine 3.41 ± 0.48A,a 3.92 ± 0.17A,d 2.33 ± 0.99C,b 2.38 ± 0.89C,c 0.68 0.61
Valine* 7.19 ± 0.57A,a 7.07 ± 0.05A,c 6.93 ± 0.73C,a 6.70 ± 0.48C,c 0.96 0.95
Methionine* 2.14 ± 0.28A,b 3.30 ± 0.45B,d 0.22 ± 0.11C,a 0.21 ± 0.03C,c 0.10 0.06
Lysin* 7.44 ± 0.28A,a 8.09 ± 0.09A,c 8.73 ± 0.75C,a 7.89 ± 0.50C,c 1.17 0.98
Isoleucine* 5.52 ± 0.32A,a 5.53 ± 0.07A,c 6.26 ± 0.48C,b 5.75 ± 0.43C,c 1.13 1.04
Leucine* 9.79 ± 0.07A,a 9.94 ± 0.24A,c 9.60 ± 1.17C,a 9.28 ± 0.71C,c 0.98 0.93
Phenylalanine* 4.68 ± 0.06A,a 4.83 ± 0.13A,d 2.44 ± 0.36C,a 2.21 ± 0.12C,c 0.52 0.46
TEAA4 (%) 40.55 ± 0.72A,a 42.18 ± 0.72B,d 39.80 ± 4.34C,b 37.61 ± 3.07C,c 0.98 0.89
1values (in %) are means calculated from the content of each particular amino acid (in g) divided by the total amino acid
content (in g) excluding tryptophan
2aspartate includes both aspartate and asparagine
3glutamate includes both glutamate and glutamine
4TEAA = total essential amino acids
*essential amino acids
abcdABCDmeans within a line not followed by the same superscript differ (P < 0.05)
abcdrelated to differences of particular amino acid in the same type of proteins in goat and ewe milk
Amino acid composition of total and whey proteins
Amino acids are vital nutrients for growth and maintenance of health in humans. Very few data are available on the amino acid composition of goat and sheep milk. Amino acids pattern in milk protein changes only within the frame of experimental error during the lactation period, therefore average amino acids pattern in goat (WSH breed) and sheep (EF breed) milk is given in Table 2. In accordance with findings of Davis at al. (1994) and Hejtmánková et al. (2004), goat milk amino acid profile is similar to that of ewe and also cow milk. Of the total amino acids present, the most abundant were glutamate (plus glu-tamine, ca. 20%), proline (ca. 10%), and leucine (ca. 10%). Total essential amino acids made approximately 40% of the total amino acids in goat and sheep milk.
The greatest difference in abundance of individ-ual amino acids between goat and ewe milk was determined in the content of sulfur amino acids (cysteine and methionine) in accordance with Davis et al. (1994). The abundance of both these amino acids was accordingly higher in ewe milk. On the contrary, the smallest differences in abundance of individual amino acids in goat and ewe milk were in the content of arginine, proline, and isoleucine.
According to Velíšek and Hajšlová (2009), the abundance of cysteine in goat, ewe, and also hu-man milk is very similar and always higher than in cow milk (in goat milk up to twice), however cow milk contains more methionine.
On the contrary, according to Rurtherfurd et al. (2008) as well as Davis et al. (1994), the abundance of cysteine in goat and ewe milk is approximately half in comparison with human milk. According to the above-mentioned authors, total sulfur amino acids in milk do not differ between the species (ex-cept for rat and cat milk rich in total sulfur amino acids), but the given absolute values differ. In this study, for goat milk of WSH breed in comparison with data given by Davis et al. (1994), Ruthefurd et al. (2008), and Velíšek and Hajšlová (2009) for goat milk in general, higher contents of cysteine and equivalent contents of methionine and there-fore total sulfur amino acids content in goat milk were clearly higher and got near the value for rat milk given by Davis at al. (1994). Total sulfur amino acids contents in sheep milk (EF breed) were still higher. Further research and more data are needed for determination and validation of the real pattern of sulfur amino acids in milk.
The amino acids pattern in whey proteins (Table 2) differs from that in milk, but total essential amino ac-ids are approximately the same and their abundance is only slightly lower. No significant (P < 0.05) differ-ences between amino acids composition of goat and sheep whey have been observed with the exception of arginine and proline. The most abundant amino acid continues to be glutamate (plus glutamine, ca. 14%), followed by alanine (ca. 9%), and leucine (ca. 9%). The greatest changes in the abundance of the in-dividual amino acids were observed for methionine, glycine, and alanine. As the abundance of methio-nine decreased, the abundance of alamethio-nine and glycine increased. In comparison with milk, the abundance of lysine, isoleucine, leucine, valine, and arginine were practically invariable. Corresponding analyses are still not available in the scientific literature.
CONCLUSION
Some differences in composition between ewe and goat milk were found. The average total protein content as well as acid whey content in ewe milk is higher than in goat milk. Total protein content and acid whey content in sheep milk continuously increased during the lactation period, while goat milk protein and whey protein contents varied ac-cording to the period of lactation in goats. The amino acid profile of goat milk is similar to that of ewe milk but amino acids pattern in whey proteins dif-fers from that in milk. Total essential amino acids were approximately 40% of the total amino acids in goat and ewe milk as well as in goat and ewe whey. The main component of ewe acid whey proteins was always β-lactoglobulin while the main component of goat acid whey proteins was α-lactalbumin, but at the end of the lactation period the content of β-lactoglobulin increased steeply and the β-Lg/α-La ratio reached a maximum value of 1.94 in goat milk and 9.74 in ewe milk respectively. These variations in whey proteins throughout the lactation period could affect the products manufactured from goat and ewe milk whey. Further research and more data are still needed for determination and validation of the true relation.
REFERENCES
sheep and goat’s milk. Journal of Food Composition and Analysis, 15, 533–543.
Albenzio M., Caroprese M., Marino R., Muscio A., San-tillo A., Sevi A. (2006): Characteristics of Garganica goat milk and Cacioricotta cheese. Small Ruminant Research, 64, 35–44.
Alichanidis E., Polychroniadau A. (1996): Special fea-tures of dairy products from ewe and goat milk from the physicochemical and organoleptic point of view. In: Proceedings, Production and Utilization of Ewe and Goat Milk. International Dairy Federation Publi-cations, Brussels, Belgium, 21–43.
Bencini R., Purvis I.W. (1990): The yield and composition of milk from Merino sheep. Wool Technology and Sheep Breeding, 38, 71–73.
Borková M., Snášelová J. (2005): Possibilities of different animal milk detection in milk and dairy products – a review. Czech Journal of Animal Science, 23, 41–50. Casper J.L., Wendorff W.L., Thomas D.L. (1998):
Sea-sonal changes in protein composition of whey from commercial manufacture of goat and ovine specialty cheeses. Journal of Dairy Science,81, 311–322. Casper J.L., Wendorff W.L., Thomas D.L. (1999):
Func-tional properties of whey protein concentrates from goat and ovine specialty cheese whey. Journal of Dairy Science,82, 265–271.
Ciappessoni G., Přibyl J., Milerski M., Mareš V. (2004): Factors affecting goat milk yield and its composition. Czech Journal of Animal Science, 49, 465–473. Chornobai C.A.M., Damasceno J.C., Visentainer J.V.,
de Souza N.E., Matushita M. (1999): Physical-chemical composition of in natura goat milk from cross Saanen throughout lactation period. Archivos Latinoamerica-nos de Nutricion, 49, 283–286.
Davis T.A., Nguyen H.V., Garcia-Bravo R., Fiorotto M.L., Jackson E.M., Lewis D.S., Lee D.R., Reeds P.J. (1994): Amino acid composition of human milk is not unique. The Journal of Nutrition, 124, 1126–1132.
De Witt J.E. (1989): Functional properties of whey pro-teins. In: Fox P.F. (ed.): Developments in Dairy Chem-istry. Functional Milk Proteins. Elsevier Applied Science, Essex, UK, 285–321.
Fellippe X., Law A.J.R. (1997): Preparative-scale frac-tionation of bovine, goat and ovine whey proteins by gel permeation chromatography. Journal of Dairy Re-search,64, 459–464.
Ferreira I.M.P.L.V.O., Cacote H. (2003): Detection and quantification of bovine, ovine and goat milk percent-ages in protected denomination of origin cheeses by reversed-phase high-performance liquid chromato- graphy of β-lactoglobulins. Journal of Chromatogra-phy A, 1015, 111–118.
Frutos M., de Cifuentes A., Diez-Masa J.C., Amigo L., Ramos M. (1991): Application of HPLC for the detec-tion of proteins in whey mixtures from different animal species. HRC Journal of High Resolution Chromato- graphy,14, 289–291.
Fuertes J.A., Gonzalo C., Carriedo J.A., San Primitivo F. (1998): Parameters of test day milk yields and milk components for dairy ewes. Journal of Dairy Science, 81, 1300–1307.
Guo M.R. (2003): Goat milk. In: Caballero B. (ed.): En-cyclopedia of Food Sciences and Nutrition. Academic Press, London, UK, 2944–2949.
Guo M.R., Dixon P.H., Park Y.W., Gilmore J.A., Kind- stedt P.S. (2001): Seasonal changes in the chemical composition of commingled goat milk. Journal of Dairy Science, 84, 79–83.
Guo M.R., Park Y.W., Dixon P.H., Gilmore J.A., Kind- stedt P.S. (2004): Relationship between the yield of cheese (Chevre) and chemical composition of goat milk. Small Ruminant Research, 52, 103–107. Hejtmánková A., Trnková E., Dragounová H. (2004):
Amino acid content in cow and goat milk. In: Proce-edings on Milk Day, Czech University of Life Sciences Prague, Prague, Czech Republic, 58–59. (in Czech) IDF (International Dairy Federation) Provisional Standard
No. 162 (ISO 11814) (2002): Dried milk. Assessment of heat treatment intensity. IDF, Brussels, Belgium. Janovič S., Barač M., Mačej O., Djurevič J.D. (2005):
SDS-page analysis of milk proteins altered by high thermal treatment. Acta Alimentaria, 34, 105–112.
Kinsella J.E., Whitehead D.M. (1989): Proteins in whey: chemical, physical and functional properties. Advan-ces in Food & Nutrition Research, 33, 343–438. Kontopidis K., Holt C., Sawyer L. (2004): Invited review:
β-lactoglobulin: binding properties, structure, and function. Journal of Dairy Science, 87, 785–796. Kuchtík J., Sedláčková H. (2003): Composition and
proper-ties of milk in White Short-haired goats on the third lactation. Czech Journal of Animal Science, 48, 540–550. Kuchtík J., Šustová K., Urban T., Zapletal D. (2008):
Ef-fect of the stage of lactation on milk composition, its properties and the quality of rennet curdling in East Friesian ewes. Czech Journal of Animal Science, 53, 55–63.
Law A.J.R. (1995): Heat denaturation of bovine, goat and ovine whey proteins. Milchwissenschaft, 50, 384–388. Law A.J.R., Brown J.R. (1994): Compositional changes in goat whey proteins. Milchwissenschaft, 49, 674–678. Leitner G., Merin U., Silanikove N. (2011): Effects of
McKenzie H.A. (1970): Amino acid, peptide, and func-tion group analyses. In: McKenzie H.A. (ed.): Milk Proteins: Chemistry and Molecular Biology. Academic Press, New York, USA, 181–192.
Moatsou G., Hatzinaki A., Samolada M., Anifantakis E. (2005): Major whey proteins in ovine and goat acid wheys from indigenous Greek breeds. International Dairy Journal, 15, 123–131.
Ochoa-Cordero M.A., Torres-Hernandez G., Mandeville P.B., Diaz-Gomez M.O. (2007): Effect of physiological and management factors on the milk composition of Rambouillet ewes. Agrociencia,41, 263–270.
Oravcová M., Margetín M., Peškovičová D., Daňo J., Mil-erski M., Hetényi L., Polák P. (2007): Factors affecting ewe’s milk yield and milk components. Czech Journal of Animal Science, 52, 189–198.
Othmane M.H., Carriedo J.A., de la Fuente L.F., San Pri-mitivo V. (2002): Factors effecting test-day milk com-position in dairy ewes, and relationships amongst various milk composition. Journal of Dairy Research, 69, 53–62.
Park Y.W., Juárez M., Ramos M., Haenlein G.F.W. (2007): Physico-chemical characteristics of goat and sheep milk. Small Ruminant Research, 68, 88–113.
Pintado M.E., Malcata F.X. (1996): Effect of thermal treat-ment on the protein profile of whey from ovine and goat milk throughout lactation.International Dairy Journal, 6, 497–518.
Pintado M.E., da Silva J.A.L., Malcata F.X. (1999): Com-parative characterization of whey protein concentrates from ovine, goat and bovine milk. LWT-Food Science and Technology, 32, 231–237.
Romero C., Perez-Andújar O., Olmedo A., Jiménez S. (1996): Detection of cow‘s milk in ewe‘s milk or goat‘s milk. Chromatographia, 42, 181–184.
Rutherfurd S.M., Moughan P.J., Lowry D., Prosser C.G. (2008): Amino acid composition determined using
multiple hydrolysis times for three goat milk formu-lations. International Journal of Food Sciences and Nutrition, 59, 679–690.
SAS Institute Inc.(2001): SAS Propriety Software Release 9 of the SAS® System for Microsoft® Windows®. SAS
Institute Inc., Cary, USA.
Silanikove N., Leitner G., Merin U., Prosser C.G. (2010): Recent advances in exploiting goat‘s milk: quality, safety and production aspects. Small Ruminant Re-search, 89, 110–124.
Sinkiewicz T., Riedel C.L. (1990): Whey and Whey Uti-lization. 2nd Ed. Verlag Th. Mann, Gelsenkirchen-Buer,
Germany.
Soryal K., Beyene F.A., Zeng S., Bah B., Tesfai K. (2005): Effect of goat breed and milk composition on yield, sen-sory quality, fatty acid concentration of soft cheese dur-ing lactation. Small Ruminant Research, 58, 275–281. Velíšek J., Hajšlová J. (2009): Food Chemistry. 3rd Ed.
OSSIS, Tábor, Czech Republic. (in Czech)
Vilanova M., Goncalves M., Osorio M.T.M., Esteves R., Schmidt V. (2008): The health‘s udder and chemical composition of Saanen goat milk. Acta Scientiae Ve-terinariae, 36, 235–240.
Walzem R.L. (1999): Health enhancing properties of whey proteins and whey fractions. In: USDEC Mono-graph: Nutrition and Beverages. U.S. Dairy Export Council, Arlington, USA, 1–8.
Waters AccQ Tag Method Manual. Precolumn deriva-tization method for amino acid analysis (Wat 052874, Waters). Waters Corporation, Milford, USA.
Zeng S.S., Escobar E.N. (1996): Effect of breed and milk-ing method on somatic cell count, standard plate count and composition of goat milk. Small Ruminant Re-search, 19, 169–175.
Received: 2011–10–05 Accepted after corrections: 2012–03–20
Corresponding Author
Doc. Ing. Alena Hejtmánková, CSc., Czech University of Life Sciences Prague, Faculty of Agrobiology, Food and Natural Resources, Department of Chemistry, 165 21 Prague 6-Suchdol, Czech Republic