Towards Recommendation System for Work-group
Formation Using Social Network Analysis
Approach
Josu´e Miguel Flores–Parra, Manuel Casta˜n´on–Puga, Luis–Guillermo Mart´ınez, Ricardo Rosales–Cisneros
and Carelia Gaxiola–Pacheco
Abstract—In engineering project management, it is necessary to form teams with persons to accomplish plans. For many teams leaders, the team members selection could be a real challenge, due to the complex problem of set up a productive unit. An essential requirement is teamwork skill, especially in engineering workgroups where the project member is expected to know how to collaborate with peers. In this work-in-progress paper, we used social networks to represent social links between team members prospects. In our case of study, undergraduate computer engineering courses, the students expressed their preferences for working with other three peers at the course beginning, and this information was used to distinguish groups within the social network using network analysis algorithms. We compared the network analysis results versus groups formed by a teacher in a real course. Finally, we discussed the advantages and disadvantages of project teams from social network analysis approach to making team formation recommendations into a socio-technical system.
Index Terms—Education, Group formation, Sociogram, Net-works analysis algorithms, Social network analysis.
I. INTRODUCTION
I
N engineering project management, it is necessary to form teams with persons to accomplish plans. For many teams leaders, the team members selection could be a real challenge, due to the complex problem of set up a productive unit. An essential requirement is teamwork skill, especially in engineering workgroups where the project member is expected to know how to collaborate with peers.There are many ways to configure a professionals groups to set up teams, but we would like each team to be qualified to develop the proposed tasks successfully. One way is to create groups randomly, but some of them could be unproductive and fail. Another way is voluntarily set groups, but the success of all cannot be assured equally by each one. Even more, there are other strategies based on profiles, such as personality traits, learning styles, education background, reputation, or other information that we can match through some clustering methods. We would like to use social networks approach to analyzing the relationship
Manuscript received March 24, 2017; revised March 31, 2017. We thank the MyDCI program of the Division of Graduate Studies and Research, Autonomous University of Baja California, Mexico, the financial support provided by our sponsor CONACYT contract grant number: 257863.
J. M. Flores-Parra, M. Castanon-Puga, L.G. Martinez, R. Rosales-Cisneros, C. Gaxiola-Pacheco are with the Autonomous University of Baja California, Tijuana, BC, 22390, Mexico, e-mail: {mflores31, puga, luisgmo,ricardorosales, cgaxiola}@uabc.edu.mx.
between team members to discover other ways to create groups for teamwork.
The social network could be a description of individual preferences to others peers and used to find cultural traits or identify featured people in social systems. For example, we could use it to discover structures, applying social network analysis algorithms to find clusters of individuals with similar attributes. Network theory metrics can help us to establish a core to qualify the viability of teams. Differents social and psychological theories have explored from social network analysis approaches. The identified groups can express the local structures in the social system and could be used to propose teams socially convenient.
In this work-in-progress paper, we used social networks to represent social links between team members prospects. In our case of study, undergraduate computer engineering courses, the students expressed their preferences for working with other three peers at the course beginning, and this information was used to distinguish groups within the social network using network analysis algorithms. Although first we were focused on community structures to describe the naturally formed groups, we tried to find triads structures because we are interested in exploring three members’ team’s behaviour. Many theories about social relations can be tested using hypotheses about the triad census. We compared the network analysis results versus groups formed by a teacher in a real course. Finally, we discussed the advantages and disadvantages of project teams from social network analysis approach to making team formation recommendations into a socio-technical system.
II. RELATED WORK
A. Recommendation systems
Collaborative recommender systems have been implemented in different application areas [2]. On the other hand, content-based filtering techniques normally base their predictions on users information, and they ignore contributions from other users as with the case of collaborative techniques [3], [4].
Some of the problems associated with content-based filter-ing techniques are limited content analysis, overspecializa-tion and sparsity of data [2]. Also, collaborative approaches exhibit cold-start, sparsity and scalability problems. These problems usually reduce the quality of recommendations. In order to mitigate some of the problems identified, Hybrid filtering, which combines two or more filtering techniques in different ways in order to increase the accuracy and performance of recommender systems has been proposed [4].
B. Group formation
The social group is a fundamental and universal feature of human social life [5]. Research in many disciplines has shown that learning within groups improves the students learning experience by enabling peers to learn from each other.
For the teacher, forming groups manually can be both challenging and time consuming. For this, researchers have been investigating several techniques for automating this process through the use of computer-supported group for-mation (CSGF). Similar to a manual group, the challenges of CSGF lie in modelling the students data, the teachers constraints; and negotiating the allocation of students to groups to satisfy these constraints. However, existing tools often fail in allocating all students to groups, leaving some students unassigned to any group after the formation [6], [7].
C. Sociograms
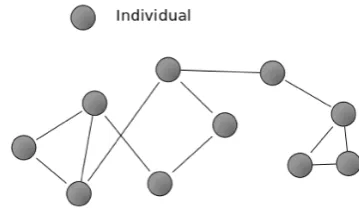
Sociograms represent the social relations within a group; nodes represent actors, and edges represent relationships between them [8]. Sociograms were developed by Jacob L. Moreno to analyze choices or preferences within a group [9], in the Figure 1 show an example.
Sociograms allow researchers to visualize the channels through which, for example, information could flow from one person to another to identify leaders and isolated individuals, to uncover asymmetry and reciprocity, and to map chains of connection [10].
In sociograms, the performance of the group relates to the cohesion and structures of relations, as stated for example in [11]. Specifically, in education, Yu et al. [12] improve the academic performance of student groups by considering student profiles and different levels of academic performance when making the groups.
D. Social network analysis
Social network analysis (SNA) is a method for studying the individual relationships between individuals, or groups of individuals, while simultaneously studying the social context [13].
[image:2.595.334.514.55.163.2]SNA is a mainly quantitative method for analysing how relationships between individuals form and affect those in-dividuals, but also how individual relationships build up into wider social structures that influence outcomes at a
Fig. 1. An example of sociogram.
group level. Recent increases in computational power have increased the accessibility of social network analysis methods for application in differents investigations [14].
The value of SNA as a research approach lies in its ability to examine how individuals are embedded within a social structure and also how social structures emerge from the micro-relationships between individuals [15].By visualising and quantifying patterns within networks, such as the overall level of connectivity between network members and the presence or absence of cliques, network analysts can learn how the structural properties of a network can constrain or enable the social behaviour of individuals [16]. SNA therefore has the major advantage of allowing researchers to measure both individual and socio-cultural influences on educational, psychological, economic and health outcomes.
1) Social network analysis using communities: Social creatures interact in diverse ways: forming groups, sending emails, sharing ideas, and mating. In order to understand social interactions, it is therefore crucial to identify these so-cial structures or communities, which are loosely defined as collections of individuals who interact unusually frequently [17].
Communities often refer to groups or clusters, and people or things in same community often have more similari-ties.Community structure often reveals interesting properties shared by the members, such as common hobbies, occupa-tions, social funcoccupa-tions, or rank [18], [19], [20].
A large quantity of approaches for detecting community has been proposed over the years [21]. Most early ap-proaches, such as the Kernighan-Lin algorithm [22], spectral partitioning [23], hierarchical clustering [24] , andmodularity optimizing [25] etc, focus on identifying disjoint communi-ties.
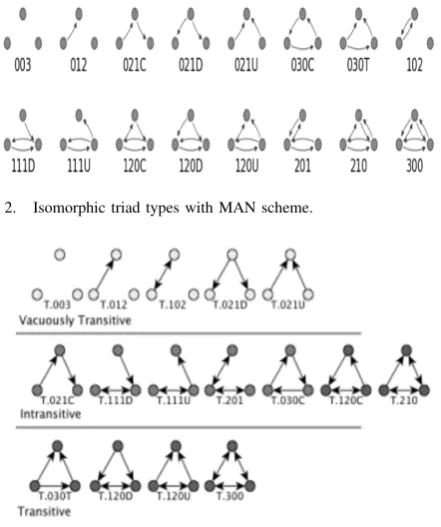
2) Social network analysis using triads: A triad is a subgraph of three nodes and links between them. Triads can be of sixteen different types as shown in Figure 2. The differents Triads can label according to M-A-N scheme; where each type has a description of three to four digits that respectively represent the number of mutual (M), asymmetric (A), and null (N) dyads [26] and the direction of ties among them.
Fig. 2. Isomorphic triad types with MAN scheme.
Fig. 3. Vacuous, intransitive, and transitive triads.
of the ties: D for downward, U for upward, T for transitive and C for cyclic [27].
Figure 3 classifies the 16 triad types according to the transitivity of their underlying relationships.We next describe social theories ascribed to each of these three classes of triads.
Vacuously Transitive Triads - Egocentricity: In these triads, the two asymmetric connections either point towards or away from the egocentric users. T.021D features an egocentric user who interacts with many others but does not receive reciprocal responses. T.021U, on the other hand, represents an egocentric user who receives attention from many others but never reciprocates.
Intransitive Triads - Social Stature: Intransitive triads typically emerge due to social effects that encourage users to interact with an intermediary, rather than establish a direct relationship. Such triads are uncomfortable and can be a source of distress to at least one user [28] because they open opportunities for intermediary users to hide secret informa-tion and relainforma-tionships. Consequently, intransitive structures represent three users who intentionally choose to withhold interaction.
Transitive Triads - Relationship Strength: While the effect of social stature diminishes in transitive triads, the strength of relationships sculptures such interactions. Thus, transitive triads dominate networks in which users exhibit homophily, whether it occurs naturally and by choice. Ac-cordingly, transitive triads are abundant in a network of close personal friends due to the existence of strong underlying relationships among them [29].
III. THE WORK-GROUP RECOMMENDATION SYSTEM
[image:3.595.316.534.54.198.2]In Figure 4 we show the process to produce a recommen-dation from social network analysis. The project members preferences are represented by sociogram (the social net-work) that is analyzed ans used to infer a recommendation.
Fig. 4. The work-group recommendation system.
A. Social network formation
In this step, the goal is to create a social network by expressed user preference.
1) Project members preferences: The project member peers preference captured by a simple questionnaire. The user selects in order of preference three peers from a list.
2) Sociogram creation: With users choice obtained in-formation, we build a social network where the edges are peers and links are preferences. The weight of the link is the preference level to work with selected by the user.
B. Social network analysis
In this step, the information is processed by network analysis algorithms to identify prospects groups and obtain metrics values.
1) Network analysis: Communities and triads algorithms analyse the social network created in the previous step.
2) Distinguish prospect groups and metrics: Prospects groups and its parameters values identified.
C. Recommendation inference
In this step, the groups and its parameters values are used to infer recommendations.
1) Recommendation Inference system: An inference sys-tem is used to evaluate groups parameters and obtain a decision.
2) Knowledge base: The knowledge base is part of the inference system and represents the recommendation possi-bilities within a set of groups parameters inputs.
IV. CASE OF STUDY
In some undergraduate courses in computer science or engineering, it is necessary to form teams with the students to accomplish projects. For many teachers, classroom projects are a learning strategy that could help develop the proposed course skills. An important skill to practice is teamwork, especially in engineering where the student is expected to learn how to collaborate with peers.
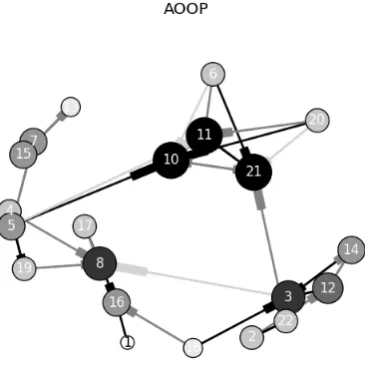
Fig. 5. Sociogram of advanced object-oriented programming (AOOP) course that describes the student’s preferences to work with peers.
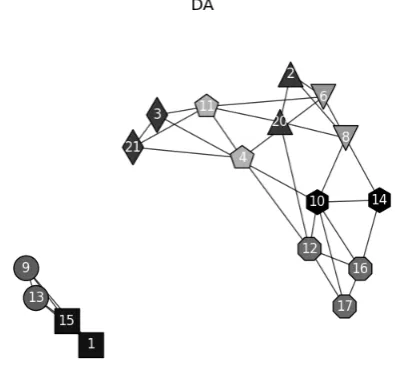
Fig. 6. Sociogram of distributed application (DA) course that describes the student’s preferences to work with peers.
A. Methodology
We take as case study two different undergraduate courses. An Advanced Object-Oriented Programming (AOOP) and a Distributed Applications (DA) courses, with 21 and 17 students respectively. The experiment consisted of asking the students which classmates they would like to work with them. The students chose three partners from the most important to the least. With the obtained results, we make sociograms that represent their answers, this can be observed in Figure 5 and Figure 6.
In this sociograms, we can see that the size of each actor corresponds to the number of students who chose him as possible members of his team. It can also observe that the colors of the ties got by the importance that each student gave to his choice (High=Black, Middle=Gray, Low= Light gray).
Later, we analyzed sociograms with the help of the Net-workX and Community packages; both are Python language software packages. We search for existing communities within sociograms using the Louvain method. The purpose of the Louvain method is to extract the community structure of the large networks. Which is a heuristic method based
[image:4.595.70.519.283.469.2]Fig. 7. Teams found using community method in sociogram of advanced object-oriented programming (AOOP) course that represents the student’s preferences to work with peers.
Fig. 8. Teams found using community method in sociogram of distributed application (DA) course that represents the student’s preferences to work with peers.
on the optimization of modularity, this method is one of the best for detecting communities concerning computing time. Also, the quality of the communities is excellent [25]. The communities found can be seen in the Figure 7 and Figure 8.
After that, we take each community found and search the triads through the algorithm proposed by the authors Vladimir Batagelj and Andrej Mrvar [30]. We gave more importance to the triads that showed a greater transitivity among its members. Each triad will be a team; it should note that due to the sizes of the groups some were divided into two or three actors. The triads found can be seen in the Figure 9 and Figure 10.
B. Results
[image:4.595.325.512.287.472.2]Fig. 9. Teams found using triad method in sociogram of advanced object-oriented programming (AOOP) course that describes the student’s preferences to work with peers.
Fig. 10. Teams found using triad method in sociogram of distributed application (DA) course that describes the student’s preferences to work with peers.
TABLE I
TEAMS FORMED BY THE TEACHER AND COMMUNITY AND TRIADS APPROACH FOR THE ADVANCED OBJECT-ORIENTED PROGRAMMING
(AOOP)COURSE.
Team Teacher Triads Community A 4,19 4,8,19 1,4,8,16,17,19
B 8,16,17 1,16,17 2,3,12,14,18,22
C 2,6,22 2,22 5,6,10,11,20,21
D 3,12,14 3,12,14 7,13,15
E 5,7 18
-F 1,20,18 5,10,20
-G 10,11,21 6,11,21
-H 13,15 7,13,15
-We can see in the Table I and Table II that the results of the teams are very varied. This problem is because the teacher was guided by a sociogram to be able to form the teams and took into account only the preference factor.
But this factor can create very close groups and exclude others so that students can remain in groups of limited union or null interest causing problems in their learning. This issue, unfortunately, can also be observed when using the triads where there would be teams with a lot of transitivities
TABLE II
TEAMS FORMED BY THE TEACHER AND COMMUNITY AND TRIADS APPROACH FOR A DISTRIBUTED APPLICATION(DA)COURSE.
Team Teacher Triads Community A 1,15 1,15 1,9,13,15
B 9,13 9,13 2,6,8,20
C 2,20 2,20 3,4,11,21
D 4,6,8 6,8 10,12,14,16,17
E 3,21 3,21
-F 10,11,14 4,11
-G 12,16,17 10,14
-H - 12,16,17
-(strong union) but others where this association is null or nonexistent, so we have to improve this method of creating work teams.
V. DISCUSSION
The case study of the teacher and the class workgroups served us to exemplify the need to form groups with fixed size. Whether using the communities, or the triad method, we have observed some differences between the groups that the teacher set up in the real case. If the teacher had let groups were formed naturally, possibly we would have obtained groups of 4 to 6 people, but it would have been inconvenient as large groups. Figure 7 shows an example of this remark. In contrast, the teacher tried to form smaller groups, and restrict the size of 2 to 3 people.
This approach complicated the decision of who should be in one group or another, and consequently the risk that small groups would not be productive. But the teacher had more information than the algorithms. He knew the priorities in the preferences and used this information to create teams starting from the strongest relationships. With this first experience with our case studies, we could say that the triads would be more useful than the communities since the algorithm could identify the type of triad. But the triad does not solve how to divide large groups into small groups. Could we consider preferences to form smaller groups?
We presume that by using several methods, we could improve the formation of groups and give a better recom-mendation close to our experience with the teacher decision. For example, first, trying to form dyads based on the first preference, then convert them into triads by adding the most proper correlative. In the end, we could get groups of 2 to 3 people. Therefore, it is important to create a sequence from simple but stable groups to larger groups, applying different grouping algorithms.
Other characteristics of individuals could be considered. For example, there are some proposals based on psycho-logical traits like BIG FIVE [31] or learning styles like VARK [32], [33], which would help make better decisions. But these new considerations add more challenge to the task of forming groups. In this case, it would require an analysis of multilevel networks [34].
[image:5.595.68.266.294.477.2]the training of programmer teams in support systems for software development, e.g., SCRUM teams [36], [37].
An advantage in automating this process is that the stake-holders can form groups in a standardised way. But one dis-advantage is that it will be difficult to guarantee the success of the project because human behaviour is complex, and it will remain a challenge to predict it. Even so, recommending how to form groups can be of great help, as it can eliminate the inclination of the planner towards one individual or group of people, and try to benefit them at a disadvantage from others.
VI. CONCLUSION AND FUTURE WORK
In this work-in-progress paper, we used sociograms to represent social links between students. In our case of study, each student expressed their preferences for working with other three peers, and this information was used to detect clusters within the social network using network analysis algorithms. Then we compared the network analysis results versus groups formed by a teacher in a real course.
This comparison showed us that we need to improve the creation of teams so that they perform better. Our future work includes exploring other techniques of community discovery. It is also necessary to explore other metrics not only the preferences of the students, to create realistic models of how students are grouped and behave.
REFERENCES
[1] F. Ricci, L. Rokach, and B. Shapira, “Introduction to recommender systems handbook,”Springer, 2011.
[2] G. Adomavicius and A. Tuzhilin, “Toward the next generation of recommender systems: a survey of the state-of-the-art and possible extensions,”IEEE Transactions on Knowledge and Data Engineering, vol. 17, no. 6, pp. 734–749, June 2005.
[3] S.-H. Min and I. Han, “Detection of the customer time-variant pattern for improving recommender systems,”Expert Systems with Applica-tions, vol. 28, no. 2, pp. 189 – 199, 2005.
[4] F. Isinkaye, Y. Folajimi, and B. Ojokoh, “Recommendation systems: Principles, methods and evaluation,”Egyptian Informatics Journal, vol. 16, no. 3, pp. 261 – 273, 2015.
[5] M. A. Hogg and J. C. Turner, “Interpersonal attraction, social iden-tification and psychological group formation,”European Journal of Social Psychology, vol. 15, pp. 51–66, 1985.
[6] C. M. T. De Freitas and R. L., “A support tool for student group definition,” 2007 37th Annual Frontiers In Education Conference - Global Engineering: Knowledge Without Borders, Opportunities Without Passports, 2007.
[7] M. A. Redmond, “A computer program to aid assignment of student project groups,”SIGCSE Bull, pp. 134—-138, 2001.
[8] W. Huang, S.-H. Hong, and P. Eades, “How people read sociograms: A questionnaire study,” in Proceedings of the 2006 Asia-Pacific Symposium on Information Visualisation - Volume 60, 2006, pp. 199– 206.
[9] J. L. Moreno, “Who shall survive? foundations of sociometry, group psychotherapy and sociodrama,” Journal of the American Medical Association, 1953.
[10] J. Scott, “Social network analysis: A handbook,”Sage Publications, 1987.
[11] T. U. Grund, “Network structure and team performance: The case of english premier league soccer teams,”Social Networks, vol. 34, no. 4, pp. 682–690, 2012.
[12] Z. Yu, C. Dongsheng, and W. Wen, “The heterogeneous effects of ability grouping on national college entrance exam performance evi-dence from a large city in china,”International Journal of Educational Development, vol. 39, pp. 80–91, 2014.
[13] J. Scott, “Social network analysis,”Sociology, vol. 22, pp. 109–127, 1988.
[14] R. Isba, K. Woolf, and R. Hanneman, “Social network analysis in medical education,”Medical Education, vol. 51, no. 1, pp. 81–88, 2017.
[15] J. MO,Social and Economic Networks, Princeton, Ed. NJ: Princeton University Press, 2008.
[16] S. P. Borgatti, A. Mehra, D. J. Brass, and G. Labianca, “Network analysis in the social sciences,”Science, vol. 323, no. 5916, pp. 892– 895, 2009.
[17] L. C. Freeman, “Finding social groups: A meta-analysis of the southern women data.”Dynamic Social Network Modeling and Analysis, 2003. [18] R. L. Breiger, “The duality of persons and groups.”Social Forces,
1974.
[19] B. B. G. A. Davis and M. R. Gardner, “Deep south.”The University of Chicago Press, 1941.
[20] R. L. Breiger, “Scaling and statistical models for affiliation networks: patterns of participation among soviet politicians during the brezhnev era.”Social Networks, 2002.
[21] F. S, “Community detection in graphs.”Phys Rep, 2010.
[22] L. S. Kernighan BW, “An efficient heuristic procedure for partitioning graphs.”Bell system technical journal, 1970.
[23] L. K. Pothen A, Simon HD, “Partitioning sparse matrices with eigenvectors of graphs.”SIAM J Matrixl, 1990.
[24] F. J. Hastie T, Tibshirani R and F. J, “The elements of statistical learning: data mining, inference and prediction.”Math Intell, 2005. [25] Vincent D Blondel, J.-l. Guillaume, R. Lambiotte, and E. Lefebvre,
“Fast unfolding of communities in large networks,”Journal of Statis-tical Mechanics: Theory and Experiment, pp. 1–12, 2008.
[26] M. D. Felmlee, P. Bhattacharyya, S. F. Wu, and D., “The evolu-tion of ego-centric triads: A microscopic approach toward predicting macroscopic network properties,” in2011 IEEE Third International Conference on Privacy, Security, Risk and Trust and 2011 IEEE Third International Conference on Social Computing, 2011, pp. 172–179. [27] C. P. Skvoretz and J., “Looking at social capital through triad
struc-tures,”Connections, vol. 28, pp. 4–16, 2008.
[28] F. Heider, “Attitudes and cognitive organization,” The Journal of Psychology, vol. 21, pp. 107–112, 1946.
[29] H. Louch, “Personal network integration: transitivity and homophily in strong-tie relations,”Social Networks, vol. 22, no. 1, pp. 45–64, 2000.
[30] V. Batagelj and A. Mrvar, “A subquadratic triad census algorithm for large sparse networks with small maximum degree,”Social Networks, vol. 23, no. 3, pp. 237 – 243, 2001.
[31] X. Yin, T. Chen, W. Liu, R. Xiao, C. Ma, and Z. Fu, “A reinforced collaborative filtering approach based on similarity propagation and score predication graph,”EURASIP Journal on Wireless Communica-tions and Networking, vol. 2016, no. 1, p. 210, 2016.
[32] G. Salim Basheer, A. Y.C. Tang, and M. S. Ahmad, “Designing teachers’ observation questionnaire based on curry’s onion model for students’ learning styles detection,” 2016.
[33] P. M. Newton, “The learning styles myth is thriving in higher educa-tion,”Frontiers in Psychology, vol. 6, p. 1908, 2015.
[34] F. C. Godart, F. Cavarretta, and M. Thiemann, “Task complexity and shared value orientation: exploring the moderators of a social dilemma in team social networks,”Industrial and Corporate Change, vol. 25, no. 5, p. 739, 2016.
[35] G. S. Easton and E. D. Rosenzweig, “Team leader experience in improvement teams: A social networks perspective,”Journal of Oper-ations Management, vol. 37, pp. 13 – 30, 2015.
[36] L. Gren, R. Torkar, and R. Feldt, “Group development and group maturity when building agile teams: A qualitative and quantitative in-vestigation at eight large companies,”Journal of Systems and Software, vol. 124, pp. 104 – 119, 2017.