1
Just what the doctor ordered: Measuring service
quality in GP practices
Mel Hudson Smith ([email protected])
Plymouth University Graduate School of Management, Plymouth, PL4 8AA, UK.
Abstract
This paper presents the findings from a research project looking at the measurement of service quality in English GP Surgeries. It uses an expert panel to classify questions from an existing large scale survey into the SERVQUAL dimensions, which are then confirmed by factor analysis and developed into scales. The scales are used to calculate the relative impact of each dimension of service quality on patient satisfaction. The findings highlight significant problems with the SERVQUAL dimensions in the GP Surgery context. However, they also show that Empathy is the strongest driver of patient satisfaction.
Keywords: Service Quality, SERVQUAL, Healthcare
Introduction
The measurement of service quality is a well established concept and one which has been high on the research agenda since the 1980s, through the popularity of various measurement frameworks; most notably SERVQUAL (Parasuraman et al, 1988; 1991).
In healthcare, service quality is wrapped up with overall quality of care and is considered important as there is evidence that it affects clinical outcomes and overall quality of life measures (Lee et al 2013, Lanfredi et al, 2014). Therefore, there have been various efforts to study service quality in healthcare (e.g. Andaleeb, 2001; Chow et al, 2009; Alrubaiee and Alkaa’ida, 2011). However, the majority of these studies are focused on large institutions, such as hospitals. There are few studies that have looked at measuring service quality in GP surgeries and those that have been conducted have been based on either very small, or convenience samples (Ramasaran-Fowdar, 2008; Sliwa and O’kane, 2011). Despite the critical importance of GP surgeries in being a first point of contact for patients, there appear to be no large scale, generalisable studies, measuring service quality in this context.
The likely reason for this is that each GP practice is typically small compared to the size of the population, whilst the logistics of distributing a service quality measurement tool across a wide range of service users from different GP surgeries is prohibitively complex and expensive. Therefore, the purpose of this research is to develop an approach to measure service quality across the breadth of GP surgeries, in a manner which is both effective and cost efficient.
Background Literature
2
al, 2003). In public services – including publicly funded healthcare services, such as the NHS in England, the competitive advantage issue is less relevant, but the demand for improved service quality is still very high. This is mainly due to the political imperative to be seen to be delivering high quality services to taxpayers (Mori, 2002). However, there are stronger reasons for monitoring and improving service quality in healthcare, which are focused on the link between service quality and key health outcomes.
Various studies have shown that there is a positive relationship between patient satisfaction and improved health outcomes. For example, Chow et al (2009) found that patients who are satisfied are more positive and more likely to cooperate and comply with their treatment regime, whilst Lanfredi et al (2014) found that service satisfaction had a positive impact on the overall quality of life measurement in schizophrenia patients.
Satisfaction has been described as an evaluation of a specific service encounter (Cronin and Taylor, 1992), whilst service quality is a more generalised assessment of service performance over time (Torres, 2014). Service quality is considered to be an antecedent of satisfaction (Lee et al, 2000) suggesting that service quality must be above a certain level before users of that service will be satisfied.
Several studies have also shown that customer satisfaction in the hospitality sector is a ‘mediator’ between service quality and behavioural intentions (i.e. customer loyalty) (Tarn, 1999, Kim, 2011). In a healthcare setting, behavioural intentions might include compliance with treatment regimes – which is a key factor in improving health outcomes (Martin et al, 2005). There is, therefore, a logical chain which links improved health outcomes to service quality, because high service quality is a predictor of satisfaction (Miguel-Davilla et al, 2010), satisfied patients are more likely to cooperate with treatments (Chow et al, 2009) and treatment adherence improves health outcomes (Martin et al, 2005). As a result, service quality should be considered of paramount importance and monitored appropriately.
SERVQUAL
There are various approaches to measuring service quality, but probably the most widely used is SERVQUAL (Parasuraman et al, 1988, 1991). This is a measurement tool which defines service quality through 5 distinct dimensions and measures this through calculating the gap between customer expectations and their actual perceptions of the service. The 5 dimensions are considered to have generic applicability to any service environment and are; empathy, tangibles, reliability, responsiveness and assurance.
Despite its popularity, SERVQUAL is not without criticism. Cronin and Taylor (1992) suggest that measuring the ‘gap’ is problematic and that service quality can be measured through the use of perceptions alone, whilst Carman (1991) suggests that the dimensions should change to suit the context, where required. Therefore, whilst the SERVQUAL dimensions are a good starting point for evaluating service quality, using the method of calculating the gap may not be the best way of achieving this.
SERVQUAL in healthcare
3
in his study of hospitals in Bangladesh, but while the first 4 are variations of the SERVQUAL dimensions, the 5th is Baksheesh, which is very context dependent. Similarly, Ramasaran-Fowder (2008) found that, when looking at private GP practices in Mauritius that the Empathy dimension was replaced with 3 new dimensions, including Professional Competence.
Literature Summary and Research Objectives
The literature shows that there is a strong rationale for measuring service quality in a healthcare environment and that it is possible to do this using the SERVQUAL dimensions, but not necessarily the gap method of calculation advocated in the original instrument and with an appreciation that the dimensions may require modification for use in this context.
There have been a number of studies which have utilised the SERVQUAL approach in healthcare, but to date, there appear to have been no large-scale, multi-site studies of service quality in GP surgeries. Such a study would be useful as it would enable an evaluation of the first – and often most frequently utilised – point of contact for patients. However, distributing a SERVQUAL instrument to a representative sample of patients in a context where each individual surgery represents only a tiny proportion of the total population has significant logistical and cost challenges. Therefore, an alternative approach is required.
Within the UK, a national survey of GP patients is already carried out (The GP Patient Survey), administered by Ipsos Mori on behalf of the Department for Health. Whilst this survey does not explicitly consider the SERVQUAL dimensions, it does cover a number of similar areas as it is designed to measure patient experiences with their local surgery. It is also highly generalisable, being distributed quarterly to 1.4 million patients who are registered at over 8450 GP surgeries in England.
The purpose of this study, therefore, is to address the following research questions: 1) Can service quality in English GP surgeries be evaluated effectively and cost
efficiently, using the data from the GP Patient Survey?
a. Does the GP Patient Survey measure all aspects of service quality, as defined by the SERVQUAL dimensions?
b. Can relevant questions in the GP Patient Survey be mapped effectively to the SERVQUAL dimensions, creating reliable scales?
2) If so, can the scales be used to classify the relative importance of each dimension of service quality in the context of GP patient satisfaction?
Research Method
This study used the Practice level results from the GP Patient Survey for 2009/10, which are aggregated scores for each GP Practice. Therefore the analysis is based on these Practice aggregates, rather than individual patient scores. The GP Patient Survey for this period included 8457 practices in total.
The SERVQUAL questionnaire uses 22 statements to characterise the 5 dimensions of service quality and measure customer perceptions. The GP Patient Survey comprises 41 relevant statements over 11 areas of measurement, covering all aspects of patient experience, including access, interpersonal and technical interactions with the surgery (Campbell et al, 2009).
4
reliability and assurance dimensions in particular, with few agreements overall. However, this appeared to be mainly to do with definitional issues and difficulties in completing the form. Feedback from the pilot helped refine the research instrument, clarifying definitions and instructions.
The final research instrument was a simple, tick-box list of the GP Patient Survey statements, with full definitions of the SERVQUAL dimensions, including the 22 points used in the SERVQUAL questionnaire, to assist in the classification of the GP Patient Survey statements.
An expert panel of 7, UK based, academic researchers was selected on the basis of expertise in Service Quality and of SERVQUAL in particular. In the first round, the panel was asked to classify each statement into one of the 5 dimensions of service quality, or to classify it as ‘none of these’. A qualitative field was used to enable participants to leave comments, suggest alternative dimensions or offer any other feedback.
After the first round, the results were compiled and panel members asked to revisit areas where there was disagreement. To facilitate this, the results of the first round were explained to show the level of agreement between the panel members. This resulted in at least a majority consensus after the second round for all but 4 statements, which were then rejected due to their ambiguity.
Findings
The first round of the expert panel suggested a low level of congruence in responses with only 1 of the 41 statements from the GP Patient survey being categorised in the same dimension by all 7 panel members. One expert commented that the greatest difficulty in the first round had been differentiating between Responsiveness and Empathy, although the results suggest that there was actually widespread confusion between both these dimensions and the Assurance dimension. He also noted that there was remarkably little in the survey which seemed to focus on Tangibles. This is supported by the round 1 results, which show only 1 statement categorised by a majority of panel members under this dimension, although it should be noted that Reliability seemed the most difficult to categorise, with no statements gaining a majority in this dimension.
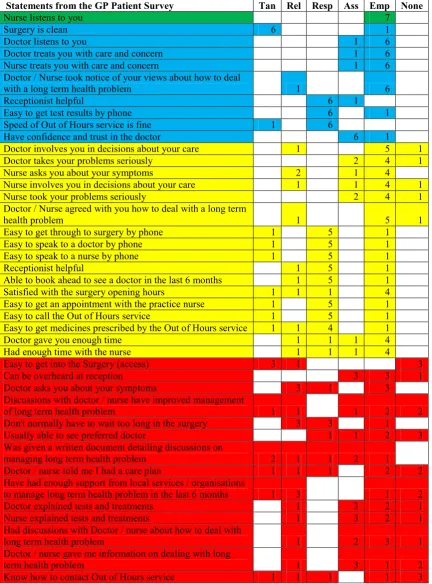
Two panel members commented on the difficulty of classification, with one stating that the process had been “rather difficult – not entirely happy with my responses!” This, along with the confused categorisation in round 1, suggests that perhaps some of the SERVQUAL dimensions are rather nebulous concepts, with significant interpretational overlap between them. The round 1 results are summarised in Table 1. (The colour coding for Tables 1 and 2 is as follows: Green: full agreement of panel; Blue: all but one panel agree; Yellow: majority of panel agree; Red: no agreement found.)
The results of the second round of the Expert Panel show that a much higher level of congruence between panel members was achieved, with 18 statements now achieving full agreement from the panel and only 4 remaining unable to be categorised with at least a majority agreement.
5
[image:5.595.84.517.194.779.2]majority agreement after the final round and significant problems differentiating this dimension from those of Assurance and Empathy. One panel member commented “… aspects of empathy can be considered as right first time and therefore reliable. […] My preference is reliability but others argue it empathy therefore I have moved some my responses where they could fall in both.”
Table 1: Results of the first round of the Expert Panel showing the number of experts who categorised each statement under each dimension
Statements from the GP Patient Survey Tan Rel Resp Ass Emp None
Nurse listens to you 7
Surgery is clean 6 1
Doctor listens to you 1 6
Doctor treats you with care and concern 1 6
Nurse treats you with care and concern 1 6
Doctor / Nurse took notice of your views about how to deal
with a long term health problem 1 6
Receptionist helpful 6 1
Easy to get test results by phone 6 1
Speed of Out of Hours service is fine 1 6
Have confidence and trust in the doctor 6 1
Doctor involves you in decisions about your care 1 5 1
Doctor takes your problems seriously 2 4 1
Nurse asks you about your symptoms 2 1 4
Nurse involves you in decisions about your care 1 1 4 1
Nurse took your problems seriously 2 4 1
Doctor / Nurse agreed with you how to deal with a long term
health problem 1 5 1
Easy to get through to surgery by phone 1 5 1
Easy to speak to a doctor by phone 1 5 1
Easy to speak to a nurse by phone 1 5 1
Receptionist helpful 1 5 1
Able to book ahead to see a doctor in the last 6 months 1 5 1
Satisfied with the surgery opening hours 1 1 1 4
Easy to get an appointment with the practice nurse 1 5 1
Easy to call the Out of Hours service 1 5 1
Easy to get medicines prescribed by the Out of Hours service 1 1 4 1
Doctor gave you enough time 1 1 1 4
Had enough time with the nurse 1 1 1 4
Easy to get into the Surgery (access) 3 1 3
Can be overheard at reception 3 3 1
Doctor asks you about your symptoms 3 1 3
Discussions with doctor / nurse have improved management
of long term health problem 1 1 1 2 2
Don't normally have to wait too long in the surgery 3 3 1
Usually able to see preferred doctor 1 1 2 3
Was given a written document detailing discussions on
managing long term health problem 2 1 1 2 1
Doctor / nurse told me I had a care plan 1 1 1 2 2
Have had enough support from local services / organisations
to manage long term health problem in the last 6 months 1 3 1 2
Doctor explained tests and treatments 1 3 2 1
Nurse explained tests and treatments 1 3 2 1
Had discussions with Doctor / nurse about how to deal with
long term health problem 1 2 3 1
Doctor / nurse gave me information on dealing with long
term health problem 1 3 1 2
6
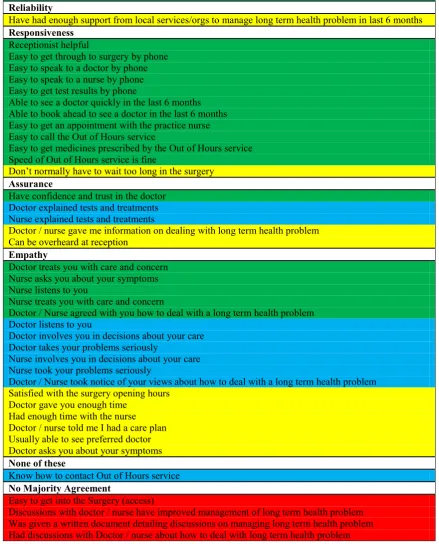
[image:6.595.78.518.232.777.2]There are also continuing disagreements apparent in attempting to separate the dimensions of Assurance and Empathy in a number of cases, although these categories are fairly clearly defined overall. However, there is a possibility that Empathy became a ‘catch-all’ for difficult-to-classify statements, with 17 statements eventually gaining a majority categorisation in this dimension, from 14 in the first round. An alternative explanation is that the GP Patient Survey focuses on Empathy at the expense of Assurance and Reliability. Table 2 shows the final categorisations that were achieved.
Table 2: Final SERVQUAL categories for the GP Patient Survey statements
Tangibles Surgery is clean Reliability
Have had enough support from local services/orgs to manage long term health problem in last 6 months Responsiveness
Receptionist helpful
Easy to get through to surgery by phone Easy to speak to a doctor by phone Easy to speak to a nurse by phone Easy to get test results by phone
Able to see a doctor quickly in the last 6 months Able to book ahead to see a doctor in the last 6 months Easy to get an appointment with the practice nurse Easy to call the Out of Hours service
Easy to get medicines prescribed by the Out of Hours service Speed of Out of Hours service is fine
Don’t normally have to wait too long in the surgery Assurance
Have confidence and trust in the doctor Doctor explained tests and treatments Nurse explained tests and treatments
Doctor / nurse gave me information on dealing with long term health problem Can be overheard at reception
Empathy
Doctor treats you with care and concern Nurse asks you about your symptoms Nurse listens to you
Nurse treats you with care and concern
Doctor / Nurse agreed with you how to deal with a long term health problem Doctor listens to you
Doctor involves you in decisions about your care Doctor takes your problems seriously
Nurse involves you in decisions about your care Nurse took your problems seriously
Doctor / Nurse took notice of your views about how to deal with a long term health problem Satisfied with the surgery opening hours
Doctor gave you enough time Had enough time with the nurse Doctor / nurse told me I had a care plan Usually able to see preferred doctor Doctor asks you about your symptoms None of these
Know how to contact Out of Hours service No Majority Agreement
Easy to get into the Surgery (access)
7
Scale Creation
Once the results of the expert panel were finalised, factor analysis was carried out on the final components of each of the three SERVQUAL dimensions with more than one component, using the data from the 09/10 GP Patient Survey. This resulted in both Responsiveness and Empathy being split into 3 factors. For Responsiveness, the first factor focused on the general responsiveness of the surgery, the second on the responsiveness of the Out of Hours service and the third on telephone interactions with the surgery. For Empathy, the first factor covered general surgery issues and interactions with the doctor. The second factor was focused on interactions with the nurse and the third related to care plans (only one variable was loaded onto this factor). Tables 3 and 4 show the components of the 3 factors for each dimension. Assurance was found to comprise only one factor. Cronbach’s Alpha scores were then calculated for each of the dimensions to check for scale consistency, with a cut-off of 0.7 used to measure this (Nunnally, 1978). This resulted in one of the new Responsiveness factors – telephone interactions - being discarded as it failed to reach this threshold. Table 5 shows the results of the scale development.
Table 3: Responsiveness Factors
Factors extracted using Principle Component Analysis
with Varimax rotation. Loadings <.45 suppressed. Explained by Factor % of Variance Gen Factor Components OOH Phone Receptionist helpful
33.0004
.854
Easy to get through on phone .798
Able to see a doctor quickly in last 6 months .815
Able to book ahead to see doctor in past 6 months .777
Easy to get appointment with practice nurse .712
Don't normally have to wait too long in surgery .744
Easy to call OOH service
18.527
.913
Easy to get medicines prescribed by OOH service .639
Speed of OOH service fine .911
Easy to speak to a doctor by phone
14.261
.823
Easy to speak to a nurse by phone .813
Easy to get test results by phone .466
Table 4: Empathy Factors
Factors extracted using Principle Component Analysis with
Varimax rotation. Loadings <.45 suppressed. % of Variance Explained by Factor
Factor Components Gen Nurse Care
Doctor treats you with care and concern .903
Doc/Nurse agreed with you how to deal with LT health problem .766
Doctor listens to you .916
Doctor involves you in decisions about your care .889
Doctor takes your problems seriously .921
Doc/Nurse took notice of your views about how to deal with LT
health problem 11.599 .762
Satisfied with the surgery opening hours .709
Doctor gave you enough time .903
Usually able to see preferred doctor .908
Doctor asks you about your symptoms .573
Nurse asks you about your symptoms .931
Nurse listens to you .924
Nurse treats you with care and concern 2.212 .876
Nurse involves you in decisions about your care .899
Nurse took your problems seriously .924
Had enough time with the nurse .863
8
Table 5: Development of SERVQUAL dimensions into Scales
Factor Cronbach’s Alpha Score No. of items
Responsiveness – General .877 – accept and keep 6 Responsiveness – OOH .715 – accept and keep 3 Responsiveness – Phone .619 – reject – too low 3 Assurance .883 – accept and keep 5 Empathy - General .963 – accept and keep 10 Empathy - Nurse .989 – accept and keep 6
Regression Analysis
Once the scales were confirmed, the mean score for each dimension of service quality was calculated and regression analysis was used to establish the impact of each of the 8 dimensions on patient satisfaction. There is a relevant satisfaction measure included within the GP Patient Survey; ‘Overall Satisfaction with Care’, which was used as the dependent variable, while the dimensions of service quality were used as independent variables in a multiple regression model. Although there was some evidence of collinearity between the General Empathy and Assurance variables, analysis showed that this was not significant enough to invalidate the model.
The model, as shown in Table 6, shows a very high R2 value of .938, showing that nearly 94% of all the variance in overall satisfaction with care can be explained by the dimensions of service quality. It also shows that the predictive model is a good fit with the data and therefore robust.
Table 6: Model Summary for SERVQUAL dimensions against Overall Satisfaction with Care
Model
(N=8362) R R
2 Adj.
R2 Durbin-Watson of Estimate Std Error F Sig Summary Model
All
Dimensions .968 .938 .938 1.847 .026 15735.155 .000 Good
Table 7:Regression of finalised SERVQUAL factors to establish relative importance
Dimension Unstandardised Coefficients Standardised Coefficients t Sig
B Std Err Beta
(constant) -.010 .003 -3.208 .001
Tangibles .268 .007 .238 39.946 .000
Reliability -.023 .002 -.030 -9.740 .000
Responsiveness - General .176 .005 .180 36.255 .000
Responsiveness - OOH .002 .001 .005 1.709 .088
Assurance -.136 .012 -.117 11.061 .000
Empathy - General .729 .009 .699 85.411 .000
Empathy – Nurse .052 .005 .054 10.708 .000
Empathy – Care -.072 .005 -.039 -13.652 .000
The predictive model, shown in Table 7, shows that the dimensions of service quality are significant predictors of satisfaction. Empathy is by far the most important factor, followed by Tangibles and then Responsiveness (General). Reliability, Empathy (Nurse and Care), along with the Responsiveness of the Out of Hours service, however, had a negligible impact on satisfaction, while Assurance appeared to have a small negative effect. As the expert panel showed, the majority of relevant questions in the GP Patient Survey are focused around the Empathy dimension, which suggests that the Survey does tend to focus on the issues that are of most importance to patients.
9
one variable was finally classified under the reliability dimension and that was by a majority rather than full consensus. This suggests that reliability – as defined in the SERVQUAL model – is both difficult to separate from some of the other dimensions and poorly measured in the GP Patient Survey. Secondly, it is unsurprising that the responsiveness of the Out of Hours service is not a significant predictor of satisfaction – as it could be considered a slightly different concept. Thirdly, there were some difficulties separating Assurance and Empathy both in the Expert Panel phase and in the statistical analysis. It appears that Assurance is an unreliable measure in this context.
Conclusion
This research considered 2 issues: the first was whether it is possible to identify a large-scale, generalisable method of measuring service quality in GP Surgeries. The second was whether service quality in GP Surgeries is a predictor of patient satisfaction.
The findings make both theoretical and practical contributions to the field. The relevance of the SERVQUAL framework to the GP surgery context and the link between service quality and satisfaction with care in this context are theoretical contributions. The practical contribution concerns the ability to measure service quality across GP surgeries in a standardised, generalisable and comparable way.
Theoretical Contribution
According to Parasuraman et al (1991), each of the SERVQUAL dimensions of service quality are conceptually distinct and have generic applicability. However, this research shows that, in the context of service quality in GP Surgeries, this is not the case. Firstly, the dimension of Reliability, as defined by the SERVQUAL framework, is not a distinct dimension in this context. During the expert panel, considerable confusion was found between Reliability and both the Assurance and Empathy dimensions, suggesting a lack of clarity between the dimensions when they are operationalised in practice.
In addition, there was an issue of collinearity between the Assurance and Empathy dimensions in the statistical analysis phase of the research. Although this was not serious enough to invalidate the regression model, the results showing that Assurance has a negative impact on service quality suggest that there is an issue to be resolved here and that perhaps alternative dimensions dealing with this aspect might be more appropriate in the GP surgery context. Therefore, this research has found that although it is possible to use some of the SERVQUAL dimensions to measure service quality in GP surgeries, further research is recommended to modify and refine the dimensions for use in this context.
A further contribution to theory stems from the strong link found between service quality and patient satisfaction in GP surgeries. This supports the existing literature (e.g. Miguel-Davilla et al, 2010), adding to the body of evidence that service quality is a predictor of satisfaction. However, this study goes further, by evaluating the relative importance of each dimension of service quality on patient satisfaction. Therefore, it is now possible to demonstrate that only the Empathy, Tangibles and General Responsiveness dimensions have a positive impact on patient satisfaction and that Empathy is the critical dimension of service quality in the GP surgery context.
Practical Implications
10
dimension of service quality as a predictor of patient satisfaction offers a clear policy imperative to drive improvements in these three key areas. Finally, the ability to measure service quality across surgeries and over time, through a standardised and highly generalisable survey tool, offers significant scope for future research, for example, evaluating the impact of service quality improvement initiatives over time, or comparing regions to look for potential variations in service quality.
Acknowledgements
The author would like to sincerely thank all the members of the expert panel for their generous time commitment and contributions which made this research possible.
References
Alrubaiee, L. & Alkaa’ida, F. (2011) “The Mediating Effect of Patient Satisfaction in the Patients’ Perceptions of Healthcare Quality – Patient Trust Relationship,” International Journal of Marketing Studies, Vol 3(1), pp103-127.
Andaeeb, S. (2001) “Service Quality Perceptions and Patient Satisfaction: A Study of Hospitals in a Developing Country,” Social Science & Medicine, Vol 52, pp1359-1370.
Campbell, J. Smith, P. Nissen, S. Bower, P. Elliott, M. & Roland, M. (2009) “The GP Patient Survey for Use in Primary Care in the NHS in the UK – Development and Psychometric Characteristics,” BMC Family Practice, Vol 10, doi: 10.1186/1471-2296-10-57.
Carman, J. (1990) “Consumer Perceptions of Service Quality: An Assessment of the SERVQUAL Dimensions,” Journal of Retailing, Vol 66, Spring, pp33-55.
Chow, A. Mayer, E. Darzi, A. & Athanasiou, T. (2009) “Patient-Reported Outcome Measures: The Importance of Patient Satisfaction in Surgery,” Surgery, Vol 146(3), pp435-443.
Cronin, J. & Taylor, S. (1992) “Measuring Service Quality: A Re-examination and Extension,” Journal of Marketing, Vol 56(3), pp55-68.
Desmet, S. Van Dierdonck, R. & Van Loy, B. (2003) “Servitization: or Why Services Management is Relevant for Manufacturing Environments” in Van Looy, B. Gemmel, P. & Van Dierdonck, R. (2003) Services Management (2nd Ed). FT Prentice Hall, London.
Kim, H. (2011) “Service Orientation, Service Quality, Customer Satisfaction & Customer Loyalty: Testing a Structural Model” Journal of Hospitality Marketing & Management, Vol 20(6), pp619-637. Lee, H. Lee, Y. & Yoo, D. (2000) “The Determinants of Perceived Servgice Quality and its Relationship
with Satisfaction,” Journal of Services Marketing, Vol 14(3), pp219-231.
Martin, L. Williams,S. Haskard, K & DiMatteo, MR. (2005) “The Challenge of Patient Adherence” Therapeutics & Clinical Risk Management, Vol 1(3), pp189-199.
Miguel-Davilla, J. Cabeza-Garcia, L. Valdunciel, L. & Florez, M. (2010) “Operations in Banking, The Service Quality and Effects on Satisfaction and Loyalty”, The Service Industries Journal, Vol 3(13), pp2163-2182.
Mori (2002) Measuring and Understanding Customer Satisfaction: A Mori Review for the Office of Public Services Reform, Mori, London.
Nguyen Thi, P.L. Briancon,S. Empereur, F. & Guillemin, F. (2002) “Factors Determining Inpatient Satisfaction with Care,” Social Science & Medicine, Vol 54, pp493-504.
Nunnally, J. (1978) Psychometric Theory (2nd Ed), New York, McGraw Hill.
Parasuraman, A. Zeithaml, V. & Berry, L. (1988) “SERVQUAL: A Multiple Item Scale for Measuring Customer Perceptions of Service Quality,” Journal of Retailing, Vol 64(1), pp12-40.
Parasuraman, A. Berry, L. & Zeithaml, V. (1991) “Refinement and Reassessment of the SERVQUAL Scale,” Journal of Retailing, Vol 69(4), pp420-460.
Ramsaran-Fowder, R. (2008) “The Relative Importance of Service Dimensions in a Healthcare Setting,” International Journal of Health Care Quality Assurance, Vol 21(1), pp104-124.
Sekaran, U. & Bougie, R. (2010) Research Methods for Business (5th Edition), Wiley, Chichester, UK.
Sliwa, M. & O’Kane, J. (2011) “Service Quality Measurement: Appointment Systems in UK GP Practices,” International Journal of Health Care Quality Assurance, Vol 24(6), pp441-452.
Tarn, J. (1999) “Effects of Service Quality, Perceived Value and Customer Satisfaction on behavioural Intentions,” Journal of Hospitality & Leisure Marketing, Vol 6(4), pp31-43.
Torres, E (2014) “Deconstructing Service Quality and Customer Satisfaction: Challenges and Directions for Future Research,” Journal of Hospitality Marketing & Management, Doi:10.1080/19368623.2014.846839