Measurement Science and Technology 2016 Special Issue AIM²
Measuring Structure Deformations of a
Composite Glider by Optical Means
with on-Ground and in-Flight Testing
Jerzy Bakunowicz
1, Łukasz Święch
1, Ralf Meyer
21 Rzeszow University of Technology, al. Powstanców Warszawy 12, 35-959 Rzeszow, Poland
2 German Aerospace Center (DLR), Institute of Aerodynamics and Flow Technology, Dept. Experimental Methods, Bunsenstr. 10, 37073 Goettingen, Germany
Email: [email protected], [email protected]
Abstract
In aeronautical research experimental data sets of high quality are essential to verify and improve simulation algorithms. For this reason the experimental techniques need to be constantly refined. The shape, movement or deformation of structural aircraft elements can be measured implicitly in multiple ways; however, only optical, correlation-based techniques are able to deliver direct high-order and spatial results. In this paper two different optical metrologies are used for on-ground preparation and the actual execution of in-flight wing deformation measurements on a PW-6U glider. Firstly, the commercial PONTOS system is used for static tests on the ground and for wind tunnel investigations to successfully certify an experimental sensor pod mounted on top of the test bed fuselage. Secondly, a modification of the glider is necessary to implement the optical method named Image Pattern Correlation Technique (IPCT), which has been developed by the German Aerospace Center DLR. This scientific technology uses a stereoscopic camera set-up placed inside the experimental pod and a stochastic dot matrix applied to the area of interest on the glider wing to measure its in-flight deformation. The flight test installation, including the preparation, is described and results are presented briefly. Focussing on the compensation for typical error sources, the paper concludes with a recommended procedure to enhance the data processing for better results. Within the presented project IPCT has been developed and optimized for a new type of test bed. Adapted to the special requirements of the glider, the IPCT measurements were able to deliver a valuable wing deformation data base which now can be used to improve corresponding numerical models and simulations.
1
Introduction
In aircraft design, durability and strength assessment of airframe structures have for a long time been crucial design issues. Right from the beginning experimental verification of engineering solutions has been, and still remains, a mandatory evolution step for new aircraft development.
The primary parameter that directly delivers information about the behaviour of a loaded structure is its deformation. Several methods and metrologies have been developed and refined up to a level of satisfactory resolution and accuracy. Discrete methods with mechanical or electrical transducers were established to measure deformation or strain distributions. Up until the present day the most widely-used sensors are strain gauges, but also photo-stress and moiré techniques are in use. However, direct high-order results can only be measured by optical means such as marker- and correlation-based methods suitable for the harsh flight test conditions.
Since the 1960s the principle of image correlation has been used for velocity, strain and deformation investigations [1]. The continuous development of digital methods in image recording and processing has kept pace with the industrial requirements in geometry and shape identification. Not only experimental mechanics utilized and advanced digital image correlation (DIC) techniques [2][3]. Today, laboratory or industrial applications of digital image processing techniques for reverse geometry acquisition, deformation and strain measurement, mechanical property determination (and many others) have become common engineering tools and can be purchased [4][5]. Beyond a certain range of applications, as given by manufacturers of test equipment, other measurement scenarios such as flight test campaigns, requiring specialized measurement set-ups, are even more demanding. Therefore, the introduction of DIC to flight testing took about a decade and was limited to large or stiff aircraft structures [6][7][8]. Further examples can be found in Daly [9]. Recent publications evince the importance of DIC approaches for experimental in-flight applications up until now [10].
This contribution presents an investigation of the wing deformation of a composite glider wing using a DIC method. A promising approach to collect accurate spatial and time-resolved deformation data is the Image Pattern Correlation Technique (IPCT), which has been developed specially for in-flight and wind tunnel applications. In chapter 2 basic information about the methodology of IPCT are presented, followed by a description of the IPCT measurement set-up and the basic flight test instrumentation of the glider in the subsequent chapter. The paper focusses on the reliability of the installation and the assessment of error sources induced by the deformation of the experimental camera pod. Chapter 5 provides exemplary deformation results and their transferability to validate finite element method calculations. Also advanced evaluation algorithms are discussed in order to further improve the deformation results.
The IPCT set-up had to be tailored to the special requirements of the test bed in terms of limited space, weight and power because the technology has not been applied to a glider before [11]. Furthermore, the preparation and performance of this experimental investigation was supposed to be a representative, industry-related application scenario.
2
Principles of the Image Pattern Correlation
Technique
by the German Aerospace Center DLR and co-funded by the European Commission [14][15][16].
A monoscopic (one camera) IPCT installation requires predefined geometry input of the measured surface for an accurate deformation evaluation [17]. Whereas a multi-camera set-up (two cameras or more) does not need additional geometry data which makes the second approach more flexible and commonly usable for flight test applications or wind tunnel tests.
Figure 1 shows a schematic IPCT set-up with two cameras observing a dedicated surface section from different viewing angles and the subsequent processing steps for a direct 3D measurement. The evaluation algorithms of IPCT are based on cross-correlation of a random dot pattern applied to the measured surface and on photogrammetry. A multi-pass mapping results in a detailed reconstruction of the 3D surface and consists of an iteratively repeated sequence of dewarping and correlation followed by a triangulation.
3
Measurement equipment and error
estimation
3.1 Measurement set-up
In order to be able to carry out a global wing deformation measurement, a stereo IPCT installation has been chosen, as discussed in chapter 2. Special boundary conditions of the measurement related to the use of a glider as a test bed, strongly influenced the IPCT set-up design in terms of its miniaturization, simplicity and power management.
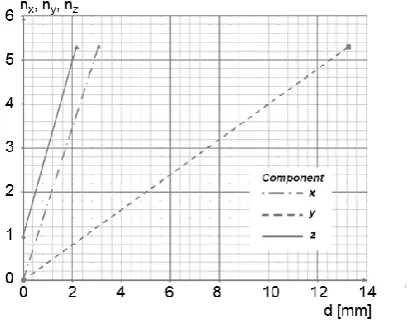
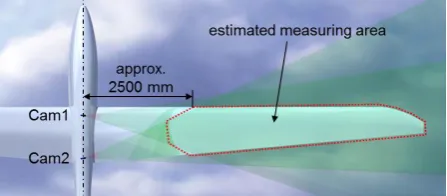
Accuracy estimations according to Kraus [18] and a digital mock-up (DMU) were used for a virtual pre-definition of all relevant camera system parameters such as type, lens, position and alignment (see Figure 2). The dependent parameters of the error estimation plotted in Figure 3 are the sensor size, the pixel size, the focal length, the distance between the cameras and the relative position of the cameras towards the region of interest.
In case of major design-related concerns or constraints about the camera distance, the base width (parameter b) should be larger than or equal to 800 mm (see Figure 3). For smaller values the stereoscopy processing algorithms may encounter difficulties and the ensuing uncertainty could then exceed an acceptable limit. With due consideration of the expected measuring error, a base width of b = 1000 mm was chosen.
For the actual dimensions of the measuring area (small lateral extent but large expansion along the line-of-sight of the cameras), the focal length should not be smaller than 12.5 mm because of wide-angle image distortion effects. So, to maximise the overlapping field of view of both cameras, a vertical camera format and an assumed focal length of 12.5 mm have been used.
[image:3.595.65.404.52.246.2]Two monochrome CCD cameras of the type JAI CV-A2 have been chosen with an image resolution of 2 MPx. In order to achieve an appropriate viewing angle relative to the measurement area on the upper surface of the port wing, the cameras were positioned at a height of 1.5 m above the aircraft centreline.
Figure 2 Digital mock-up of camera position and relevant field of measurement
[image:3.595.315.539.649.747.2]Figure 3 Results of theoretical error estimation according to
Kraus [18] in spanwise direction for increasing distance between the stereo cameras b [mm]; half span normalized with
[image:4.595.69.271.297.627.2]respective spanwise position; relative error based on finally adopted b = 1000 mm
Table 1: Adaptation of IPCT pattern properties
Section Size [mm]
Stretch factor [-]
Density (min. distance) [mm]
min root
3.0 2.2 2.4
max 3.4 3.6 2.6
min
tip 4.5 3.8 3.4
max 6.8 6.2 4.8
Figure 4 View from the left IPCT camera of the port wing of the PW-6U test bed with root and tip measurement sections
shown in the dashed line boxes
Both cameras were adjusted to the same field-of-view on the port wing for a stereoscopic processing of the two applied IPCT pattern sections (“root” and “tip”) which are depicted in Figure 4. The IPCT pattern consists of a random dot matrix and a grid of checkerboard markers which has been imprinted as a
whole on an adhesive exterior aircraft film (thickness 0.08 to 0.10 mm). In order to minimize the interaction with the aerodynamic performance of the wing the prepared IPCT pattern sheets were applied in large segments starting well downstream the stagnation point on the lower surface via the leading edge through to the trailing edge of the main wing element. There was a cut-out around the speed brake. To project a homogenous distribution of round dots onto the camera sensors, the dot matrix was adapted in spanwise direction by changing the three parameters: size, elliptic stretch and density which are numbered in Table 1. During the data processing the checkerboard markers supported the initial mapping of the stereo images.
3.2 The flying laboratory
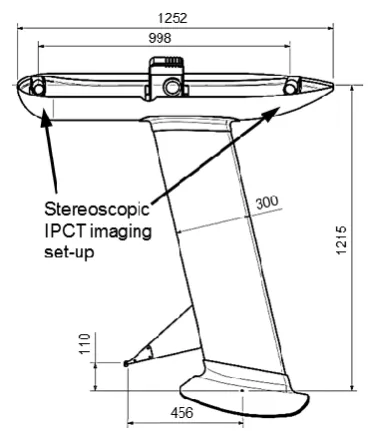
The research aircraft based on a serial PW-6U glider was modified to carry additional scientific data recording equipment. A dedicated joint construction implemented in the monocoque airframe enables a simplified mounting of scientific installations to the stiff composite glider fuselage. In order to fulfil the boundary conditions for image recording of the deformed wing, as described in section 3.1, two IPCT cameras (stereoscopic imaging set-up) were installed in a specially designed housing attached to the fuselage by a vertical pod. Figure 5 presents the geometry of the pod and Figure 6 shows the camera installation attached to the fuselage of the test bed.
The image sets were recorded during flight and stored on a control computer which was mounted in a wooden rig in the rear cabin (Figure 7), where the back seat of the pilot had been removed. In addition a separate power supply unit as well as wiring for power supply and data transfer between the cameras and the control computer were installed on board. A flight data recording system (FDRS) was also implemented to the glider to log and provide all relevant flight parameters for the IPCT data analysis (probe see Figure 6, computer see Figure 7).
Figure 5 Geometry of the camera pod without housing cover and with schematic IPCT camera dummies; including main
[image:5.595.58.285.302.433.2]dimensions
Figure 6 Dorsal camera pod installation on the PW-6U glider; (1) composite mast, (2) two IPCT cameras, (3) aerodynamic
probe for pressure and α-β-angle measurement, (4) one infrared thermography (IRT) camera, (5) disassembled
housing cover
Figure 7 Flight test installation in the rear cabin; (1) two control computers for IPCT and IRT, (2) wooden rig attached to the glider at the position of the removed rear pilot seat, (3)
power supply unit, (4) FDRS unit
FDRS parameter set:
angles of attack and sideslip,
static and dynamic pressure for velocities and barometric height calculations,
pitch, roll and yaw angle, GPS position, altitude and time,
angular rates and accelerations of the airframe. A probe boom (pressure, angles) was fitted in front of the camera fairing (see Figure 6). Detailed information about the FDRS operated during the presented measurement campaign can be found in Kopecki and Rzucidło [19].
4
Testing
4.1 Strength, deformation and stability
assessment of the camera pod
For experimental in-flight measurements, a composite camera pod was designed to carry various scientific sensors such as the IPCT cameras. It is made largely of a carbon fibre epoxy composite sandwich structure with a polyurethane core, with some parts also being made of a glass fibre epoxy composite.
Due to the airworthiness regulations of the aviation authorities, the strength and reliability of the pod had to be investigated before its in-flight operation. Additionally, analytical studies of the flight stability of the modified glider were recommended.
The pod deformation (magnitude and direction) was measured during two separate ground test sequences. Firstly, there was a series of static tests according to the CS-22 requirements for gliders [20]. Altogether five critical load cases have been covered, encompassing the identified limits of the reduced flight envelope. The magnitudes of the forces equalled the limit loads acting on the camera pod during the most adverse manoeuvres that were expected during flight, according to CS.22.337, CS.22.363(a)(b) and CS.22.473(b)(ii), which cover symmetrical loops, inertia forces acting on elevated masses as well as hard landings. The tested load cases are listed in Table 2.
[image:5.595.56.283.500.677.2]have been induced to the structure by a system of pulleys and weights.
Table 2: Test cases for static simulation of critical load cases
# Load case Force [N]
1 forward bending P1 500
2 backward bending P2 500
3 torsion P3 300
4 side bending P4 600
[image:6.595.312.538.158.327.2]5 coupled side bending and torsion P3 + P4
Figure 8 Schematic layout of the static tests; indices refer to load case number 1 to 4 introduced in Table 2
An optical 3D scanner of the type GOM PONTOS was used to record structural deformations, as shown in Figure 9. This commercial system is based on a spatial photogrammetry method. It registers the 3D position of circular targets attached to the pod structure, which can be translated into a spatial deformation field. The accuracy of these optical measurements depends on the quality of the calibration and is approximately 0.2 mm in this case. The marker detection algorithm of IPCT could have been applied for this purpose as well. But for this standard application the accuracy and the way of handling of the commercial GOM PONTOS device proved to be sufficient. Examples of a wide range of non-linear deformation field measurements confirm the applicability of the PONTOS system and can be found in [21].
During the static tests carried out on the ground, no significant or unexpected deformations, as well as no damage to the structure have been measured. Thus, this result fulfils the authority requirements for the airworthiness of the sensor pod construction.
As expected the largest bending magnitudes were measured for load case 4 in lateral direction, accounting to about 11 mm of displacement at a reference position
close to the force transmission point as shown in Figure 10. Due to the fact that the maximum displacements appear at limit loads according to airworthiness regulations, the effective deformation magnitudes are expected to be smaller during flight testing.
The deformation results of the camera pod under limit load conditions are presented in Figure 11.
[image:6.595.312.535.361.509.2]Figure 9 Experimental arrangement during static deformation measurements of the loaded pod structure
Figure 10 Deformation vector field result of the pod for side bending load case 4; deformation magnitude according to
assigned colour scale
Figure 11 Displacement components of cameras due to respective acceleration component (ref. coordinate system
[image:6.595.324.532.557.718.2]These data enable an estimation of potential camera movements during sustained flight manoeuvres. A comparison of the plot of Figure 11 with respective flight manoeuvre data shows that the estimated uncertainty of the camera position caused by the accelerated movement of the gliders centre of gravity does not exceed 1 mm ± 0.2 mm.
Figure 12 Glider fuselage with mounted camera pod, without wings and horizontal stabiliser in the working section of the
wind tunnel T-3 (at ILOT) during the test
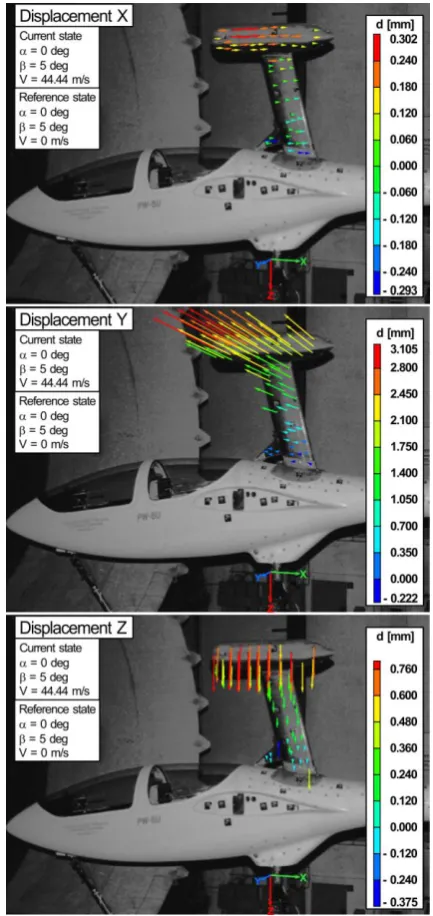
In addition to the static tests on the ground, the flight stability of the glider with the mounted pod has also been investigated in the wind tunnel T-3 (nozzle outlet diameter 5 m) at the Institute of Aviation in Warsaw (ILOT). Figure 12 shows the set-up. Here, potential interactions of the pod with the directional stability had to be identified in terms of changed forces and moments acting on the fuselage of the glider. The fuselage together with the attached pod but without wings and horizontal stabiliser underwent a series of tests. The measurement matrix included a parameter variation of the airflow velocity, angle of attack, angle of side slip and the rudder deflection angle. During the tests there was no critical or unexpected behaviour which may deter the certification of the airworthiness of the modified glider. Figure 13 shows screenshots of the measured X, Y and Z deflection of the pod on the glider during the tests in the wind tunnel. The required deformation field data have been captured with the same measurement device as in the static strength tests. Flying manoeuvres in the actual flight testing should result in structure deformations within the pretested range of magnitude. The expected uncertainty of the camera position caused by aerodynamic forces acting on the pod during the flight does not exceed
[image:7.595.59.282.159.299.2]3 mm ± 0.2 mm. But for the analysis of IPCT image data recorded during symmetrical sustained manoeuvres the displacement magnitude is smaller.
Figure 13 Screenshots of the pod deflection measurement during the wind tunnel test for the most adverse simulated flight condition of the investigation; 5 deg side slip angle, 44.4
m/s max. operational flow velocity; top down separated components of deformation field in longitudinal (X), lateral
(Y) and vertical (Z) direction; colour code pertains to (directional) deformation magnitude
3 mm ± 0.2 mm or better. Bearing in mind that the IPCT measurement points were recorded at quasi-stationary conditions of symmetrical and sustained manoeuvres put the expected accuracy in perspective.
4.2 The flight testing
A detailed description of the flight test campaign can be found in [11]. Altogether two certification and five valid test flights were performed from the EPRJ airfield in Rzeszów, Poland. Therefore, the modified glider was taken to its requested height and location by towing with a powered aircraft (aerotow). Deformation data were recorded in gliding flight, symmetrical and turn manoeuvres.
5
Analysis of IPCT data
The details of flight data analysis of several load cases are described in Bakunowicz and Meyer [11] as well as Boden et al. [22]. This contribution addresses a
subsequent application of transformed results and error sources while processing the image data.
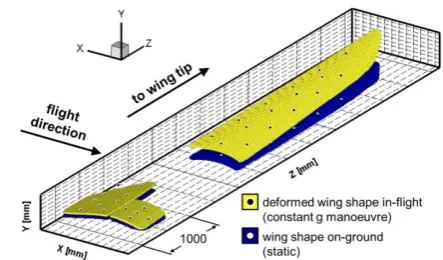
There is an IPCT recalibration tool described by Kirmse [23] which is able to compensate for temporary or permanent misalignments of the stereo camera set-up itself. But the stiff mounting of the IPCT cameras on a glass fibre plate avoided disturbances that may have affected the proper calibration of the stereo imaging set-up. Moreover, an effect of potential lateral movement of the camera pod during the IPCT measurements could not be observed while processing the data. Short-term longitudinal displacements with small magnitude were filtered, knowing that only up- and downward movements of the wing structure were expected. Figure 14 shows a representative example, comparing the wing shape measured with IPCT on the ground and in-flight. The deformation of the flight shape wing is clearly visible towards the tip. For this sustained quasi-stationary load case, averaged over a recording sequence of 1 s, with a nearly constant vertical acceleration of +1.75 g ± 0.12 g, the wing tip moves upwards about 400 mm compared to the wing measured on the ground (levelled glider, dead load).
Additionally, a finite element method (FEM) model of the starboard glider wing was available. In order to link
[image:8.595.316.538.369.499.2] [image:8.595.312.536.561.711.2]the measured IPCT data of the port wing with the numerical model, the IPCT results of this measurement point have been transposed accordingly. The IPCT processing tool allowed projecting the deformation data onto a reduced FEM mesh generated with the MSC Patran pre-processor as presented in Figure 15. Therefore the IPCT results had to be transformed and aligned to the FEM mesh. This data projection links the IPCT measurement with the numerical grid which is the input for FEM calculations. The file contains the node coordinates, three components of the node deflection in the previously assumed set, the overall magnitude of this deflection, the triangulation error and a flag. The triangulation error is an indication to the precision of the data match. Owing to the fact that the FEM nodes and the IPCT dot matrix have different physical collocations, the IPCT data had to be interpolated to the FEM grid. A flag of minus one was set where the data projection was not feasible for any reason.
Figure 14 IPCT result comparing the reconstructed wing shape on the ground (unloaded, dark-coloured) and in the flight (light-coloured, symmetrical load of 1.75 g); light and dark dot matrix represents evaluated marker positions of each load case
Figure 15 Magnitude of the measured wing deformation assigned to the FEM mesh (symmetrical load of 1.75 g); yellow outlines: deformed wing shape measured with IPCT,
grey scatter contour: unloaded FEM grid, colour scale of interpolated vector field pertains to deformation magnitude in
In Figure 16 the wing shape measured with IPCT on the ground is projected on the FEM model in order to assess the resemblance of these two reference conditions. The difference is in the range of ± 25 mm and could further be reduced by improving the data transformation. This offset has to be taken into account while using the transferred IPCT measurement results.
Figure 16 Wing shape measured with IPCT on the ground assigned to the mesh of the FEM model; colour scale pertains
to the offset between the two data sets
The MSC Patran pre-processor allows defining load settings in a discrete form, also using bulk data of vector fields. All numerically analysed cases were assumed to be linear and static because the underlying IPCT results have been averaged over a short time span with constant physical parameters. The calculation time was similar to the simulations performed with load distribution based on force vectors. Hence, the extent of the implemented displacement data has not affected the overall calculation performance at all. With reference to Boden et al. [22] first results of numerical simulations with
IPCT data implemented into the FEM processor agree with the conventionally loaded FEM model calculations. The calculation of the ground shape relative to the unloaded numerical model is just one piece of valuable information that can now be extracted for data comparisons and further analysis.
During the data processing with the DLR in-house IPCT software package there are two crucial error sources [24]. The software uses the evaluated point correspondences of the marker grid for an initial stereo mapping of the image pairs. Additionally, for each processed pattern section (defined by masking all non-relevant parts of the image) one of the adjustable parameters is the number of evenly distributed sampling points. They are used for a detailed mapping and are spread automatically over the selected evaluation area using a minimum distance criterion. This randomized routine is not linked to the real geometry of the
measured object and may lead to poor results, especially in areas with difficult conditions, e.g. enhanced curvature, edges or steps and increasing distance from the camera sensors. A repeated processing of the selected area without changing the parameter set can compensate for this effect and improve the IPCT result. A second important issue is de-calibration, which refers to temporary or permanent changes of the calibrated camera parameters such as camera position, camera alignment or defocusing. The so called triangulation error is a measure (in pixels) for the precision and
quality of the triangulation of a certain point. The smaller the value the better is the 3D result. The IPCT processing is usually aiming for triangulation errors between 0 and 1 pixels (or slightly larger) whereas a value of 5 pixels is a definite cut-off. Vibrations, shocks or other sources of random errors can affect the quality of an IPCT measurement. Here, an averaging over a reasonable time series (static conditions) or the combined analysis of repeatable manoeuvres (dynamic conditions) can deliver reliable data sets.
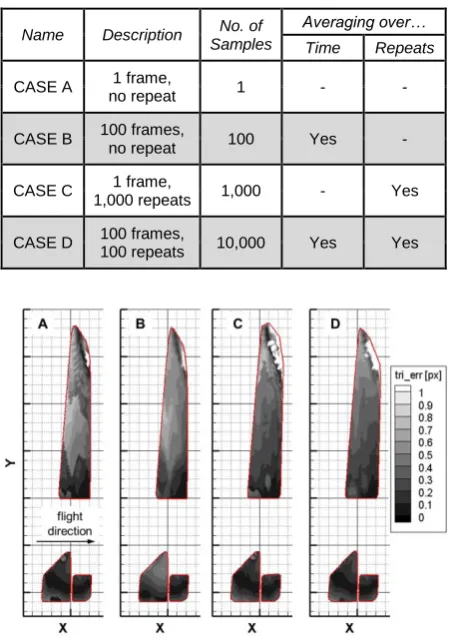
Averaging a series of related data sets is a simple and effective approach for an advanced data analysis, but is also expensive in terms of computation time. As an example, a recording of the wing with a stationary and levelled glider on the ground has been chosen. No obvious physical changes had been induced during the recording of this test sequence which makes it a valuable static reference condition for the following analysis.
Table 3: Processing matrix
Name Description No. of Samples
Averaging over… Time Repeats
CASE A 1 frame,
no repeat 1 - -
CASE B 100 frames,
no repeat 100 Yes -
CASE C 1 frame,
1,000 repeats 1,000 - Yes
CASE D 100 frames,
100 repeats 10,000 Yes Yes
Figure 17 Static on-ground wing shape evaluated with IPCT for CASES A to D (from left to right), greyscale pertains to
triangulation error in pixel and not to deformation
CASE B, where 100 subsequent frame sets have been processed once with IPCT, presents a more even error distribution at a comparable level in the tip section and slightly larger error values in the root section. With 1,000 repeated evaluations of the single CASE-A-frame without changing the parameters, CASE C shows an improved triangulation error level in almost all sections, but also an extended area with errors larger than 1 pixel near the leading edge of the tip. The best result is CASE D for which the 100 frames of CASE B have been processed 100 times each. Still, there is a problematic area near the tip which does not further improve. This is because at the leading edge of the wing tip there are not sufficient IPCT pattern dots for a good correlation and furthermore the increasing surface curvature and the flat viewing angle cause a poor imaging quality of those dots that are there.
Because the IPCT processing returns a 3D scatter diagram as a surface result (see Figure 14), the number of sampling points of the regularised grid (mesh size 5 mm) delivers information about the size and shape of
the reconstructed IPCT surface in the X-Y-plane (i.e. spatial information content). This is quantified in Table 4 for CASE A to D and indicates an increase of the size of +9.1 % (C) and +3.7 % (D) mainly assigned to the tip section.
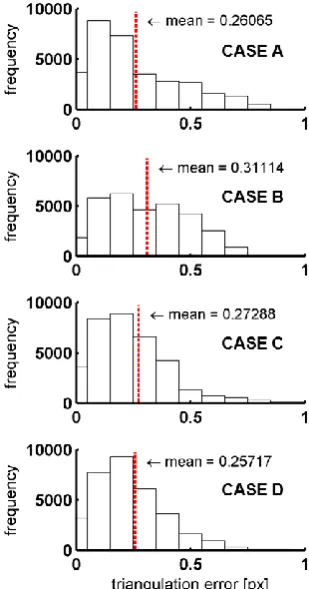
For a better assessment of the triangulation error distribution Figure 18 shows four histograms excerpts with collected error values in 0.1 pixel segments and respective arithmetic mean values for each case. Here, CASE D is the best result because the mean triangulation error value is the smallest.
As mentioned before the smaller the triangulation error the better is the local IPCT result. Thus, the count of each histogram segment (bin count) can be multiplied with its corresponding triangulation error (bin value) to illustrate the accumulation of the weighted histogram values according to equation (1):
𝑓(𝑥
𝑖) = ∑(𝑏
𝑘∙ 𝑁
𝑏,𝑘)
𝑖𝑘=1
with:
xi maximal cumulated triangulation error,
k bin control variable,
i number of maximal cumulated triangulation error bins,
b bin value,
[image:10.595.323.530.507.590.2]Nb bin frequency (count).
Table 4: Number of sampling points of the IPCT result of CASE A to D itemised into root section, tip section and total
(suffix k stands for 103)
Name # Root # Tip # Total Rel. size
CASE A 18.3k 14.0k 32.3k ref.
CASE B 18.2k 13.2k 31.4k -2.7 %
CASE C 18.1k 17.1k 35.2k +9.1 %
CASE D 17.9k 15.6k 33.5k +3.7 %
A plot of the function (equation 1) for each of the four cases is presented in Figure 19. The weighted and cumulated triangulation error values up to one and up to five pixels are collected in Table 5. These numbers refer specifically to this single application and additionally do not have a link to the actual size of the reconstructed surface. Hence, comparability has been enabled by normalizing the values with the total number of sampling points of each test case (for reference see Table 4, 4th col.).
Figure 18 Excerpts of the triangulation error histograms from 0 to 1 pixel for the data sets of CASE A to D with respective
[image:11.595.56.268.400.490.2]mean values (dotted line)
Figure 19 Cumulated sums of the weighted, extended histogram values from 0 to 5 pixels for CASE A (circles), B
[image:11.595.311.539.437.561.2](triangles), C (squares) and D (diamonds)
Table 5: Cumulated weighted triangulation errors up to one pixel and up to five pixels; respective ratios normalized with
total number of sampling points (ref. Table 4, 4th col.)
Name
Sum of weighted triang. errors
up to 1 px
Ratio
Sum of weighted triang. errors
up to 5 px
Ratio
CASE A 8,1k 0.2521 8,4k 0.2597
CASE B 9,6k 0.3046 9,8k 0.3118
CASE C 8,1k 0.2290 9,6k 0.2715
CASE D 7,7k 0.2289 8,5k 0.2553
In the range of the histogram up to a triangulation error of one pixel CASE D performs best because it cumulates the smallest amount of weighted triangulation errors. But obviously contributions above one pixel still
cumulate, especially for CASES C and D. Taking the amount of spatial information into account, CASE D should still be preferred although it falls slightly behind the absolute sum of weighted triangulation errors of CASE A. This is because CASE D covers a larger reconstructed area and hence delivers more spatial and more detailed information about the measured object than a single IPCT frame result without repeated processing (for comparison see Figure 17).
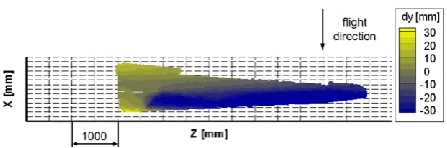
Applying this enhanced processing routine to IPCT data that were recorded in-flight improves the results a lot with respect to an expectedly small gain of spatial information and a considerably reduced error level. Figure 20 shows the previously described measurement point of a symmetric manoeuvre with constant wing load as a top view 2D plot (ref. Figure 14). Here, the average error drops significantly from ± 20.2 mm to ± 8.3 mm which indicates a much more detailed
[image:11.595.51.291.575.690.2]reconstruction of the measured wing shape. With respect to a range of several hundred millimetres of measured deformation at the wing tip this enhanced accuracy of about 2 % to 5 % is better than expected and acceptable for the final data reduction.
Figure 20 Exemplary comparison of resulting error between standard and proposed enhanced IPCT processing; symmetric
manoeuvre with constant wing load; top averaged standard evaluation of a time series, bottom result averaged over
repeatedly processed time series
The increasing effort, which in most cases is processing time, is the major drawback of this approach. For the presented example a single processing of an image pair took about 0.5 to 1 minute depending on the processing power available.
6
Conclusions
structural wing deformation of a glider in-flight. The technology is based on DIC and named Image Pattern Correlation Technique (IPCT). An overview is given of the measurement set-up, the preparation of the test bed and the data analysis. IPCT was specially designed for scientific in-flight experiments. Additionally, another commercial off-the-shelf DIC technique for assessing the stability and strength of the camera pod has been used and the respective testing on the ground and in the wind tunnel was described briefly.
The main purpose of the experiment was the recording of wing deformation in flight conditions as well as an advancement of the measurement technology itself. Besides the general report of the flight test preparation and conduction of the measurements, the contribution focusses on the identification and the assessment of error sources.
Three significant sources of error were identified, that may affect the overall measurement result:
Influence of optical equipment parameters and geometry;
Deformation of camera pod under flight loads; Data post processing.
Regarding the first one, the preparation of the geometric set-up, presented in section 3.1, showed that it can be considered as systematic error. Its value changes with the distance between camera sensor and region of interest on the measured object. In the presented installation the magnitude of this error is better than seven millimetres towards the wing tip.
The next two error sources listed above seem to be stochastic. Extra shares of random errors add up to a total averaged error of about 10 to 20 millimetres for IPCT data recorded in-flight because of fluctuating flight parameters (aerodynamic interaction, inertia). No significant influence of the camera pod deformation, measured during pre-tests and discussed in section 4.1, was observed while processing the IPCT data. Further investigation on dependencies between acting forces in-flight and potential camera pod movements would be required for IPCT measurements of more adverse, non-symmetrical and dynamic manoeuvres. The actually recorded in-flight data showed loading on the test bed
well below the limiting load-cases simulated during the static certification tests on the ground and in the wind tunnel.
The standard IPCT processing performs a onetime evaluation of each image pair. In case the outcome does not have the desired quality, the results can be enhanced as discussed in the present paper by applying the following IPCT processing procedures:
Repeated processing of image pairs, which leads to a systematic elimination of random errors during the data processing (in this application the overall averaged error was reduced by half).
Averaging in the dimension of time delivers real additional information about the measurement area (in this application combined with a repeated processing up to +4 % of spatial information compared to the standard onetime evaluation of a single image pair).Referring to the estimated error of 0.70 % at the wing tip with an assumed base width of b = 1000 mm (see Figure 3), the overall error level amounts to 0.25 % at the wing tip for a static IPCT reference recording on the ground. Inducing quasi-stationary aerodynamic loads in-flight adds a significant stochastic share to the error, which then sums up to 2.01 % at the wing tip for the enhanced IPCT processing (averaged over time and repeats, CASE D). The final real base width was measured with beff = 1032.5 mm for both load cases which are also depicted in Figure 14.
Advance in the development of parallelized and accelerated IPCT processing software will be one of the main areas of work in the near future.
Acknowledgments
The presented work and results were co-financed by the European Commission, 7th Framework Program within the project AIM² (Advanced In-Flight Measurement 2), Grant Agreement 266107.
References
[1] Ator, J.T. Image velocity sensing by optical correlation. Applied Optics 5 (1966): 1325-1331. [2] Sutton, M.A., Walters, W.J., Peters, W.H., Ranson,
correlation method. Image Vision Computing 1
(1983): 133-139.
[3] Chu, T.C., Ranson, W.F., Sutton, M.A. Petters, W.H. Applications of digital-image-correlation techniques to experimental mechanics.
Experimental Mechanics 3 (1985): 232-244. [4] Withers, P.J. Strain Measurement by Digital Image
Correlation. Strain 44 (2008): 421-422. doi: 10.1111/j.1475-1305.2008.00556.x. [5] Pan, B., Qian, K., Xie, H., Asundi, A.
Two-dimensional image correlation for in-plane displacement and strain measurement: a review. Meas. Sci. Technolo. 20 (2009),
doi:10.1088/0957-0233/20/6/062001.
[6] Yip, L.P., van Dam, C.P., Whitehead, J.H., Hardin, J.D., Miley, S.J., Potter, R.C., Bertelrud, A., Edge ,D.C., Willard, P.E. The NASA B737-100 high-lift flight research programme - Measurements and computations. Aeronautical Journal 99 (1995): 372-386.
[7] Fleming, G.A., Burner, A.W. Deformation measurements of smart aerodynamic surfaces. Proceedings of the Society of Photo-optical Instrumentation Engineers (SPIE) 3783 (1999): 228-238. doi: 10.1117/12.365741.
[8] Burner, A.W., Lokos, W.A., Barrows, D.A. In-flight aeroelastic measurement technique
development. Proceedings of the Society of Photo-optical Instrumentation Engineers (SPIE) 5191
(2003): 186-199. doi: 10.1117/12.504157. [9] Daly, S. H. Digital Image Correlation in
Experimental Mechanics for Aerospace Materials and Structures. Encyclopedia of Aerospace Engineering. Wiley (2010).
[10]Li, L.G., Liang, J., Guo, X., Guo, C., Hu, H., Tang, Z.Z. Full-field wing deformation measurement scheme for in-flight cantilever monoplane based on 3D digital image correlation. Meas. Sci. Technolo 25 (2014), doi: 10.1088/0957-0233/25/6/065202.
[11]Bakunowicz, J., Meyer, R. In-Flight Wing Deformation Measurements on a Glider. Flight Operations Conference, Royal Aeronautical Society, London 3rd-5th November 2014; Aeronautical Journal (in press), doi: 10.1017/aer.2016.98.
[12]Kompenhans, J., Schröder, A., Engler, R., Klinge, F., Stasicki, B. Development and application of image based measurements techniques for aerodynamic investigation in wind tunnels. International Conference High Speed Flow: Fundamental Problems, 21st-24th of September 2004, Zhukowsky, Russia.
[13]Kompenhans, J.; Agos, J.; Egami, Y.; Engler, R.; Fey, U.; Frahnert, H.; de Groot, K.; Henne, U.; Kirmse, T.; Klein, C.; Klinge, F.; Konrath, R.; Koop, L.; Mattner, H.; Otter, D.; Pallek, D.; Sachs, W.; Schröder, A.; Stasicki, B. Recent
Developments of Image Based Measurement Methods for Application to Transonic Flows in Industrial Wind Tunnels. Chinese Journal of Aeronautics, Vol. 19 (No. 2), pages 115-125, AAAS, 2006, ISBN CN 11-1732/V. ISSN 1000-9361
[14]Petit, Ch., Jentink, H., Boden, F., Kannemans, H., Veerman, H., Kirmse, T. Introducing a new measurement method for wing twist and bending. ETTC 2009, Toulouse, France, 24th-26th June 2009.
[15]Boden, F., Kirmse, T., Weikert, T., Wolf, T., Petit, C., Jentink, H. Application of a new optical Measurement Technique for Non-Intrusive Wing Deformation Measurement on a Large Transport Aircraft. 21st SFTE (EC) Symposium, 3rd – 6th of October 2010, Vergiate (VA) Italy.
[16]Boden, F., Lawson, N., Jentink, H.W., Kompenhans, J. (Eds.) Advanced In-Flight Measurement Techniques. ISBN 978-3-642-34738-2, Springer 2013.
[17]Veerman, H., Kannemans, H., Jentink, H. High Accuracy In-Flight Wing Deformation
Measurements Based on Optical Correlation Technique. NLR-TP-2008-718, Amsterdam Netherlands, 2008 (presented at 19th SFTE(EC) Symposium, Manching, EADS, Germany, paper 3-2, 22th-24th September 2008.
[18]Kraus, K. Photogrammetry – Geometry from Images and Laser Scans. 2nd Ed., Walter de Gruyter, Berlin, 2007, ISBN 978-3-11-019007-6. [19]Kopecki, G., Rzucidło, P. Integration of optical
measurement methods with flight parameter
measurement systems. Meas. Sci. Technol. 27
(2016), 054003 (7pp), doi:10.1088/0957-0233/27/5/054003
[20]CS-22 Certification Specifications for Sailplanes and Powered Sailplanes. Amdt.2, 2009.
[21]Kopecki, T., Święch, Ł. Experimental and numerical analysis of post-buckling deformation states of integrally stiffened thin-walled
components of load-bearing aircraft structures. J Theor App Mech, 52(4), pp.905-916, 2014 [22]Boden, F., de Groot, K., Meyer, R., Bakunowicz,
J., Rzucidło, P., Smusz, R., Szewczyk, M., Szumski, M. Flow and Structure Deformation Research of a Composite Glider in Flight
Conditions. 46th Annual International Symposium of the Society of Flight Test Engineers 2015, Lancaster, California, USA 14 – 17 September 2015, ISBN: 978-1-5108-1372-4, pp.138-147. [23]Kirmse, T. Recalibration of a stereoscopic camera
system for in-flight wing deformation measurements. Measurement Science & Technology, 27 (5), pp. 1-11. IOP Publishing. DOI: 10.1088/0957-0233/27/5/054001. ISSN 0957-0233.
![Figure 3 Results of theoretical error estimation according to between the stereo cameras Kraus [18] in spanwise direction for increasing distance b [mm]; half span normalized with respective spanwise position; relative error based on finally adopted b = 1000 mm](https://thumb-us.123doks.com/thumbv2/123dok_us/602851.560417/4.595.61.279.58.229/theoretical-estimation-according-direction-increasing-distance-normalized-respective.webp)